Animal Feed Market Size, Share, and Forecast Outlook 2025 to 2035 

The global animal feed market is estimated at USD 605.3 billion in 2025, and a valuation of USD 1,224.6 billion is projected for 2035. This growth is being driven by intensified livestock production, rising animal protein consumption, and government-led food security agendas.
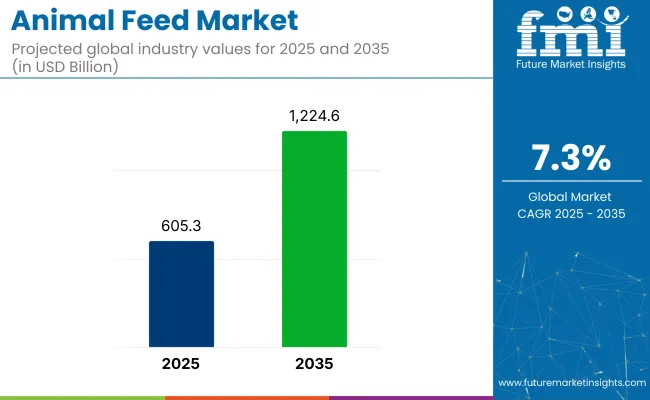
Quick Stats of Animal Feed Market

  • Market Value (2025): USD 605.3 billion
  • Forecast Value (2035): USD 1,224.6 billion
  • Forecast CAGR (2025 to 2035): 7.3%
  • Leading Segment in 2035: Plant-based(68.2% share)
  • Key Growth Region: Asia Pacific (India is the fastest-growing with 8.5% CAGR)
  • Key Players: DSM N.V, BASF SE, Fuji Chemical Industries Co, Divi’s Laboratories, Piveg, Inc, FenchemBiotek Ltd., Alga Technologies, Cyanotech Corporation, Zhejiang NHU Co., Ltd.

Animal Feed Market

Metric Value
Market Size (2025E) USD 605.3 billion
Market Value (2035F) USD 1,224.6 billion
CAGR (2025 to 2035) 7.3%

Feed supply chains are becoming more integrated, enabling efficient movement of cereals, oilseed meals, and micronutrient additives across borders and production nodes. Feed manufacturers are modernizing mills, automating formulations, and embedding traceability features to meet both regulatory and commercial requirements.

In North America, automation upgrades and enzyme-enhanced formulations are reducing feed conversion ratios and improving operational consistency. The European Union has shifted toward non-antibiotic growth promoters, reinforcing uptake of functional additives that align with clean-label protein requirements.

Asia Pacific continues to lead in volume, supported by integrated poultry and aquaculture operations scaling nutrient-dense rations across domestic and export-oriented channels. Latin America is focusing on feed self-sufficiency, particularly for monogastric and ruminant operations concentrated in Brazil and Argentina.

Animal feed accounts for 10-12% of the agriculture and farming market, 40-45% of the livestock and poultry sector, 5-7% of the pet care industry, 2-3% of agricultural equipment usage, and 8-10% of the food processing ecosystem. These shares reflect its foundational role in supporting productivity, health, and efficiency across the protein value chain.

Commercial operations in broiler, swine, and dairy segments are scaling rapidly, requiring consistent nutrient density to support growth, fertility, and disease resistance. Regulatory oversight is reshaping formulation strategy, with bans on sub-therapeutic antibiotics prompting greater reliance on acidifiers, binders, and non-antibiotic performance enhancers. Feed cost remains the single largest input expense in livestock systems, often accounting for 60-70% of total production cost, making formulation precision and raw-material optimization central to margin retention.

Analysis of Animal Feed Market by Top Investment Segments 

The animal feed market is segmented by species into commercial poultry, backyard poultry, ruminants such as cattle, sheep, and goats, swine, and equine. By form, it includes wet/moist food, dry kibble, semi-moist food, frozen, and freeze-dried food. By source, the industry utilizes plant-based, animal-based, and micro-organism-derived ingredients.

Distribution occurs through direct and indirect sales, including modern trade, animal feed stores, veterinary clinics, and online retailers. The market is segmented regionally into North America, Latin America, Western Europe, Eastern Europe, East Asia, South Asia & Pacific, Central Asia, Russia and Belarus, Balkan & Baltic Countries, and Middle East and Africa.

Poultry (Commercial) Dominate Species Segment with 37.4% Share

The poultry (commercial) segment is expected to dominate the global market, holding the largest share of 37.4% in 2025.Demand is driven by the rapid intensification of poultry farming across both developed and emerging economies, where broiler and layer operations are expanding to meet rising consumer demand for affordable meat and eggs.

  • The poultry industry’s relatively short production cycles, high feed conversion efficiency, and increasing global protein intake have made it the most feed-intensive species segment.
  • Major feed producers have optimized formulations for broilers, layers, and breeders, with growing emphasis on balanced amino acid profiles, gut health enhancers, and antibiotic alternatives.
  • Emerging markets in Asia and Latin America are seeing infrastructure investments in commercial poultry farming, further reinforcing the segment’s volume dominance.

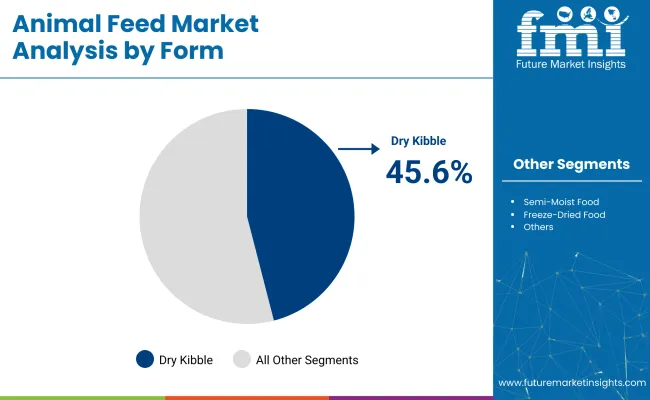
By Form, Dry Kibble Segment Accounts for Over 45.6% Share

The dry kibble segment is projected to dominate the market by form, accounting for an estimated 45.6% share in 2025.Dry kibble remains the preferred choice across both commercial and backyard farming due to its ease of storage, cost-effectiveness, and longer shelf life compared to wet or frozen alternatives.
  • Dry kibble offers efficient bulk handling, reduced spoilage, and compatibility with automated feeding systems, factors that are especially in high-volume poultry and swine operations.
  • Feed manufacturers continue to invest in advanced extrusion and pelletization technologies to improve the nutrient retention, palatability, and digestibility of dry formulations.
  • Dry feed is increasingly being fortified with enzymes, minerals, and plant-based additives to meet animal health and productivity goals while aligning with evolving regulations.

Animal Feed Market By Form

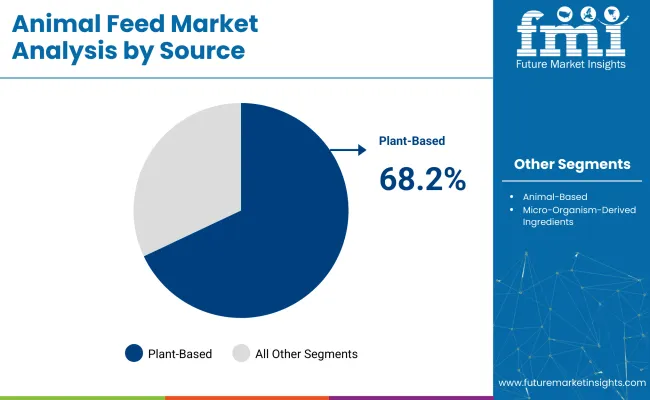
Plant-based Source Drive Industry Demand

The plant-based segment is expected to lead the market by source, capturing a substantial market share of 68.2%. This dominance is attributed to the wide availability, cost efficiency, and nutritional adequacy of plant-derived ingredients such as corn, soybean meal, wheat bran, and rice polish.
  • The growing global production of cereals and oilseeds ensures a steady supply of raw materials, allowing manufacturers to maintain price stability and consistent feed output.
  • Plant-based feeds align with sustainability efforts, as they generally have a lower environmental footprint compared to animal-based counterparts.
  • Formulators are also increasingly incorporating functional plant extracts and fermented plant proteins to enhance digestibility and improve animal immunity.

Animal Feed Market By Source

By Sales Channel, Direct Sales Segment Accounts for Over 34.7% Share

The direct sales segment is projected to dominate the market by sales channel, accounting for an estimated 34.7% share in 2025. Direct sales remain the most preferred route for large-scale commercial farms and institutional buyers, who require consistent supply contracts and customized feed formulations.

  • Direct sales offer better pricing transparency, technical support, and logistical control, livestock operations with high daily feed intake.
  • Feed manufacturers often engage directly with farmers and agribusinesses to streamline supply chains, ensure timely deliveries, and provide advisory services on ration optimization. This model also enables producers to implement feedback loops that enhance product development and improve feed efficiency outcomes.
  • In regions such as North America, Europe, and parts of Asia, where organized commercial farming dominates animal protein production, direct sales continue to represent the most efficient and economically viable distribution channel for high-volume feed transactions.

Top Animal Feed Market Dynamics

Manufacturers are emphasizing precision nutrition, lifecycle-based feed, and functional additives. Strong demand for novel proteins and automated feed systems is shaping product innovation.

Rising Demand for High-Efficiency Feed Solutions

The market is being driven by a global shift toward more efficient and nutritionally optimized feed formulations. As commercial livestock operations scale up, the pressure to maximize feed conversion ratios (FCRs) has grown. Producers are increasingly adopting advanced formulations enriched with amino acids, enzymes, prebiotics, and organic minerals to enhance animal growth, reproductive efficiency, and immunity. Concerns over antimicrobial resistance have accelerated the move toward antibiotic alternatives, including phytogenic feed additives and acidifiers.

Technological Integration and Ingredient Innovation

Precision nutrition platforms, real-time data monitoring, and automated ration balancing systems are allowing producers to tailor feed more accurately to individual animal needs, minimizing waste and optimizing productivity. Concurrently, there is growing exploration of alternative protein sources, such as insect meal, algae-based proteins, and single-cell biomass, to reduce dependency on traditional feed ingredients like soybean meal and fishmeal.
Analysis of Top Countries Manufacturing, Exporting and Supplying Animal Feed Globally

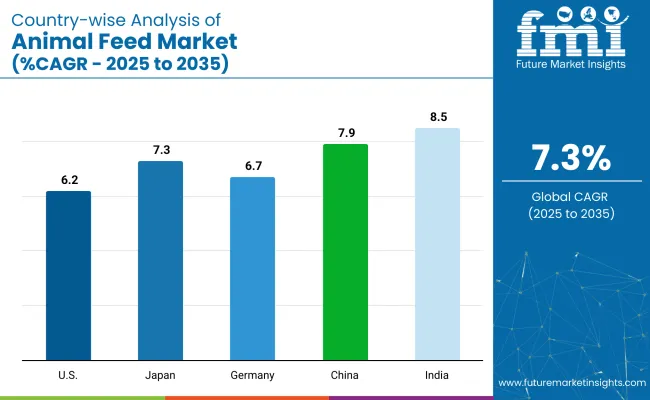
Country Wise Analysis Of Animal Feed Market

Countries CAGR (2025 to 2035)
USA 6.2%
Japan 7.3%
Germany 6.7%
China 7.9%
India 8.5%

Sales of animal feed are projected to grow at a 7.3%CAGR between 2025 and 2035. All five countries highlighted out of 40 analyzed are expected to either exceed or closely match the global growth rate. India leads with 8.5%, followed by China at 7.9%, reflecting expanding livestock operations and rising demand for protein-rich diets. Japan (7.3%), Germany (6.7%), and the United States (6.2%) show measured expansion as feed systems mature and shift toward efficiency-focused solutions.

The growth spread ranges from +17% (India) to -15% (United States) relative to the global baseline. Key contributors to divergence include integrated poultry expansion in India, compound feed scale-up in China, precision formulation in Japan, compliance-driven upgrades in Germany, and specialization in high-protein blends in the USA

  • India outpaces the global average by +1.2 percentage points.
  • China shows a +0.6 point advantage over the baseline.
  • Japan aligns with the global rate; Germany and the USA trail by 0.6-1.1 points.

Growth Analysis of Animal Feed Market in the USA

The USA animal feed market is estimated to grow at 6.2% CAGR during the study period. Growth is being underpinned by the country’s vast commercial poultry, swine, and beef industries, where feed conversion efficiency and bio-security compliance remain decisive cost variables. Expansion is being reinforced by the rebound of the food-service sector, which is pulling larger volumes of meat and dairy through the supply chain and, in turn, stimulating feed demand.

Formulators are increasingly relying on precision-nutrition platforms that process on-farm production data and tailor rations daily, lowering waste and elevating carcass yield. Regulatory pressure from the Food and Drug Administration to curtail routine antibiotic use is prompting accelerated adoption of enzyme complexes, organic acids, and probiotic blends, thereby lifting the average selling price per ton.

  • Tight integration between feed mills and vertically aligned meat processors ensures steady off-take.
  • Advanced extrusion and cold-pelleting lines protect heat-sensitive nutrients, driving premiumization.
  • Federal incentives for methane-reducing feed additives encourage trials in dairy herds, widening product scope.

Animal Feed Market Growth Outlook in Germany

Demand for animal feed in Germany is estimated to grow at 6.7% CAGR during the study period. Expansion is being driven by the country’s rigorous animal-welfare regime, which obliges producers to invest in nutrient-balanced rations that support immune competence and reduce veterinary interventions.

Germany’s dominant pork and poultry sectors are shifting towards higher welfare tiers, necessitating feed formulations with enhanced fibre profiles and specific amino-acid ratios that curb aggressive behaviour and improve gut health.

Strong demand for regionally sourced, non-genetically modified cereals is allowing cooperatives to command price premiums while maintaining traceability through the QS quality-assurance framework. Berlin’s climate objectives are encouraging the uptake of feed additives that lower enteric emissions, channeling R&D capital into algae oils and tannin-based methane reducers.

  • Mandatory antibiotic-reduction targets accelerate demand for phytogenic and acidifier blends.
  • Retailer “Initiative Tierwohl” premiums finance improved feed programmes in pig and broiler farms.
  • Circular-economy policies favour upcycling of brewery and sugar-beet by-products into compound feed.

Demand Forecast for Animal Feed Market in China

Demand for animal feed in China is estimated to grow at 7.9% CAGR during the study period. Recovery of the nation’s swine herd after African swine fever, coupled with relentless urbanisation, is increasing demand for compound and concentrated feeds suited to intensive production systems.

Provincial governments are promoting scale-up of pig farms to minimise disease risk, and such large units require consistent, high-quality rations delivered under forward contracts. Feed conglomerates are investing heavily in fully automated mega-mills along the Yangtze and Pearl River corridors, leveraging economies of scale that compress per-ton costs while enabling rapid formulation shifts when commodity prices swing.

  • Central subsidies for amino-acid and lysine plants reduce reliance on imported additives.
  • Corporate integration from feed milling to meat packing safeguards bio-security and traceability.
  • Feed formulations increasingly incorporate fermented soybean and insect-meal proteins, lowering fish-meal dependence.

Future Outlook for Animal Feed Market in the Japan

The animal feed market in Japan is estimated to grow at 7.3% CAGR during the forecast period. Although livestock numbers are comparatively modest, premiumisation trends and stringent food-safety protocols heighten the value captured per ton of feed. High disposable incomes sustain demand for marbled Wagyu beef, free-range eggs, and antibiotic-free broiler meat, each necessitating meticulously balanced rations rich in omega-3 fatty acids, antioxidants, and trace-minerals.

Imports supply more than half of Japan’s grain needs; feed compounders hedge forex risk by diversifying toward alternative ingredients such as rice bran, copra meal, and domestically cultivated sorghum. Government grants under the Feed Innovation Program support the deployment of Internet-of-Things sensors that monitor animal growth metrics, enabling millers to refine nutrient delivery and reduce feed conversion ratios.

  • Feed mills partner with fisheries to recycle fish-processing by-products into value-added meals.
  • Calf-rearing cooperatives adopt milk-replacer formulas fortified with probiotics, improving survivability.
  • Retailers’ provenance labelling drives uptake of fully traceable, domestically sourced feed ingredients.

Analysis of Animal Feed Market in India

The animal feed market in India is estimated to grow at 8.5% CAGR during the forecast period. Expansion is being energised by the country’s surging dairy and poultry sectors, which supply protein to a population undergoing rapid income growth and urban dietary diversification.

Government schemes such as the RashtriyaGokul Mission encourage genetic improvement of cattle herds, and enhanced productivity creates demand for compound cattle feed rich in bypass protein, minerals, and rumen-protected fats.

Poultry integrators in states like Telangana and Tamil Nadu operate vertically linked value chains, enabling steady off-take of high-energy mash and crumble feeds optimised for fast broiler turnover. Investments in cold-chain infrastructure widen distribution of perishable meat and eggs, indirectly boosting feed throughput.

  • Duty-free import quotas for feed-grade maize temporarily offset domestic grain shortages.
  • Collaborative extension programmes train smallholders in balanced rationing, expanding formal feed penetration.
  • Private equity inflows fund new pelleting capacity, accelerating regional consolidation among mid-sized mills.

Leading Animal Feed Suppliers

The animal feed additive market is driven by established players and emerging innovators focused on nutritional optimization, sustainable ingredient sourcing, and species-specific formulations. Key companies like DSM N.V. and BASF SE lead with a wide range of vitamins, enzymes, and performance-enhancing compounds.

Fuji Chemical Industries and Divi’s Laboratories are known for their expertise in high-purity carotenoids and specialty feed ingredients. Piveg, Inc. and FenchemBiotek Ltd. offer plant-based solutions including lutein and functional phytochemicals. Alga Technologies and Cyanotech Corporation are advancing algae-based proteins and antioxidants for aquafeed and livestock health. In Asia, Zhejiang NHU Co., Ltd. stands out with cost-effective, high-volume production of vitamins and feed-grade additives.

Recent Animal Feed Industry News

  • In February 2024, DSM announced the separation of its Animal Nutrition & Health (ANH) business unit from the dsm-firmenich group, aiming for the business to thrive under different ownership.
  • In January 2025, BASF and Cargill expanded their partnership to the United States, building on their existing enzyme development and distribution agreement.

Leading Players

  • DSM N.V
  • BASF SE
  • Fuji Chemical Industries Co
  • Divi’s Laboratories
  • Piveg, Inc
  • FenchemBiotek Ltd.
  • Alga technologies
  • Cyanotech Corporation
  • Zhejiang NHU Co., Ltd.

Report Coverage and Scope Summary

Report Attributes Details
Market Size (2025) USD 605.3 billion
Projected Market Size (2035) USD 1,224.6 billion
CAGR (2025 to 2035) 7.3%
Base Year for Estimation 2024
Historical Period 2020 to 2024
Projections Period 2025 to 2035
Quantitative Units USD billion for value and volume in tons
Species Analyzed (Segment 1) Livestock Categories, Including Commercial Poultry, Backyard Poultry, Ruminants Such as Cattle, Sheep, And Goats, As Well As Swine And Equine.
Form Analyzed (Segment 2) Wet/Moist Food, Dry Kibble, Semi-moist Food, Frozen, and Freeze-dried Food.
Source Analyzed (Segment 3) Plant-based, Animal-based, and Micro-organisms.
Sales Channel Analyzed (Segment 4) Direct Sales, Indirect Sales, Modern Trade, Animal Feed Stores, Veterinary Clinics, and Online Retailers.
Regions Covered North America, Europe, Asia Pacific, Middle East & Africa, Latin America
Countries Covered United States, Canada, Germany, United Kingdom, France, Italy, Spain, China, Japan, South Korea, India, Australia, Brazil, Mexico, Argentina, Saudi Arabia, UAE, South Africa
Key Players DSM N.V, BASF SE, Fuji Chemical Industries Co, Divi’s Laboratories, Piveg, Inc, Fenchem Biotek Ltd., Alga Technologies, Cyanotech Corporation, Zhejiang NHU Co., Ltd.
Additional Attributes Dollar sales, growth rates, segment share, species-specific demand, top regions by volume, feed ingredient trends, competitive share, pricing benchmarks, sales channel share, and regulatory impacts.

Key Segments

By Species:

The market caters to various livestock categories, including commercial poultry, backyard poultry, ruminants such as cattle, sheep, and goats, as well as swine and equine.

By Form:

Animal feed is available in multiple formats, including wet/moist food, dry kibble, semi-moist food, frozen, and freeze-dried food, offering flexibility for different dietary needs.

By Source:

The feed industry incorporates diverse sources such as plant-based, animal-based, and micro-organism-derived ingredients to ensure nutritional balance.

By Sales Channel:

Distribution takes place through direct and indirect sales, including modern trade, animal feed stores, veterinary clinics, and online retailers, making products widely accessible.

By Region:

The market is segmented as North America, Latin America, Western Europe, Eastern Europe, East Asia, South Asia & Pacific, Central Asia, Russia and Belarus, Balkan & Baltic Countries, Middle East and Africa.

Table of Content

  1. Executive Summary
    • Global Market Outlook
    • Demand-side Trends
    • Supply-side Trends
    • Technology Roadmap Analysis
    • Analysis and Recommendations
  2. Market Overview
    • Market Coverage / Taxonomy
    • Market Definition / Scope / Limitations
  3. Market Background
    • Market Dynamics
      • Drivers
      • Restraints
      • Opportunity
      • Trends
    • Scenario Forecast
      • Demand in Optimistic Scenario
      • Demand in Likely Scenario
      • Demand in Conservative Scenario
    • Opportunity Map Analysis
    • Product Life Cycle Analysis
    • Supply Chain Analysis
      • Supply Side Participants and their Roles
        • Producers
        • Mid-Level Participants (Traders/ Agents/ Brokers)
        • Wholesalers and Distributors
      • Value Added and Value Created at Node in the Supply Chain
      • List of Raw Material Suppliers
      • List of Existing and Potential Buyer’s
    • Investment Feasibility Matrix
    • Value Chain Analysis
      • Profit Margin Analysis
      • Wholesalers and Distributors
      • Retailers
    • PESTLE and Porter’s Analysis
    • Regulatory Landscape
      • By Key Regions
      • By Key Countries
    • Regional Parent Market Outlook
    • Production and Consumption Statistics
    • Import and Export Statistics
  4. Global Market Analysis 2020-2024 and Forecast, 2025-2035
    • Historical Market Size Value (USD Billion) & Volume (tons) Analysis, 2020-2024
    • Current and Future Market Size Value (USD Billion) & Volume (tons) Projections, 2025-2035
      • Y-o-Y Growth Trend Analysis
      • Absolute $ Opportunity Analysis
  5. Global Market Pricing Analysis 2020-2024 and Forecast 2025-2035
  6. Global Market Analysis 2020-2024 and Forecast 2025-2035, By Species
    • Introduction / Key Findings
    • Historical Market Size Value (USD Billion) & Volume (tons) Analysis By Species, 2020-2024
    • Current and Future Market Size Value (USD Billion) & Volume (tons) Analysis and Forecast By Species, 2025-2035
      • Poultry (Commercial)
      • Backyard Poultry
      • Ruminants (Cattle, Sheep, Goats)
      • Swine
      • Equine
    • Y-o-Y Growth Trend Analysis By Species, 2020-2024
    • Absolute $ Opportunity Analysis By Species, 2025-2035
  7. Global Market Analysis 2020-2024 and Forecast 2025-2035, By Form
    • Introduction / Key Findings
    • Historical Market Size Value (USD Billion) & Volume (tons) Analysis By Form, 2020-2024
    • Current and Future Market Size Value (USD Billion) & Volume (tons) Analysis and Forecast By Form, 2025-2035
      • Wet/Moist Food
      • Dry Kibble
      • Semi-moist Food
      • Frozen
      • Freeze-dried Food
    • Y-o-Y Growth Trend Analysis By Form, 2020-2024
    • Absolute $ Opportunity Analysis By Form, 2025-2035
  8. Global Market Analysis 2020-2024 and Forecast 2025-2035, By Source
    • Introduction / Key Findings
    • Historical Market Size Value (USD Billion) & Volume (tons) Analysis By Source, 2020-2024
    • Current and Future Market Size Value (USD Billion) & Volume (tons) Analysis and Forecast By Source, 2025-2035
      • Plant-based
      • Animal-based
      • Micro-organisms
    • Y-o-Y Growth Trend Analysis By Source, 2020-2024
    • Absolute $ Opportunity Analysis By Source, 2025-2035
  9. Global Market Analysis 2020-2024 and Forecast 2025-2035, By Sales Channel
    • Introduction / Key Findings
    • Historical Market Size Value (USD Billion) & Volume (tons) Analysis By Sales Channel, 2020-2024
    • Current and Future Market Size Value (USD Billion) & Volume (tons) Analysis and Forecast By Sales Channel, 2025-2035
      • Direct Sales
      • Indirect Sales
      • Modern Trade
      • Stores
      • Veterinary Clinics
      • Online Retailers
    • Y-o-Y Growth Trend Analysis By Sales Channel, 2020-2024
    • Absolute $ Opportunity Analysis By Sales Channel, 2025-2035
  10. Global Market Analysis 2020-2024 and Forecast 2025-2035, By Region
    • Introduction
    • Historical Market Size Value (USD Billion) & Volume (tons) Analysis By Region, 2020-2024
    • Current Market Size Value (USD Billion) & Volume (tons) Analysis and Forecast By Region, 2025-2035
      • North America
      • Latin America
      • Western Europe
      • Eastern Europe
      • East Asia
      • South Asia & Pacific
      • Middle East and Africa
    • Market Attractiveness Analysis By Region
  11. North America Market Analysis 2020-2024 and Forecast 2025-2035, By Country
    • Historical Market Size Value (USD Billion) & Volume (tons) Trend Analysis By Market Taxonomy, 2020-2024
    • Market Size Value (USD Billion) & Volume (tons) Forecast By Market Taxonomy, 2025-2035
      • By Country
        • USA
        • Canada
        • Mexico
      • By Species
      • By Form
      • By Source
      • By Sales Channel
    • Market Attractiveness Analysis
      • By Country
      • By Species
      • By Form
      • By Source
      • By Sales Channel
    • Key Takeaways
  12. Latin America Market Analysis 2020-2024 and Forecast 2025-2035, By Country
    • Historical Market Size Value (USD Billion) & Volume (tons) Trend Analysis By Market Taxonomy, 2020-2024
    • Market Size Value (USD Billion) & Volume (tons) Forecast By Market Taxonomy, 2025-2035
      • By Country
        • Brazil
        • Argentina
        • Rest of LATAM
      • By Species
      • By Form
      • By Source
      • By Sales Channel
    • Market Attractiveness Analysis
      • By Country
      • By Species
      • By Form
      • By Source
      • By Sales Channel
    • Key Takeaways
  13. Western Europe Market Analysis 2020-2024 and Forecast 2025-2035, By Country
    • Historical Market Size Value (USD Billion) & Volume (tons) Trend Analysis By Market Taxonomy, 2020-2024
    • Market Size Value (USD Billion) & Volume (tons) Forecast By Market Taxonomy, 2025-2035
      • By Country
        • Germany
        • Italy
        • France
        • UK
        • Spain
        • BENELUX
        • Nordic
        • Rest of W.Europe
      • By Species
      • By Form
      • By Source
      • By Sales Channel
    • Market Attractiveness Analysis
      • By Country
      • By Species
      • By Form
      • By Source
      • By Sales Channel
    • Key Takeaways
  14. Eastern Europe Market Analysis 2020-2024 and Forecast 2025-2035, By Country
    • Historical Market Size Value (USD Billion) & Volume (tons) Trend Analysis By Market Taxonomy, 2020-2024
    • Market Size Value (USD Billion) & Volume (tons) Forecast By Market Taxonomy, 2025-2035
      • By Country
        • Russia
        • Hungary
        • Poland
        • Balkan & Baltics
        • Rest of E. Europe
      • By Species
      • By Form
      • By Source
      • By Sales Channel
    • Market Attractiveness Analysis
      • By Country
      • By Species
      • By Form
      • By Source
      • By Sales Channel
    • Key Takeaways
  15. East Asia Market Analysis 2020-2024 and Forecast 2025-2035, By Country
    • Historical Market Size Value (USD Billion) & Volume (tons) Trend Analysis By Market Taxonomy, 2020-2024
    • Market Size Value (USD Billion) & Volume (tons) Forecast By Market Taxonomy, 2025-2035
      • By Country
        • China
        • Japan
        • South Korea
      • By Species
      • By Form
      • By Source
      • By Sales Channel
    • Market Attractiveness Analysis
      • By Country
      • By Species
      • By Form
      • By Source
      • By Sales Channel
    • Key Takeaways
  16. South Asia & Pacific Market Analysis 2020-2024 and Forecast 2025-2035, By Country
    • Historical Market Size Value (USD Billion) & Volume (tons) Trend Analysis By Market Taxonomy, 2020-2024
    • Market Size Value (USD Billion) & Volume (tons) Forecast By Market Taxonomy, 2025-2035
      • By Country
        • India
        • Australia & New Zealand
        • ASEAN
        • Rest of SAP
      • By Species
      • By Form
      • By Source
      • By Sales Channel
    • Market Attractiveness Analysis
      • By Country
      • By Species
      • By Form
      • By Source
      • By Sales Channel
    • Key Takeaways
  17. Middle East and Africa Market Analysis 2020-2024 and Forecast 2025-2035, By Country
    • Historical Market Size Value (USD Billion) & Volume (tons) Trend Analysis By Market Taxonomy, 2020-2024
    • Market Size Value (USD Billion) & Volume (tons) Forecast By Market Taxonomy, 2025-2035
      • By Country
        • GCC Countries
        • Northern Africa
        • South Africa
        • Turkiye
        • Rest of MEA
      • By Species
      • By Form
      • By Source
      • By Sales Channel
    • Market Attractiveness Analysis
      • By Country
      • By Species
      • By Form
      • By Source
      • By Sales Channel
    • Key Takeaways
  18. Key Countries Market Analysis
    • USA
      • Pricing Analysis
      • Market Share Analysis, 2024
        • By Species
        • By Form
        • By Source
        • By Sales Channel
    • Canada
      • Pricing Analysis
      • Market Share Analysis, 2024
        • By Species
        • By Form
        • By Source
        • By Sales Channel
    • Brazil
      • Pricing Analysis
      • Market Share Analysis, 2024
        • By Species
        • By Form
        • By Source
        • By Sales Channel
    • Mexico
      • Pricing Analysis
      • Market Share Analysis, 2024
        • By Species
        • By Form
        • By Source
        • By Sales Channel
    • Argentina
      • Pricing Analysis
      • Market Share Analysis, 2024
        • By Species
        • By Form
        • By Source
        • By Sales Channel
  19. Market Structure Analysis
    • Competition Dashboard
    • Competition Benchmarking
    • Market Share Analysis of Top Players
      • By Regional
      • By Species
      • By Form
      • By Source
      • By Sales Channel
  20. Competition Analysis
    • Competition Deep Dive
      • DSM N.V
        • Overview
        • Product Portfolio
        • Profitability by Market Segments (Product/Age /Sales Channel/Region)
        • Sales Footprint
        • Strategy Overview
          • Marketing Strategy
          • Product Strategy
          • Channel Strategy
      • BASF SE
        • Overview
        • Product Portfolio
        • Profitability by Market Segments (Product/Age /Sales Channel/Region)
        • Sales Footprint
        • Strategy Overview
          • Marketing Strategy
          • Product Strategy
          • Channel Strategy
      • Fuji Chemical Industries Co
        • Overview
        • Product Portfolio
        • Profitability by Market Segments (Product/Age /Sales Channel/Region)
        • Sales Footprint
        • Strategy Overview
          • Marketing Strategy
          • Product Strategy
          • Channel Strategy
      • Divi’s Laboratories
        • Overview
        • Product Portfolio
        • Profitability by Market Segments (Product/Age /Sales Channel/Region)
        • Sales Footprint
        • Strategy Overview
          • Marketing Strategy
          • Product Strategy
          • Channel Strategy
      • Piveg, Inc
        • Overview
        • Product Portfolio
        • Profitability by Market Segments (Product/Age /Sales Channel/Region)
        • Sales Footprint
        • Strategy Overview
          • Marketing Strategy
          • Product Strategy
          • Channel Strategy
      • Fenchem Biotek Ltd.
        • Overview
        • Product Portfolio
        • Profitability by Market Segments (Product/Age /Sales Channel/Region)
        • Sales Footprint
        • Strategy Overview
          • Marketing Strategy
          • Product Strategy
          • Channel Strategy
      • Alga technologies
        • Overview
        • Product Portfolio
        • Profitability by Market Segments (Product/Age /Sales Channel/Region)
        • Sales Footprint
        • Strategy Overview
          • Marketing Strategy
          • Product Strategy
          • Channel Strategy
      • Cyanotech Corporation
        • Overview
        • Product Portfolio
        • Profitability by Market Segments (Product/Age /Sales Channel/Region)
        • Sales Footprint
        • Strategy Overview
          • Marketing Strategy
          • Product Strategy
          • Channel Strategy
      • Zhejiang NHU Co., Ltd
        • Overview
        • Product Portfolio
        • Profitability by Market Segments (Product/Age /Sales Channel/Region)
        • Sales Footprint
        • Strategy Overview
          • Marketing Strategy
          • Product Strategy
          • Channel Strategy
      • Others Prominent Market Player
        • Overview
        • Product Portfolio
        • Profitability by Market Segments (Product/Age /Sales Channel/Region)
        • Sales Footprint
        • Strategy Overview
          • Marketing Strategy
          • Product Strategy
          • Channel Strategy
  21. Assumptions & Acronyms Used
  22. Research Methodology

List of Tables

  • Table 1: Global Market Value (USD Billion) Forecast by Region, 2020-2035
  • Table 2: Global Market Volume (tons) Forecast by Region, 2020-2035
  • Table 3: Global Market Value (USD Billion) Forecast by Species, 2020-2035
  • Table 4: Global Market Volume (tons) Forecast by Species, 2020-2035
  • Table 5: Global Market Value (USD Billion) Forecast by Form, 2020-2035
  • Table 6: Global Market Volume (tons) Forecast by Form, 2020-2035
  • Table 7: Global Market Value (USD Billion) Forecast by Source, 2020-2035
  • Table 8: Global Market Volume (tons) Forecast by Source, 2020-2035
  • Table 9: Global Market Value (USD Billion) Forecast by Sales Channel, 2020-2035
  • Table 10: Global Market Volume (tons) Forecast by Sales Channel, 2020-2035
  • Table 11: North America Market Value (USD Billion) Forecast by Country, 2020-2035
  • Table 12: North America Market Volume (tons) Forecast by Country, 2020-2035
  • Table 13: North America Market Value (USD Billion) Forecast by Species, 2020-2035
  • Table 14: North America Market Volume (tons) Forecast by Species, 2020-2035
  • Table 15: North America Market Value (USD Billion) Forecast by Form, 2020-2035
  • Table 16: North America Market Volume (tons) Forecast by Form, 2020-2035
  • Table 17: North America Market Value (USD Billion) Forecast by Source, 2020-2035
  • Table 18: North America Market Volume (tons) Forecast by Source, 2020-2035
  • Table 19: North America Market Value (USD Billion) Forecast by Sales Channel, 2020-2035
  • Table 20: North America Market Volume (tons) Forecast by Sales Channel, 2020-2035
  • Table 21: Latin America Market Value (USD Billion) Forecast by Country, 2020-2035
  • Table 22: Latin America Market Volume (tons) Forecast by Country, 2020-2035
  • Table 23: Latin America Market Value (USD Billion) Forecast by Species, 2020-2035
  • Table 24: Latin America Market Volume (tons) Forecast by Species, 2020-2035
  • Table 25: Latin America Market Value (USD Billion) Forecast by Form, 2020-2035
  • Table 26: Latin America Market Volume (tons) Forecast by Form, 2020-2035
  • Table 27: Latin America Market Value (USD Billion) Forecast by Source, 2020-2035
  • Table 28: Latin America Market Volume (tons) Forecast by Source, 2020-2035
  • Table 29: Latin America Market Value (USD Billion) Forecast by Sales Channel, 2020-2035
  • Table 30: Latin America Market Volume (tons) Forecast by Sales Channel, 2020-2035
  • Table 31: Western Europe Market Value (USD Billion) Forecast by Country, 2020-2035
  • Table 32: Western Europe Market Volume (tons) Forecast by Country, 2020-2035
  • Table 33: Western Europe Market Value (USD Billion) Forecast by Species, 2020-2035
  • Table 34: Western Europe Market Volume (tons) Forecast by Species, 2020-2035
  • Table 35: Western Europe Market Value (USD Billion) Forecast by Form, 2020-2035
  • Table 36: Western Europe Market Volume (tons) Forecast by Form, 2020-2035
  • Table 37: Western Europe Market Value (USD Billion) Forecast by Source, 2020-2035
  • Table 38: Western Europe Market Volume (tons) Forecast by Source, 2020-2035
  • Table 39: Western Europe Market Value (USD Billion) Forecast by Sales Channel, 2020-2035
  • Table 40: Western Europe Market Volume (tons) Forecast by Sales Channel, 2020-2035
  • Table 41: Eastern Europe Market Value (USD Billion) Forecast by Country, 2020-2035
  • Table 42: Eastern Europe Market Volume (tons) Forecast by Country, 2020-2035
  • Table 43: Eastern Europe Market Value (USD Billion) Forecast by Species, 2020-2035
  • Table 44: Eastern Europe Market Volume (tons) Forecast by Species, 2020-2035
  • Table 45: Eastern Europe Market Value (USD Billion) Forecast by Form, 2020-2035
  • Table 46: Eastern Europe Market Volume (tons) Forecast by Form, 2020-2035
  • Table 47: Eastern Europe Market Value (USD Billion) Forecast by Source, 2020-2035
  • Table 48: Eastern Europe Market Volume (tons) Forecast by Source, 2020-2035
  • Table 49: Eastern Europe Market Value (USD Billion) Forecast by Sales Channel, 2020-2035
  • Table 50: Eastern Europe Market Volume (tons) Forecast by Sales Channel, 2020-2035
  • Table 51: East Asia Market Value (USD Billion) Forecast by Country, 2020-2035
  • Table 52: East Asia Market Volume (tons) Forecast by Country, 2020-2035
  • Table 53: East Asia Market Value (USD Billion) Forecast by Species, 2020-2035
  • Table 54: East Asia Market Volume (tons) Forecast by Species, 2020-2035
  • Table 55: East Asia Market Value (USD Billion) Forecast by Form, 2020-2035
  • Table 56: East Asia Market Volume (tons) Forecast by Form, 2020-2035
  • Table 57: East Asia Market Value (USD Billion) Forecast by Source, 2020-2035
  • Table 58: East Asia Market Volume (tons) Forecast by Source, 2020-2035
  • Table 59: East Asia Market Value (USD Billion) Forecast by Sales Channel, 2020-2035
  • Table 60: East Asia Market Volume (tons) Forecast by Sales Channel, 2020-2035
  • Table 61: South Asia & Pacific Market Value (USD Billion) Forecast by Country, 2020-2035
  • Table 62: South Asia & Pacific Market Volume (tons) Forecast by Country, 2020-2035
  • Table 63: South Asia & Pacific Market Value (USD Billion) Forecast by Species, 2020-2035
  • Table 64: South Asia & Pacific Market Volume (tons) Forecast by Species, 2020-2035
  • Table 65: South Asia & Pacific Market Value (USD Billion) Forecast by Form, 2020-2035
  • Table 66: South Asia & Pacific Market Volume (tons) Forecast by Form, 2020-2035
  • Table 67: South Asia & Pacific Market Value (USD Billion) Forecast by Source, 2020-2035
  • Table 68: South Asia & Pacific Market Volume (tons) Forecast by Source, 2020-2035
  • Table 69: South Asia & Pacific Market Value (USD Billion) Forecast by Sales Channel, 2020-2035
  • Table 70: South Asia & Pacific Market Volume (tons) Forecast by Sales Channel, 2020-2035
  • Table 71: Middle East and Africa Market Value (USD Billion) Forecast by Country, 2020-2035
  • Table 72: Middle East and Africa Market Volume (tons) Forecast by Country, 2020-2035
  • Table 73: Middle East and Africa Market Value (USD Billion) Forecast by Species, 2020-2035
  • Table 74: Middle East and Africa Market Volume (tons) Forecast by Species, 2020-2035
  • Table 75: Middle East and Africa Market Value (USD Billion) Forecast by Form, 2020-2035
  • Table 76: Middle East and Africa Market Volume (tons) Forecast by Form, 2020-2035
  • Table 77: Middle East and Africa Market Value (USD Billion) Forecast by Source, 2020-2035
  • Table 78: Middle East and Africa Market Volume (tons) Forecast by Source, 2020-2035
  • Table 79: Middle East and Africa Market Value (USD Billion) Forecast by Sales Channel, 2020-2035
  • Table 80: Middle East and Africa Market Volume (tons) Forecast by Sales Channel, 2020-2035

List of Figures

  • Figure 1: Global Market Volume (tons) Forecast 2020-2035
  • Figure 2: Global Market Pricing Analysis
  • Figure 3: Global Market Value (USD Billion) Forecast 2020-2035
  • Figure 4: Global Market Value Share and BPS Analysis by Species, 2025 and 2035
  • Figure 5: Global Market Y-o-Y Growth Comparison by Species, 2025-2035
  • Figure 6: Global Market Attractiveness Analysis by Species
  • Figure 7: Global Market Value Share and BPS Analysis by Form, 2025 and 2035
  • Figure 8: Global Market Y-o-Y Growth Comparison by Form, 2025-2035
  • Figure 9: Global Market Attractiveness Analysis by Form
  • Figure 10: Global Market Value Share and BPS Analysis by Source, 2025 and 2035
  • Figure 11: Global Market Y-o-Y Growth Comparison by Source, 2025-2035
  • Figure 12: Global Market Attractiveness Analysis by Source
  • Figure 13: Global Market Value Share and BPS Analysis by Sales Channel, 2025 and 2035
  • Figure 14: Global Market Y-o-Y Growth Comparison by Sales Channel, 2025-2035
  • Figure 15: Global Market Attractiveness Analysis by Sales Channel
  • Figure 16: Global Market Value (USD Billion) Share and BPS Analysis by Region, 2025 and 2035
  • Figure 17: Global Market Y-o-Y Growth Comparison by Region, 2025-2035
  • Figure 18: Global Market Attractiveness Analysis by Region
  • Figure 19: North America Market Incremental $ Opportunity, 2025-2035
  • Figure 20: Latin America Market Incremental $ Opportunity, 2025-2035
  • Figure 21: Western Europe Market Incremental $ Opportunity, 2025-2035
  • Figure 22: Eastern Europe Market Incremental $ Opportunity, 2025-2035
  • Figure 23: East Asia Market Incremental $ Opportunity, 2025-2035
  • Figure 24: South Asia & Pacific Market Incremental $ Opportunity, 2025-2035
  • Figure 25: Middle East and Africa Market Incremental $ Opportunity, 2025-2035
  • Figure 26: North America Market Value Share and BPS Analysis by Country, 2025 and 2035
  • Figure 27: North America Market Value Share and BPS Analysis by Species, 2025 and 2035
  • Figure 28: North America Market Y-o-Y Growth Comparison by Species, 2025-2035
  • Figure 29: North America Market Attractiveness Analysis by Species
  • Figure 30: North America Market Value Share and BPS Analysis by Form, 2025 and 2035
  • Figure 31: North America Market Y-o-Y Growth Comparison by Form, 2025-2035
  • Figure 32: North America Market Attractiveness Analysis by Form
  • Figure 33: North America Market Value Share and BPS Analysis by Source, 2025 and 2035
  • Figure 34: North America Market Y-o-Y Growth Comparison by Source, 2025-2035
  • Figure 35: North America Market Attractiveness Analysis by Source
  • Figure 36: North America Market Value Share and BPS Analysis by Sales Channel, 2025 and 2035
  • Figure 37: North America Market Y-o-Y Growth Comparison by Sales Channel, 2025-2035
  • Figure 38: North America Market Attractiveness Analysis by Sales Channel
  • Figure 39: Latin America Market Value Share and BPS Analysis by Country, 2025 and 2035
  • Figure 40: Latin America Market Value Share and BPS Analysis by Species, 2025 and 2035
  • Figure 41: Latin America Market Y-o-Y Growth Comparison by Species, 2025-2035
  • Figure 42: Latin America Market Attractiveness Analysis by Species
  • Figure 43: Latin America Market Value Share and BPS Analysis by Form, 2025 and 2035
  • Figure 44: Latin America Market Y-o-Y Growth Comparison by Form, 2025-2035
  • Figure 45: Latin America Market Attractiveness Analysis by Form
  • Figure 46: Latin America Market Value Share and BPS Analysis by Source, 2025 and 2035
  • Figure 47: Latin America Market Y-o-Y Growth Comparison by Source, 2025-2035
  • Figure 48: Latin America Market Attractiveness Analysis by Source
  • Figure 49: Latin America Market Value Share and BPS Analysis by Sales Channel, 2025 and 2035
  • Figure 50: Latin America Market Y-o-Y Growth Comparison by Sales Channel, 2025-2035
  • Figure 51: Latin America Market Attractiveness Analysis by Sales Channel
  • Figure 52: Western Europe Market Value Share and BPS Analysis by Country, 2025 and 2035
  • Figure 53: Western Europe Market Value Share and BPS Analysis by Species, 2025 and 2035
  • Figure 54: Western Europe Market Y-o-Y Growth Comparison by Species, 2025-2035
  • Figure 55: Western Europe Market Attractiveness Analysis by Species
  • Figure 56: Western Europe Market Value Share and BPS Analysis by Form, 2025 and 2035
  • Figure 57: Western Europe Market Y-o-Y Growth Comparison by Form, 2025-2035
  • Figure 58: Western Europe Market Attractiveness Analysis by Form
  • Figure 59: Western Europe Market Value Share and BPS Analysis by Source, 2025 and 2035
  • Figure 60: Western Europe Market Y-o-Y Growth Comparison by Source, 2025-2035
  • Figure 61: Western Europe Market Attractiveness Analysis by Source
  • Figure 62: Western Europe Market Value Share and BPS Analysis by Sales Channel, 2025 and 2035
  • Figure 63: Western Europe Market Y-o-Y Growth Comparison by Sales Channel, 2025-2035
  • Figure 64: Western Europe Market Attractiveness Analysis by Sales Channel
  • Figure 65: Eastern Europe Market Value Share and BPS Analysis by Country, 2025 and 2035
  • Figure 66: Eastern Europe Market Value Share and BPS Analysis by Species, 2025 and 2035
  • Figure 67: Eastern Europe Market Y-o-Y Growth Comparison by Species, 2025-2035
  • Figure 68: Eastern Europe Market Attractiveness Analysis by Species
  • Figure 69: Eastern Europe Market Value Share and BPS Analysis by Form, 2025 and 2035
  • Figure 70: Eastern Europe Market Y-o-Y Growth Comparison by Form, 2025-2035
  • Figure 71: Eastern Europe Market Attractiveness Analysis by Form
  • Figure 72: Eastern Europe Market Value Share and BPS Analysis by Source, 2025 and 2035
  • Figure 73: Eastern Europe Market Y-o-Y Growth Comparison by Source, 2025-2035
  • Figure 74: Eastern Europe Market Attractiveness Analysis by Source
  • Figure 75: Eastern Europe Market Value Share and BPS Analysis by Sales Channel, 2025 and 2035
  • Figure 76: Eastern Europe Market Y-o-Y Growth Comparison by Sales Channel, 2025-2035
  • Figure 77: Eastern Europe Market Attractiveness Analysis by Sales Channel
  • Figure 78: East Asia Market Value Share and BPS Analysis by Country, 2025 and 2035
  • Figure 79: East Asia Market Value Share and BPS Analysis by Species, 2025 and 2035
  • Figure 80: East Asia Market Y-o-Y Growth Comparison by Species, 2025-2035
  • Figure 81: East Asia Market Attractiveness Analysis by Species
  • Figure 82: East Asia Market Value Share and BPS Analysis by Form, 2025 and 2035
  • Figure 83: East Asia Market Y-o-Y Growth Comparison by Form, 2025-2035
  • Figure 84: East Asia Market Attractiveness Analysis by Form
  • Figure 85: East Asia Market Value Share and BPS Analysis by Source, 2025 and 2035
  • Figure 86: East Asia Market Y-o-Y Growth Comparison by Source, 2025-2035
  • Figure 87: East Asia Market Attractiveness Analysis by Source
  • Figure 88: East Asia Market Value Share and BPS Analysis by Sales Channel, 2025 and 2035
  • Figure 89: East Asia Market Y-o-Y Growth Comparison by Sales Channel, 2025-2035
  • Figure 90: East Asia Market Attractiveness Analysis by Sales Channel
  • Figure 91: South Asia & Pacific Market Value Share and BPS Analysis by Country, 2025 and 2035
  • Figure 92: South Asia & Pacific Market Value Share and BPS Analysis by Species, 2025 and 2035
  • Figure 93: South Asia & Pacific Market Y-o-Y Growth Comparison by Species, 2025-2035
  • Figure 94: South Asia & Pacific Market Attractiveness Analysis by Species
  • Figure 95: South Asia & Pacific Market Value Share and BPS Analysis by Form, 2025 and 2035
  • Figure 96: South Asia & Pacific Market Y-o-Y Growth Comparison by Form, 2025-2035
  • Figure 97: South Asia & Pacific Market Attractiveness Analysis by Form
  • Figure 98: South Asia & Pacific Market Value Share and BPS Analysis by Source, 2025 and 2035
  • Figure 99: South Asia & Pacific Market Y-o-Y Growth Comparison by Source, 2025-2035
  • Figure 100: South Asia & Pacific Market Attractiveness Analysis by Source
  • Figure 101: South Asia & Pacific Market Value Share and BPS Analysis by Sales Channel, 2025 and 2035
  • Figure 102: South Asia & Pacific Market Y-o-Y Growth Comparison by Sales Channel, 2025-2035
  • Figure 103: South Asia & Pacific Market Attractiveness Analysis by Sales Channel
  • Figure 104: Middle East and Africa Market Value Share and BPS Analysis by Country, 2025 and 2035
  • Figure 105: Middle East and Africa Market Value Share and BPS Analysis by Species, 2025 and 2035
  • Figure 106: Middle East and Africa Market Y-o-Y Growth Comparison by Species, 2025-2035
  • Figure 107: Middle East and Africa Market Attractiveness Analysis by Species
  • Figure 108: Middle East and Africa Market Value Share and BPS Analysis by Form, 2025 and 2035
  • Figure 109: Middle East and Africa Market Y-o-Y Growth Comparison by Form, 2025-2035
  • Figure 110: Middle East and Africa Market Attractiveness Analysis by Form
  • Figure 111: Middle East and Africa Market Value Share and BPS Analysis by Source, 2025 and 2035
  • Figure 112: Middle East and Africa Market Y-o-Y Growth Comparison by Source, 2025-2035
  • Figure 113: Middle East and Africa Market Attractiveness Analysis by Source
  • Figure 114: Middle East and Africa Market Value Share and BPS Analysis by Sales Channel, 2025 and 2035
  • Figure 115: Middle East and Africa Market Y-o-Y Growth Comparison by Sales Channel, 2025-2035
  • Figure 116: Middle East and Africa Market Attractiveness Analysis by Sales Channel
  • Figure 117: Global Market - Tier Structure Analysis
  • Figure 118: Global Market - Company Share Analysis

Frequently Asked Questions

What is the estimated value of the animal feed industry in 2025?

The global animal feed industry is projected to reach USD 605.3 billion in 2025.

Who are the leading manufacturers of animal feed?

Key players include DSM N.V; BASF SE; Parry Nutraceutical; Fuji Chemical Industries Co; Divi’s Laboratories; Piveg, Inc; Fenchem Biotek Ltd.

What is the projected industry size of the animal feed industry by 2035?

It is forecasted to reach USD 1,224.6 billion by 2035.

What is the expected CAGR of the animal feed market from 2025 to 2035?

The industry is forecasted to grow at a CAGR of 7.3% from 2025 to 2035.

What factors are driving the growth of the animal feed market?

Key drivers include rising global demand for high-quality protein sources, increasing use of functional feed additives, and advancements in alternative protein feed production.

Explore Similar Insights

Future Market Insights

Animal Feed Market