Reports

- Global Locations -

Headquarters

Future Market Insights, Inc.

Christiana Corporate, 200
Continental Drive, Suite 401,
Newark, Delaware - 19713,
United States

T: +1-845-579-5705

Americas

Future Market Insights, Inc.

616 Corporate Way, Suite 2-9018,
Valley Cottage, NY 10989, United States

T: +1-347-918-3531

MEA

Future Market Insights

1602-6 Jumeirah Bay X2 Tower, Plot No: JLT-PH2-X2A,
Jumeirah Lakes Towers, Dubai,
United Arab Emirates

Europe

Future Market Insights

3rd Floor, 207 Regent Street,
W1B 3HH London
United Kingdom

T: + 44 (0) 20 8123 9659
D: +44 (0) 20 3287 4268

Asia Pacific

Future Market Insights

IndiaLand Global Tech Park, Unit UG-1, Behind Grand HighStreet, Phase 1, Hinjawadi, MH, Pune – 411057, India

Animal Feed Preservative Market Outlook from 2024 to 2034

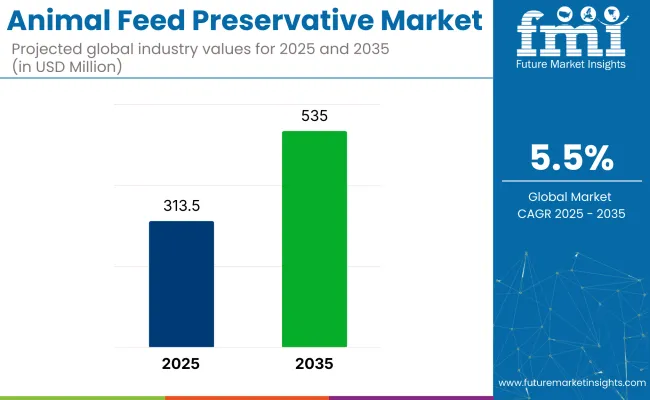
The animal feed preservative market is poised to register at a CAGR of 5.5% through 2034. The market is penned in to increase from US$ 298.6 million in 2024 to US$ 512.2 million by 2034.

Attributes Details
Animal Feed Preservative Market Size, 2024 US$ 298.6 million
Forecast Market Size, 2034 US$ 512.2 million
Value-based CAGR (2024 to 2034) 5.5%

Don't pay for what you don't need

Customize your report by selecting specific countries or regions and save 30%!

Investment Opportunities in the Animal Feed Preservative Market

Developing Innovative Feed Additives

Developing innovative feed additives and supplements will be a significant investment opportunity for the feed producers. Consumers are increasingly demanding feed additives that contain all nutrients that are required for the healthy growth of animals.

In the current period, very few market players are offering this preservative, thus the manufacturing companies have the opportunity to gain maximum potential in the market by introducing these products.

Development of the Natural Preservative

Development of the natural preservative will considered a lucrative investment potential for animal feed producers. Concerns regarding sustainability worldwide, consumer are shifting their preference toward natural products.

Moreover, several governments are implementing rules and regulations for eco-friendly production, thus the companies have immense growth opportunities by developing natural and organic feed preservatives in the current period.

Investment in vertical integration is anticipated to mark an immense opportunity for the manufacturers. As the market becomes more competitive, manufacturers are seeking to integrate their supply chains to minimize their costs and increase production.

Key Market Drivers

  • Demand for animal-based products such as meat, dairy products, and others is anticipated to lead to market growth during the forecast period. Animal-based product producers are actively seeking the ingredients that maintain their animal health, thus animal feed preservatives emerged as key aspects for them.
  • Increasing awareness about animal health among farmers, pet owners, and other stakeholders is actively driving the demand for the industry. This is driving the demand for animal feed preservatives, as consumers seek to ensure the safety and quality of the feed they provide to their animals.
Nandini Roy Choudhury

Principal Consultant

Talk to Analyst

Find your sweet spots for generating winning opportunities in this market.

Some Challenges for the Animal Feed Preservative Market

  • Stricter regulation by the government and governmental bodies is hindering the market growth in recent years. Some preservatives are banned in some countries due to their potential hazards. This is a major challenge for manufacturers to develop preservatives by following government rules and regulations.
  • The competition among the key players has seen an increase in recent years. The competition can be significant barrier for the new entrance. As the many players vying for the market share, the market is anticipated to become more competitive in the coming years.

Comparative View of Adjacent Markets

Besides the animal feed preservative market, an in-depth analysis has been done on two other related markets. The markets by name are the food preservatives market and fermented ingredients market.

Demand for meat, milk, and egg products derived from animals is expected to drive the growth of the animal feed additive market in the coming years.

Expansion of aquaculture and awareness of the animal health is contributing to the growth of the fermented ingredients market.

Animal Feed Preservative Market:

Attributes Animal Feed Preservative Market
Value-based CAGR (2024 to 2034) 5.80%
Market Trends Demand for animal-based products such as meat, dairy products, and others is anticipated to lead to market growth during the forecast period.
Growth Opportunities Developing innovative feed additives and supplements will be a significant investment opportunity for feed producers.

Animal Feed Additive Market:

Attributes Animal Feed Additive Market
Value-based CAGR (2024 to 2034) 6.9%
Market Trends Demand for meat, milk, and egg products derived from animals is rising along with the world's population, driving the need for effective and optimal animal nutrition.
Growth Opportunities Growth in feedstock production and industrial farming techniques contribute to the rising animal feed additive demand in the market.

Animal Feed Market:

Attributes Animal Feed Market
Value-based CAGR (2024 to 2034) 7.3%
Market Trends Increased demand for animal protein. As more people enter the middle class and adopt diets rich in meat & dairy products, demand for livestock and poultry production has surged.
Growth Opportunities Expansion of aquaculture has played a significant role in the rising demand for animal feed.

Get the data you need at a Fraction of the cost

Personalize your report by choosing insights you need
and save 40%!

Category-wise Insights

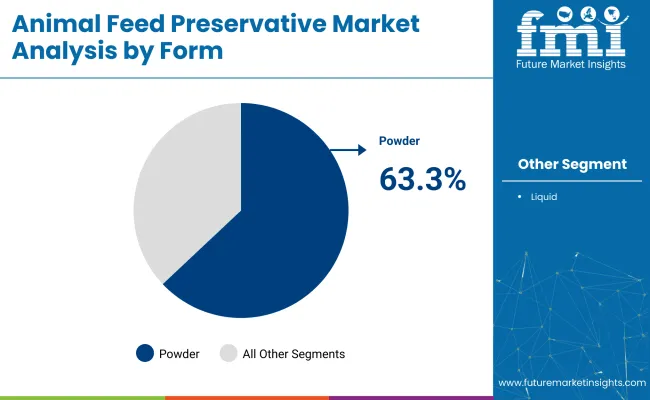
The Powder Segment is Dominating the Market by Form

Attributes Details
Top Powder Form
Market share in 2024 33%

Powder has a longer shelf life than liquid, which drives demand. Powder preservatives are typically easy to handle and store, so consumers consider them an excellent choice.

Powder's properties, such as ease of mixing and greater flexibility, make it a popular choice among people who make a variety of products daily. Furthermore, the lower cost of powder preservatives compared to liquids is gaining popularity in the current period.

Country-wise Insights

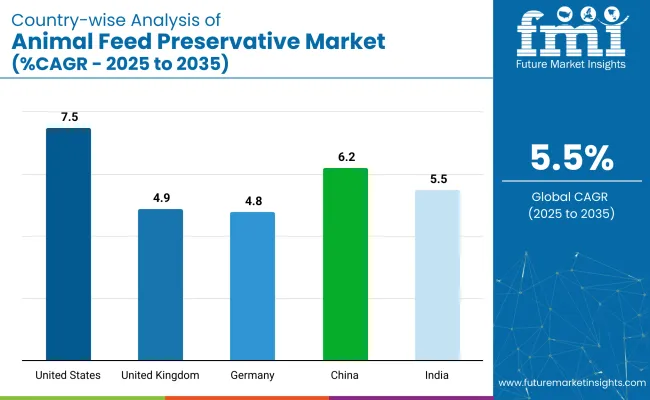
Countries CAGR through 2034
United States 14.9%
China 12.3%
Germany 8.7%
Japan 4.9%
Australia 2.7%

United States

Surge in demand for the animal-based products in the United States has been observed in recent years. Products such as dairy, meat, and eggs is gaining popularity in the region. For the continuous supply of these products, animal parents are giving healthy meals to their animals with the added preservative for the healthy growth of the animals in the country.

The people are more aware of animal health and welfare in the United States. The trend of pet ownership is on the rise in the country. As pet owners are seeking better meals for their pets nowadays. Feed preservatives are increasing the quality of the animal feed in the current period.

Concerns regarding sustainability is observed in the United States. Consumers are demanding more sustainable food processing. Thus animal feed preservative-producing companies are focusing on improvising and producing their product more sustainable way in the United States.

China

In recent years, China gained the maximum share of the animal feed preservative market. Demand for high-quality animal-based products in the country is raised. Moreover, stricter regulations from the government for animal welfare and animal health have contributed to the growth of the market.

As Chinese individuals following government regulations and focus on their animal feed for the healthy growth of their animals and increasingly use feed preservatives in their meals.

China is considered a prominent country for research and development activities. Animal feed preservative companies are desperately focusing on the research to improve their preservatives and gain maximum market share during the forecast period. Also, technological advancement is helping companies to meet their consumer demands in the region.

Germany

The trend toward urban farming has been observed in the United Kingdom. As people growing their food in their garden spaces and others such as small-scale animal farming, thus the demand for animal feed preservatives is seen as raised these days.

Seafood products have gained a major market share in recent years in the United Kingdom. Aqua farmers are using preservatives for the healthy growth of fish and shellfish farming has been seen over the years.

Japan

Japanese individuals are actively looking for solutions to lessen the environmental impact of feed production and animal agriculture over the years. Feed preservative companies are expanding their product offerings while maintaining sustainability trends in Japan. Furthermore, seafood vendors are driving the market demand for the animal feed preservative market in Japan.

Australia

Surge in demand for natural animal feed preservatives in Australia. Animal farmers are increasingly using natural preservatives to avoid the harmful effects of chemically made preservatives. These usages of the preservatives are driving demand for the market in Australia. Moreover, the export industry presents lucrative growth opportunities for the market.

Competitive Landscape

The level of competition in the market is heavily influenced by several manufacturers and distributors, as well as their geographical locations. Participants and stakeholders are focusing on increasing their manufacturing capabilities in the market.

Several companies are looking to improvising customer experience by implementing new marketing strategies in the current period. Several companies are looking to improvising consumer experience by implementing new marketing strategies in the current period.

Key players are actively offering a wide range of organic and natural feed preservatives which gives them attraction and popularity in the market. Leading players are conducting research and development to provide consumers with effective products, which is expected to drive market growth.

Recent Developments

  • In 2020, BASF, a leading chemical company, and SINOPEC, a Chinese petrochemical company, formed a joint venture to enhance the production capacity of Neopentylglycol (NPG) at the modern Verbund plant located in Nanjing, China. This plant was initially built in 2015 with a production capacity of 40,000 metric tons per year. Recently, in August 2020, the plant capacity was doubled to 80,000 metric tons per year through an expansion project.
  • In 2023, Evonik has recently introduced the latest version of its Biolys® product line, which boasts a significantly higher concentration of L-lysine for animal feed compared to its earlier iterations. This new generation Biolys® aims to provide superior nutritional value to animals, leading to better growth, health, and productivity. With this launch, Evonik seeks to reinforce its commitment to delivering innovative and sustainable solutions that cater to the evolving needs of the animal nutrition industry.
  • In 2023, Biochem has recently launched the RumiPro product line, which is specifically designed to cater to the unique nutritional needs of ruminants. This portfolio includes three top-quality products that are formulated to enhance the overall health and well-being of ruminants. With the help of RumiPro products, farmers can ensure optimal nutrition for their ruminants, which can result in better growth, improved milk yield, and overall improved animal health.

Key Players in the Animal Feed Preservative Market

  • Archer Daniels Midland Company
  • Adisseo
  • Ajinomoto Animal Nutrition North America
  • Alltech Inc
  • BASF SE
  • Cargill Inc.
  • Chr.Harsen Holding A/S
  • Danish Agro
  • DSM
  • Evonik Industries AG
  • International Flavors & Fragrances Inc.
  • Kemin Industries Inc.
  • Novus International Inc.
  • Nutreco (Owned by SHV)
  • Pestell Nutrition (Barentz)
  • Solvay Group

Key Coverage in the Animal Feed Preservative Market

  • Animal Feed Additives Market Report
  • Animal natural Preservative Market Analysis
  • Food Preservative Industry Trends Assessment
  • Animal Synthetic Food Preservative Market Overview
  • Natural and Organic Preservative Pricing Outlook

Key Segments

By Product Type:

  • Synthetic
    • Organohalogen compounds
    • Aldehydes
    • Glycol ethers
    • Parabens
  • Natural
    • Nisin
    • Natamycin
    • Benzyl Alcohol
    • Salicylic Acid
    • Sorbic Acid
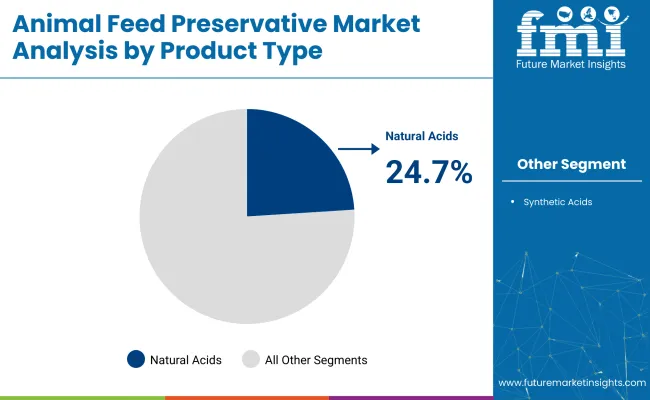
    • Natural Acids
    • Botanical Extracts
    • Others

By End-Use Application:

  • Pelleted Feeds
  • Mash Feeds
  • Silage
  • Hay
  • Grain Storage
  • Liquid Feeds
  • Others

By Form:

  • Powder
  • Liquid

By Region:

  • North America
  • Latin America
  • Europe
  • Asia Pacific
  • Middle East and Africa (MEA)

Frequently Asked Questions

How will the Animal Feed Preservative Market Progress in the United States?

The CAGR of the animal feed preservative market in the United States is estimated to be 14.9% through 2034.

What is the Scope of the Market?

The market is expected to grow at a CAGR of 5.5% over the period from 2024 to 2034.

How Big is the Market in 2024?

The animal feed preservative market size is expected to be worth US$ 298.6 million in 2024.

How will the Market Progress in China?

The CAGR of the market in China is estimated to be 12.3% from 2024 to 2034.

How Big will the Market Be by 2034?

The market is estimated to get as big as US$ 512.2 million by 2034.

What are the Key Segments of the Market?

The market can be divided into the following segments: product type, form, and end-use application.

Table of Content

1. Executive Summary

    1.1. Global Market Outlook

    1.2. Demand-side Trends

    1.3. Supply-side Trends

    1.4. Technology Roadmap Market Analysis

    1.5. Market Analysis and Recommendations

2. Market Overview

    2.1. Market Coverage / Taxonomy

    2.2. Market Definition / Scope / Limitations

3. Market Background

    3.1. Market Dynamics

        3.1.1. Drivers

        3.1.2. Restraints

        3.1.3. Opportunity

        3.1.4. Trends

    3.2. Scenario Forecast

        3.2.1. Demand in Optimistic Scenario

        3.2.2. Demand in Likely Scenario

        3.2.3. Demand in Conservative Scenario

    3.3. Opportunity Map Market Analysis

    3.4. Product Life Cycle Market Analysis

    3.5. Supply Chain Market Analysis

        3.5.1. Supply Side Participants and their Roles

            3.5.1.1. Producers

            3.5.1.2. Mid-Level Participants

        3.5.2. Value Added and Value Created at Node in the Supply Chain

        3.5.3. List of Raw Material Suppliers

        3.5.4. List of Existing and Potential Buyer’s

    3.6. Investment Feasibility Matrix

    3.7. Value Chain Market Analysis

        3.7.1. Profit Margin Market Analysis

    3.8. PESTLE and Porter’s Market Analysis

    3.9. Regulatory Landscape

        3.9.1. By Key Regions

        3.9.2. By Key Countries

    3.10. Regional Parent Market Outlook

    3.11. Production and Consumption Statistics

    3.12. Import and Export Statistics

4. Global Market Analysis 2019 to 2023 and Forecast, 2024 to 2034

    4.1. Historical Market Size Value (US$ Million) & Volume (Tons) Market Analysis, 2019 to 2023

    4.2. Current and Future Market Size Value (US$ Million) & Volume (Tons) Projections, 2024 to 2034

        4.2.1. Y-o-Y Growth Trend Market Analysis

        4.2.2. Absolute $ Opportunity Market Analysis

5. Global Market Analysis 2019 to 2023 and Forecast 2024 to 2034, By Preservatives Type

    5.1. Introduction / Key Findings

    5.2. Historical Market Size Value (US$ Million) & Volume (Tons) Market Analysis By Preservatives Type, 2019 to 2023

    5.3. Current and Future Market Size Value (US$ Million) & Volume (Tons) Market Analysis and Forecast By Preservatives Type, 2024 to 2034

        5.3.1. Natural Preservatives

        5.3.2. Synthetic Preservatives

    5.4. Y-o-Y Growth Trend Market Analysis By Preservatives Type, 2019 to 2023

    5.5. Absolute $ Opportunity Market Analysis By Preservatives Type, 2024 to 2034

6. Global Market Analysis 2019 to 2023 and Forecast 2024 to 2034, By Animal Type

    6.1. Introduction / Key Findings

    6.2. Historical Market Size Value (US$ Million) & Volume (Tons) Market Analysis By Animal Type, 2019 to 2023

    6.3. Current and Future Market Size Value (US$ Million) & Volume (Tons) Market Analysis and Forecast By Animal Type, 2024 to 2034

        6.3.1. Poultry

            6.3.1.1. Broiler

            6.3.1.2. Layer

            6.3.1.3. Turkey

        6.3.2. Swine

            6.3.2.1. Starter

            6.3.2.2. Grower

            6.3.2.3. Sow

        6.3.3. Cattle

            6.3.3.1. Dairy

            6.3.3.2. Calf

        6.3.4. Aquaculture

            6.3.4.1. Salmon

            6.3.4.2. Trout

            6.3.4.3. Shrimp

            6.3.4.4. Carp

        6.3.5. Pets

            6.3.5.1. Dog

            6.3.5.2. Cat

            6.3.5.3. Equine

            6.3.5.4. Others

    6.4. Y-o-Y Growth Trend Market Analysis By Animal Type, 2019 to 2023

    6.5. Absolute $ Opportunity Market Analysis By Animal Type, 2024 to 2034

7. Global Market Analysis 2019 to 2023 and Forecast 2024 to 2034, By Form

    7.1. Introduction / Key Findings

    7.2. Historical Market Size Value (US$ Million) & Volume (Tons) Market Analysis By Form, 2019 to 2023

    7.3. Current and Future Market Size Value (US$ Million) & Volume (Tons) Market Analysis and Forecast By Form, 2024 to 2034

        7.3.1. Liquid

        7.3.2. Dry

    7.4. Y-o-Y Growth Trend Market Analysis By Form, 2019 to 2023

    7.5. Absolute $ Opportunity Market Analysis By Form, 2024 to 2034

8. Global Market Analysis 2019 to 2023 and Forecast 2024 to 2034, By Function

    8.1. Introduction / Key Findings

    8.2. Historical Market Size Value (US$ Million) & Volume (Tons) Market Analysis By Function, 2019 to 2023

    8.3. Current and Future Market Size Value (US$ Million) & Volume (Tons) Market Analysis and Forecast By Function, 2024 to 2034

        8.3.1. Antioxidants

        8.3.2. Antimicrobials

        8.3.3. Mycotoxin Binders

    8.4. Y-o-Y Growth Trend Market Analysis By Function, 2019 to 2023

    8.5. Absolute $ Opportunity Market Analysis By Function, 2024 to 2034

9. Global Market Analysis 2019 to 2023 and Forecast 2024 to 2034, By Region

    9.1. Introduction

    9.2. Historical Market Size Value (US$ Million) & Volume (Tons) Market Analysis By Region, 2019 to 2023

    9.3. Current Market Size Value (US$ Million) & Volume (Tons) Market Analysis and Forecast By Region, 2024 to 2034

        9.3.1. North America

        9.3.2. Latin America

        9.3.3. Western Europe

        9.3.4. Eastern Europe

        9.3.5. South Asia and Pacific

        9.3.6. East Asia

        9.3.7. Middle East and Africa

    9.4. Market Attractiveness Market Analysis By Region

10. North America Market Analysis 2019 to 2023 and Forecast 2024 to 2034, By Country

    10.1. Historical Market Size Value (US$ Million) & Volume (Tons) Trend Market Analysis By Market Taxonomy, 2019 to 2023

    10.2. Market Size Value (US$ Million) & Volume (Tons) Forecast By Market Taxonomy, 2024 to 2034

        10.2.1. By Country

            10.2.1.1. USA

            10.2.1.2. Canada

        10.2.2. By Preservatives Type

        10.2.3. By Animal Type

        10.2.4. By Form

        10.2.5. By Function

    10.3. Market Attractiveness Market Analysis

        10.3.1. By Country

        10.3.2. By Preservatives Type

        10.3.3. By Animal Type

        10.3.4. By Form

        10.3.5. By Function

    10.4. Key Takeaways

11. Latin America Market Analysis 2019 to 2023 and Forecast 2024 to 2034, By Country

    11.1. Historical Market Size Value (US$ Million) & Volume (Tons) Trend Market Analysis By Market Taxonomy, 2019 to 2023

    11.2. Market Size Value (US$ Million) & Volume (Tons) Forecast By Market Taxonomy, 2024 to 2034

        11.2.1. By Country

            11.2.1.1. Brazil

            11.2.1.2. Mexico

            11.2.1.3. Rest of Latin America

        11.2.2. By Preservatives Type

        11.2.3. By Animal Type

        11.2.4. By Form

        11.2.5. By Function

    11.3. Market Attractiveness Market Analysis

        11.3.1. By Country

        11.3.2. By Preservatives Type

        11.3.3. By Animal Type

        11.3.4. By Form

        11.3.5. By Function

    11.4. Key Takeaways

12. Western Europe Market Analysis 2019 to 2023 and Forecast 2024 to 2034, By Country

    12.1. Historical Market Size Value (US$ Million) & Volume (Tons) Trend Market Analysis By Market Taxonomy, 2019 to 2023

    12.2. Market Size Value (US$ Million) & Volume (Tons) Forecast By Market Taxonomy, 2024 to 2034

        12.2.1. By Country

            12.2.1.1. Germany

            12.2.1.2. UK

            12.2.1.3. France

            12.2.1.4. Spain

            12.2.1.5. Italy

            12.2.1.6. Rest of Western Europe

        12.2.2. By Preservatives Type

        12.2.3. By Animal Type

        12.2.4. By Form

        12.2.5. By Function

    12.3. Market Attractiveness Market Analysis

        12.3.1. By Country

        12.3.2. By Preservatives Type

        12.3.3. By Animal Type

        12.3.4. By Form

        12.3.5. By Function

    12.4. Key Takeaways

13. Eastern Europe Market Analysis 2019 to 2023 and Forecast 2024 to 2034, By Country

    13.1. Historical Market Size Value (US$ Million) & Volume (Tons) Trend Market Analysis By Market Taxonomy, 2019 to 2023

    13.2. Market Size Value (US$ Million) & Volume (Tons) Forecast By Market Taxonomy, 2024 to 2034

        13.2.1. By Country

            13.2.1.1. Poland

            13.2.1.2. Russia

            13.2.1.3. Czech Republic

            13.2.1.4. Romania

            13.2.1.5. Rest of Eastern Europe

        13.2.2. By Preservatives Type

        13.2.3. By Animal Type

        13.2.4. By Form

        13.2.5. By Function

    13.3. Market Attractiveness Market Analysis

        13.3.1. By Country

        13.3.2. By Preservatives Type

        13.3.3. By Animal Type

        13.3.4. By Form

        13.3.5. By Function

    13.4. Key Takeaways

14. South Asia and Pacific Market Analysis 2019 to 2023 and Forecast 2024 to 2034, By Country

    14.1. Historical Market Size Value (US$ Million) & Volume (Tons) Trend Market Analysis By Market Taxonomy, 2019 to 2023

    14.2. Market Size Value (US$ Million) & Volume (Tons) Forecast By Market Taxonomy, 2024 to 2034

        14.2.1. By Country

            14.2.1.1. India

            14.2.1.2. Bangladesh

            14.2.1.3. Australia

            14.2.1.4. New Zealand

            14.2.1.5. Rest of South Asia and Pacific

        14.2.2. By Preservatives Type

        14.2.3. By Animal Type

        14.2.4. By Form

        14.2.5. By Function

    14.3. Market Attractiveness Market Analysis

        14.3.1. By Country

        14.3.2. By Preservatives Type

        14.3.3. By Animal Type

        14.3.4. By Form

        14.3.5. By Function

    14.4. Key Takeaways

15. East Asia Market Analysis 2019 to 2023 and Forecast 2024 to 2034, By Country

    15.1. Historical Market Size Value (US$ Million) & Volume (Tons) Trend Market Analysis By Market Taxonomy, 2019 to 2023

    15.2. Market Size Value (US$ Million) & Volume (Tons) Forecast By Market Taxonomy, 2024 to 2034

        15.2.1. By Country

            15.2.1.1. China

            15.2.1.2. Japan

            15.2.1.3. South Korea

        15.2.2. By Preservatives Type

        15.2.3. By Animal Type

        15.2.4. By Form

        15.2.5. By Function

    15.3. Market Attractiveness Market Analysis

        15.3.1. By Country

        15.3.2. By Preservatives Type

        15.3.3. By Animal Type

        15.3.4. By Form

        15.3.5. By Function

    15.4. Key Takeaways

16. Middle East and Africa Market Analysis 2019 to 2023 and Forecast 2024 to 2034, By Country

    16.1. Historical Market Size Value (US$ Million) & Volume (Tons) Trend Market Analysis By Market Taxonomy, 2019 to 2023

    16.2. Market Size Value (US$ Million) & Volume (Tons) Forecast By Market Taxonomy, 2024 to 2034

        16.2.1. By Country

            16.2.1.1. GCC Countries

            16.2.1.2. South Africa

            16.2.1.3. Israel

            16.2.1.4. Rest of MEA

        16.2.2. By Preservatives Type

        16.2.3. By Animal Type

        16.2.4. By Form

        16.2.5. By Function

    16.3. Market Attractiveness Market Analysis

        16.3.1. By Country

        16.3.2. By Preservatives Type

        16.3.3. By Animal Type

        16.3.4. By Form

        16.3.5. By Function

    16.4. Key Takeaways

17. Key Countries Market Analysis

    17.1. USA

        17.1.1. Pricing Market Analysis

        17.1.2. Market Share Market Analysis, 2023

            17.1.2.1. By Preservatives Type

            17.1.2.2. By Animal Type

            17.1.2.3. By Form

            17.1.2.4. By Function

    17.2. Canada

        17.2.1. Pricing Market Analysis

        17.2.2. Market Share Market Analysis, 2023

            17.2.2.1. By Preservatives Type

            17.2.2.2. By Animal Type

            17.2.2.3. By Form

            17.2.2.4. By Function

    17.3. Brazil

        17.3.1. Pricing Market Analysis

        17.3.2. Market Share Market Analysis, 2023

            17.3.2.1. By Preservatives Type

            17.3.2.2. By Animal Type

            17.3.2.3. By Form

            17.3.2.4. By Function

    17.4. Mexico

        17.4.1. Pricing Market Analysis

        17.4.2. Market Share Market Analysis, 2023

            17.4.2.1. By Preservatives Type

            17.4.2.2. By Animal Type

            17.4.2.3. By Form

            17.4.2.4. By Function

    17.5. Germany

        17.5.1. Pricing Market Analysis

        17.5.2. Market Share Market Analysis, 2023

            17.5.2.1. By Preservatives Type

            17.5.2.2. By Animal Type

            17.5.2.3. By Form

            17.5.2.4. By Function

    17.6. UK

        17.6.1. Pricing Market Analysis

        17.6.2. Market Share Market Analysis, 2023

            17.6.2.1. By Preservatives Type

            17.6.2.2. By Animal Type

            17.6.2.3. By Form

            17.6.2.4. By Function

    17.7. France

        17.7.1. Pricing Market Analysis

        17.7.2. Market Share Market Analysis, 2023

            17.7.2.1. By Preservatives Type

            17.7.2.2. By Animal Type

            17.7.2.3. By Form

            17.7.2.4. By Function

    17.8. Spain

        17.8.1. Pricing Market Analysis

        17.8.2. Market Share Market Analysis, 2023

            17.8.2.1. By Preservatives Type

            17.8.2.2. By Animal Type

            17.8.2.3. By Form

            17.8.2.4. By Function

    17.9. Italy

        17.9.1. Pricing Market Analysis

        17.9.2. Market Share Market Analysis, 2023

            17.9.2.1. By Preservatives Type

            17.9.2.2. By Animal Type

            17.9.2.3. By Form

            17.9.2.4. By Function

    17.10. Poland

        17.10.1. Pricing Market Analysis

        17.10.2. Market Share Market Analysis, 2023

            17.10.2.1. By Preservatives Type

            17.10.2.2. By Animal Type

            17.10.2.3. By Form

            17.10.2.4. By Function

    17.11. Russia

        17.11.1. Pricing Market Analysis

        17.11.2. Market Share Market Analysis, 2023

            17.11.2.1. By Preservatives Type

            17.11.2.2. By Animal Type

            17.11.2.3. By Form

            17.11.2.4. By Function

    17.12. Czech Republic

        17.12.1. Pricing Market Analysis

        17.12.2. Market Share Market Analysis, 2023

            17.12.2.1. By Preservatives Type

            17.12.2.2. By Animal Type

            17.12.2.3. By Form

            17.12.2.4. By Function

    17.13. Romania

        17.13.1. Pricing Market Analysis

        17.13.2. Market Share Market Analysis, 2023

            17.13.2.1. By Preservatives Type

            17.13.2.2. By Animal Type

            17.13.2.3. By Form

            17.13.2.4. By Function

    17.14. India

        17.14.1. Pricing Market Analysis

        17.14.2. Market Share Market Analysis, 2023

            17.14.2.1. By Preservatives Type

            17.14.2.2. By Animal Type

            17.14.2.3. By Form

            17.14.2.4. By Function

    17.15. Bangladesh

        17.15.1. Pricing Market Analysis

        17.15.2. Market Share Market Analysis, 2023

            17.15.2.1. By Preservatives Type

            17.15.2.2. By Animal Type

            17.15.2.3. By Form

            17.15.2.4. By Function

    17.16. Australia

        17.16.1. Pricing Market Analysis

        17.16.2. Market Share Market Analysis, 2023

            17.16.2.1. By Preservatives Type

            17.16.2.2. By Animal Type

            17.16.2.3. By Form

            17.16.2.4. By Function

    17.17. New Zealand

        17.17.1. Pricing Market Analysis

        17.17.2. Market Share Market Analysis, 2023

            17.17.2.1. By Preservatives Type

            17.17.2.2. By Animal Type

            17.17.2.3. By Form

            17.17.2.4. By Function

    17.18. China

        17.18.1. Pricing Market Analysis

        17.18.2. Market Share Market Analysis, 2023

            17.18.2.1. By Preservatives Type

            17.18.2.2. By Animal Type

            17.18.2.3. By Form

            17.18.2.4. By Function

    17.19. Japan

        17.19.1. Pricing Market Analysis

        17.19.2. Market Share Market Analysis, 2023

            17.19.2.1. By Preservatives Type

            17.19.2.2. By Animal Type

            17.19.2.3. By Form

            17.19.2.4. By Function

    17.20. South Korea

        17.20.1. Pricing Market Analysis

        17.20.2. Market Share Market Analysis, 2023

            17.20.2.1. By Preservatives Type

            17.20.2.2. By Animal Type

            17.20.2.3. By Form

            17.20.2.4. By Function

    17.21. GCC Countries

        17.21.1. Pricing Market Analysis

        17.21.2. Market Share Market Analysis, 2023

            17.21.2.1. By Preservatives Type

            17.21.2.2. By Animal Type

            17.21.2.3. By Form

            17.21.2.4. By Function

    17.22. South Africa

        17.22.1. Pricing Market Analysis

        17.22.2. Market Share Market Analysis, 2023

            17.22.2.1. By Preservatives Type

            17.22.2.2. By Animal Type

            17.22.2.3. By Form

            17.22.2.4. By Function

    17.23. Israel

        17.23.1. Pricing Market Analysis

        17.23.2. Market Share Market Analysis, 2023

            17.23.2.1. By Preservatives Type

            17.23.2.2. By Animal Type

            17.23.2.3. By Form

            17.23.2.4. By Function

18. Market Structure Market Analysis

    18.1. Competition Dashboard

    18.2. Competition Benchmarking

    18.3. Market Share Market Analysis of Top Players

        18.3.1. By Regional

        18.3.2. By Preservatives Type

        18.3.3. By Animal Type

        18.3.4. By Form

        18.3.5. By Function

19. Competition Market Analysis

    19.1. Competition Deep Dive

        19.1.1. BASF SE

            19.1.1.1. Overview

            19.1.1.2. Product Portfolio

            19.1.1.3. Profitability by Market Segments

            19.1.1.4. Sales Footprint

            19.1.1.5. Strategy Overview

                19.1.1.5.1. Marketing Strategy

                19.1.1.5.2. Product Strategy

                19.1.1.5.3. Channel Strategy

        19.1.2. Novus International, Inc.

            19.1.2.1. Overview

            19.1.2.2. Product Portfolio

            19.1.2.3. Profitability by Market Segments

            19.1.2.4. Sales Footprint

            19.1.2.5. Strategy Overview

                19.1.2.5.1. Marketing Strategy

                19.1.2.5.2. Product Strategy

                19.1.2.5.3. Channel Strategy

        19.1.3. Kemin Industries, Inc.

            19.1.3.1. Overview

            19.1.3.2. Product Portfolio

            19.1.3.3. Profitability by Market Segments

            19.1.3.4. Sales Footprint

            19.1.3.5. Strategy Overview

                19.1.3.5.1. Marketing Strategy

                19.1.3.5.2. Product Strategy

                19.1.3.5.3. Channel Strategy

        19.1.4. Nutreco N.V.

            19.1.4.1. Overview

            19.1.4.2. Product Portfolio

            19.1.4.3. Profitability by Market Segments

            19.1.4.4. Sales Footprint

            19.1.4.5. Strategy Overview

                19.1.4.5.1. Marketing Strategy

                19.1.4.5.2. Product Strategy

                19.1.4.5.3. Channel Strategy

        19.1.5. Cargill, Incorporated

            19.1.5.1. Overview

            19.1.5.2. Product Portfolio

            19.1.5.3. Profitability by Market Segments

            19.1.5.4. Sales Footprint

            19.1.5.5. Strategy Overview

                19.1.5.5.1. Marketing Strategy

                19.1.5.5.2. Product Strategy

                19.1.5.5.3. Channel Strategy

        19.1.6. DuPont de Nemours, Inc.

            19.1.6.1. Overview

            19.1.6.2. Product Portfolio

            19.1.6.3. Profitability by Market Segments

            19.1.6.4. Sales Footprint

            19.1.6.5. Strategy Overview

                19.1.6.5.1. Marketing Strategy

                19.1.6.5.2. Product Strategy

                19.1.6.5.3. Channel Strategy

        19.1.7. Alltech, Inc.

            19.1.7.1. Overview

            19.1.7.2. Product Portfolio

            19.1.7.3. Profitability by Market Segments

            19.1.7.4. Sales Footprint

            19.1.7.5. Strategy Overview

                19.1.7.5.1. Marketing Strategy

                19.1.7.5.2. Product Strategy

                19.1.7.5.3. Channel Strategy

        19.1.8. Perstorp Holding AB

            19.1.8.1. Overview

            19.1.8.2. Product Portfolio

            19.1.8.3. Profitability by Market Segments

            19.1.8.4. Sales Footprint

            19.1.8.5. Strategy Overview

                19.1.8.5.1. Marketing Strategy

                19.1.8.5.2. Product Strategy

                19.1.8.5.3. Channel Strategy

        19.1.9. Impextraco NV

            19.1.9.1. Overview

            19.1.9.2. Product Portfolio

            19.1.9.3. Profitability by Market Segments

            19.1.9.4. Sales Footprint

            19.1.9.5. Strategy Overview

                19.1.9.5.1. Marketing Strategy

                19.1.9.5.2. Product Strategy

                19.1.9.5.3. Channel Strategy

        19.1.10. Eastman Chemical Company

            19.1.10.1. Overview

            19.1.10.2. Product Portfolio

            19.1.10.3. Profitability by Market Segments

            19.1.10.4. Sales Footprint

            19.1.10.5. Strategy Overview

                19.1.10.5.1. Marketing Strategy

                19.1.10.5.2. Product Strategy

                19.1.10.5.3. Channel Strategy

20. Assumptions & Acronyms Used

21. Research Methodology

List of Tables

Table 1: Global Market Value (US$ Million) Forecast by Region, 2019 to 2034

Table 2: Global Market Volume (Tons) Forecast by Region, 2019 to 2034

Table 3: Global Market Value (US$ Million) Forecast by Preservatives Type, 2019 to 2034

Table 4: Global Market Volume (Tons) Forecast by Preservatives Type, 2019 to 2034

Table 5: Global Market Value (US$ Million) Forecast by Animal Type, 2019 to 2034

Table 6: Global Market Volume (Tons) Forecast by Animal Type, 2019 to 2034

Table 7: Global Market Value (US$ Million) Forecast by Form, 2019 to 2034

Table 8: Global Market Volume (Tons) Forecast by Form, 2019 to 2034

Table 9: Global Market Value (US$ Million) Forecast by Function, 2019 to 2034

Table 10: Global Market Volume (Tons) Forecast by Function, 2019 to 2034

Table 11: North America Market Value (US$ Million) Forecast by Country, 2019 to 2034

Table 12: North America Market Volume (Tons) Forecast by Country, 2019 to 2034

Table 13: North America Market Value (US$ Million) Forecast by Preservatives Type, 2019 to 2034

Table 14: North America Market Volume (Tons) Forecast by Preservatives Type, 2019 to 2034

Table 15: North America Market Value (US$ Million) Forecast by Animal Type, 2019 to 2034

Table 16: North America Market Volume (Tons) Forecast by Animal Type, 2019 to 2034

Table 17: North America Market Value (US$ Million) Forecast by Form, 2019 to 2034

Table 18: North America Market Volume (Tons) Forecast by Form, 2019 to 2034

Table 19: North America Market Value (US$ Million) Forecast by Function, 2019 to 2034

Table 20: North America Market Volume (Tons) Forecast by Function, 2019 to 2034

Table 21: Latin America Market Value (US$ Million) Forecast by Country, 2019 to 2034

Table 22: Latin America Market Volume (Tons) Forecast by Country, 2019 to 2034

Table 23: Latin America Market Value (US$ Million) Forecast by Preservatives Type, 2019 to 2034

Table 24: Latin America Market Volume (Tons) Forecast by Preservatives Type, 2019 to 2034

Table 25: Latin America Market Value (US$ Million) Forecast by Animal Type, 2019 to 2034

Table 26: Latin America Market Volume (Tons) Forecast by Animal Type, 2019 to 2034

Table 27: Latin America Market Value (US$ Million) Forecast by Form, 2019 to 2034

Table 28: Latin America Market Volume (Tons) Forecast by Form, 2019 to 2034

Table 29: Latin America Market Value (US$ Million) Forecast by Function, 2019 to 2034

Table 30: Latin America Market Volume (Tons) Forecast by Function, 2019 to 2034

Table 31: Western Europe Market Value (US$ Million) Forecast by Country, 2019 to 2034

Table 32: Western Europe Market Volume (Tons) Forecast by Country, 2019 to 2034

Table 33: Western Europe Market Value (US$ Million) Forecast by Preservatives Type, 2019 to 2034

Table 34: Western Europe Market Volume (Tons) Forecast by Preservatives Type, 2019 to 2034

Table 35: Western Europe Market Value (US$ Million) Forecast by Animal Type, 2019 to 2034

Table 36: Western Europe Market Volume (Tons) Forecast by Animal Type, 2019 to 2034

Table 37: Western Europe Market Value (US$ Million) Forecast by Form, 2019 to 2034

Table 38: Western Europe Market Volume (Tons) Forecast by Form, 2019 to 2034

Table 39: Western Europe Market Value (US$ Million) Forecast by Function, 2019 to 2034

Table 40: Western Europe Market Volume (Tons) Forecast by Function, 2019 to 2034

Table 41: Eastern Europe Market Value (US$ Million) Forecast by Country, 2019 to 2034

Table 42: Eastern Europe Market Volume (Tons) Forecast by Country, 2019 to 2034

Table 43: Eastern Europe Market Value (US$ Million) Forecast by Preservatives Type, 2019 to 2034

Table 44: Eastern Europe Market Volume (Tons) Forecast by Preservatives Type, 2019 to 2034

Table 45: Eastern Europe Market Value (US$ Million) Forecast by Animal Type, 2019 to 2034

Table 46: Eastern Europe Market Volume (Tons) Forecast by Animal Type, 2019 to 2034

Table 47: Eastern Europe Market Value (US$ Million) Forecast by Form, 2019 to 2034

Table 48: Eastern Europe Market Volume (Tons) Forecast by Form, 2019 to 2034

Table 49: Eastern Europe Market Value (US$ Million) Forecast by Function, 2019 to 2034

Table 50: Eastern Europe Market Volume (Tons) Forecast by Function, 2019 to 2034

Table 51: South Asia and Pacific Market Value (US$ Million) Forecast by Country, 2019 to 2034

Table 52: South Asia and Pacific Market Volume (Tons) Forecast by Country, 2019 to 2034

Table 53: South Asia and Pacific Market Value (US$ Million) Forecast by Preservatives Type, 2019 to 2034

Table 54: South Asia and Pacific Market Volume (Tons) Forecast by Preservatives Type, 2019 to 2034

Table 55: South Asia and Pacific Market Value (US$ Million) Forecast by Animal Type, 2019 to 2034

Table 56: South Asia and Pacific Market Volume (Tons) Forecast by Animal Type, 2019 to 2034

Table 57: South Asia and Pacific Market Value (US$ Million) Forecast by Form, 2019 to 2034

Table 58: South Asia and Pacific Market Volume (Tons) Forecast by Form, 2019 to 2034

Table 59: South Asia and Pacific Market Value (US$ Million) Forecast by Function, 2019 to 2034

Table 60: South Asia and Pacific Market Volume (Tons) Forecast by Function, 2019 to 2034

Table 61: East Asia Market Value (US$ Million) Forecast by Country, 2019 to 2034

Table 62: East Asia Market Volume (Tons) Forecast by Country, 2019 to 2034

Table 63: East Asia Market Value (US$ Million) Forecast by Preservatives Type, 2019 to 2034

Table 64: East Asia Market Volume (Tons) Forecast by Preservatives Type, 2019 to 2034

Table 65: East Asia Market Value (US$ Million) Forecast by Animal Type, 2019 to 2034

Table 66: East Asia Market Volume (Tons) Forecast by Animal Type, 2019 to 2034

Table 67: East Asia Market Value (US$ Million) Forecast by Form, 2019 to 2034

Table 68: East Asia Market Volume (Tons) Forecast by Form, 2019 to 2034

Table 69: East Asia Market Value (US$ Million) Forecast by Function, 2019 to 2034

Table 70: East Asia Market Volume (Tons) Forecast by Function, 2019 to 2034

Table 71: Middle East and Africa Market Value (US$ Million) Forecast by Country, 2019 to 2034

Table 72: Middle East and Africa Market Volume (Tons) Forecast by Country, 2019 to 2034

Table 73: Middle East and Africa Market Value (US$ Million) Forecast by Preservatives Type, 2019 to 2034

Table 74: Middle East and Africa Market Volume (Tons) Forecast by Preservatives Type, 2019 to 2034

Table 75: Middle East and Africa Market Value (US$ Million) Forecast by Animal Type, 2019 to 2034

Table 76: Middle East and Africa Market Volume (Tons) Forecast by Animal Type, 2019 to 2034

Table 77: Middle East and Africa Market Value (US$ Million) Forecast by Form, 2019 to 2034

Table 78: Middle East and Africa Market Volume (Tons) Forecast by Form, 2019 to 2034

Table 79: Middle East and Africa Market Value (US$ Million) Forecast by Function, 2019 to 2034

Table 80: Middle East and Africa Market Volume (Tons) Forecast by Function, 2019 to 2034

List of Charts

Figure 1: Global Market Value (US$ Million) by Preservatives Type, 2024 to 2034

Figure 2: Global Market Value (US$ Million) by Animal Type, 2024 to 2034

Figure 3: Global Market Value (US$ Million) by Form, 2024 to 2034

Figure 4: Global Market Value (US$ Million) by Function, 2024 to 2034

Figure 5: Global Market Value (US$ Million) by Region, 2024 to 2034

Figure 6: Global Market Value (US$ Million) Analysis by Region, 2019 to 2034

Figure 7: Global Market Volume (Tons) Analysis by Region, 2019 to 2034

Figure 8: Global Market Value Share (%) and BPS Analysis by Region, 2024 to 2034

Figure 9: Global Market Y-o-Y Growth (%) Projections by Region, 2024 to 2034

Figure 10: Global Market Value (US$ Million) Analysis by Preservatives Type, 2019 to 2034

Figure 11: Global Market Volume (Tons) Analysis by Preservatives Type, 2019 to 2034

Figure 12: Global Market Value Share (%) and BPS Analysis by Preservatives Type, 2024 to 2034

Figure 13: Global Market Y-o-Y Growth (%) Projections by Preservatives Type, 2024 to 2034

Figure 14: Global Market Value (US$ Million) Analysis by Animal Type, 2019 to 2034

Figure 15: Global Market Volume (Tons) Analysis by Animal Type, 2019 to 2034

Figure 16: Global Market Value Share (%) and BPS Analysis by Animal Type, 2024 to 2034

Figure 17: Global Market Y-o-Y Growth (%) Projections by Animal Type, 2024 to 2034

Figure 18: Global Market Value (US$ Million) Analysis by Form, 2019 to 2034

Figure 19: Global Market Volume (Tons) Analysis by Form, 2019 to 2034

Figure 20: Global Market Value Share (%) and BPS Analysis by Form, 2024 to 2034

Figure 21: Global Market Y-o-Y Growth (%) Projections by Form, 2024 to 2034

Figure 22: Global Market Value (US$ Million) Analysis by Function, 2019 to 2034

Figure 23: Global Market Volume (Tons) Analysis by Function, 2019 to 2034

Figure 24: Global Market Value Share (%) and BPS Analysis by Function, 2024 to 2034

Figure 25: Global Market Y-o-Y Growth (%) Projections by Function, 2024 to 2034

Figure 26: Global Market Attractiveness by Preservatives Type, 2024 to 2034

Figure 27: Global Market Attractiveness by Animal Type, 2024 to 2034

Figure 28: Global Market Attractiveness by Form, 2024 to 2034

Figure 29: Global Market Attractiveness by Function, 2024 to 2034

Figure 30: Global Market Attractiveness by Region, 2024 to 2034

Figure 31: North America Market Value (US$ Million) by Preservatives Type, 2024 to 2034

Figure 32: North America Market Value (US$ Million) by Animal Type, 2024 to 2034

Figure 33: North America Market Value (US$ Million) by Form, 2024 to 2034

Figure 34: North America Market Value (US$ Million) by Function, 2024 to 2034

Figure 35: North America Market Value (US$ Million) by Country, 2024 to 2034

Figure 36: North America Market Value (US$ Million) Analysis by Country, 2019 to 2034

Figure 37: North America Market Volume (Tons) Analysis by Country, 2019 to 2034

Figure 38: North America Market Value Share (%) and BPS Analysis by Country, 2024 to 2034

Figure 39: North America Market Y-o-Y Growth (%) Projections by Country, 2024 to 2034

Figure 40: North America Market Value (US$ Million) Analysis by Preservatives Type, 2019 to 2034

Figure 41: North America Market Volume (Tons) Analysis by Preservatives Type, 2019 to 2034

Figure 42: North America Market Value Share (%) and BPS Analysis by Preservatives Type, 2024 to 2034

Figure 43: North America Market Y-o-Y Growth (%) Projections by Preservatives Type, 2024 to 2034

Figure 44: North America Market Value (US$ Million) Analysis by Animal Type, 2019 to 2034

Figure 45: North America Market Volume (Tons) Analysis by Animal Type, 2019 to 2034

Figure 46: North America Market Value Share (%) and BPS Analysis by Animal Type, 2024 to 2034

Figure 47: North America Market Y-o-Y Growth (%) Projections by Animal Type, 2024 to 2034

Figure 48: North America Market Value (US$ Million) Analysis by Form, 2019 to 2034

Figure 49: North America Market Volume (Tons) Analysis by Form, 2019 to 2034

Figure 50: North America Market Value Share (%) and BPS Analysis by Form, 2024 to 2034

Figure 51: North America Market Y-o-Y Growth (%) Projections by Form, 2024 to 2034

Figure 52: North America Market Value (US$ Million) Analysis by Function, 2019 to 2034

Figure 53: North America Market Volume (Tons) Analysis by Function, 2019 to 2034

Figure 54: North America Market Value Share (%) and BPS Analysis by Function, 2024 to 2034

Figure 55: North America Market Y-o-Y Growth (%) Projections by Function, 2024 to 2034

Figure 56: North America Market Attractiveness by Preservatives Type, 2024 to 2034

Figure 57: North America Market Attractiveness by Animal Type, 2024 to 2034

Figure 58: North America Market Attractiveness by Form, 2024 to 2034

Figure 59: North America Market Attractiveness by Function, 2024 to 2034

Figure 60: North America Market Attractiveness by Country, 2024 to 2034

Figure 61: Latin America Market Value (US$ Million) by Preservatives Type, 2024 to 2034

Figure 62: Latin America Market Value (US$ Million) by Animal Type, 2024 to 2034

Figure 63: Latin America Market Value (US$ Million) by Form, 2024 to 2034

Figure 64: Latin America Market Value (US$ Million) by Function, 2024 to 2034

Figure 65: Latin America Market Value (US$ Million) by Country, 2024 to 2034

Figure 66: Latin America Market Value (US$ Million) Analysis by Country, 2019 to 2034

Figure 67: Latin America Market Volume (Tons) Analysis by Country, 2019 to 2034

Figure 68: Latin America Market Value Share (%) and BPS Analysis by Country, 2024 to 2034

Figure 69: Latin America Market Y-o-Y Growth (%) Projections by Country, 2024 to 2034

Figure 70: Latin America Market Value (US$ Million) Analysis by Preservatives Type, 2019 to 2034

Figure 71: Latin America Market Volume (Tons) Analysis by Preservatives Type, 2019 to 2034

Figure 72: Latin America Market Value Share (%) and BPS Analysis by Preservatives Type, 2024 to 2034

Figure 73: Latin America Market Y-o-Y Growth (%) Projections by Preservatives Type, 2024 to 2034

Figure 74: Latin America Market Value (US$ Million) Analysis by Animal Type, 2019 to 2034

Figure 75: Latin America Market Volume (Tons) Analysis by Animal Type, 2019 to 2034

Figure 76: Latin America Market Value Share (%) and BPS Analysis by Animal Type, 2024 to 2034

Figure 77: Latin America Market Y-o-Y Growth (%) Projections by Animal Type, 2024 to 2034

Figure 78: Latin America Market Value (US$ Million) Analysis by Form, 2019 to 2034

Figure 79: Latin America Market Volume (Tons) Analysis by Form, 2019 to 2034

Figure 80: Latin America Market Value Share (%) and BPS Analysis by Form, 2024 to 2034

Figure 81: Latin America Market Y-o-Y Growth (%) Projections by Form, 2024 to 2034

Figure 82: Latin America Market Value (US$ Million) Analysis by Function, 2019 to 2034

Figure 83: Latin America Market Volume (Tons) Analysis by Function, 2019 to 2034

Figure 84: Latin America Market Value Share (%) and BPS Analysis by Function, 2024 to 2034

Figure 85: Latin America Market Y-o-Y Growth (%) Projections by Function, 2024 to 2034

Figure 86: Latin America Market Attractiveness by Preservatives Type, 2024 to 2034

Figure 87: Latin America Market Attractiveness by Animal Type, 2024 to 2034

Figure 88: Latin America Market Attractiveness by Form, 2024 to 2034

Figure 89: Latin America Market Attractiveness by Function, 2024 to 2034

Figure 90: Latin America Market Attractiveness by Country, 2024 to 2034

Figure 91: Western Europe Market Value (US$ Million) by Preservatives Type, 2024 to 2034

Figure 92: Western Europe Market Value (US$ Million) by Animal Type, 2024 to 2034

Figure 93: Western Europe Market Value (US$ Million) by Form, 2024 to 2034

Figure 94: Western Europe Market Value (US$ Million) by Function, 2024 to 2034

Figure 95: Western Europe Market Value (US$ Million) by Country, 2024 to 2034

Figure 96: Western Europe Market Value (US$ Million) Analysis by Country, 2019 to 2034

Figure 97: Western Europe Market Volume (Tons) Analysis by Country, 2019 to 2034

Figure 98: Western Europe Market Value Share (%) and BPS Analysis by Country, 2024 to 2034

Figure 99: Western Europe Market Y-o-Y Growth (%) Projections by Country, 2024 to 2034

Figure 100: Western Europe Market Value (US$ Million) Analysis by Preservatives Type, 2019 to 2034

Figure 101: Western Europe Market Volume (Tons) Analysis by Preservatives Type, 2019 to 2034

Figure 102: Western Europe Market Value Share (%) and BPS Analysis by Preservatives Type, 2024 to 2034

Figure 103: Western Europe Market Y-o-Y Growth (%) Projections by Preservatives Type, 2024 to 2034

Figure 104: Western Europe Market Value (US$ Million) Analysis by Animal Type, 2019 to 2034

Figure 105: Western Europe Market Volume (Tons) Analysis by Animal Type, 2019 to 2034

Figure 106: Western Europe Market Value Share (%) and BPS Analysis by Animal Type, 2024 to 2034

Figure 107: Western Europe Market Y-o-Y Growth (%) Projections by Animal Type, 2024 to 2034

Figure 108: Western Europe Market Value (US$ Million) Analysis by Form, 2019 to 2034

Figure 109: Western Europe Market Volume (Tons) Analysis by Form, 2019 to 2034

Figure 110: Western Europe Market Value Share (%) and BPS Analysis by Form, 2024 to 2034

Figure 111: Western Europe Market Y-o-Y Growth (%) Projections by Form, 2024 to 2034

Figure 112: Western Europe Market Value (US$ Million) Analysis by Function, 2019 to 2034

Figure 113: Western Europe Market Volume (Tons) Analysis by Function, 2019 to 2034

Figure 114: Western Europe Market Value Share (%) and BPS Analysis by Function, 2024 to 2034

Figure 115: Western Europe Market Y-o-Y Growth (%) Projections by Function, 2024 to 2034

Figure 116: Western Europe Market Attractiveness by Preservatives Type, 2024 to 2034

Figure 117: Western Europe Market Attractiveness by Animal Type, 2024 to 2034

Figure 118: Western Europe Market Attractiveness by Form, 2024 to 2034

Figure 119: Western Europe Market Attractiveness by Function, 2024 to 2034

Figure 120: Western Europe Market Attractiveness by Country, 2024 to 2034

Figure 121: Eastern Europe Market Value (US$ Million) by Preservatives Type, 2024 to 2034

Figure 122: Eastern Europe Market Value (US$ Million) by Animal Type, 2024 to 2034

Figure 123: Eastern Europe Market Value (US$ Million) by Form, 2024 to 2034

Figure 124: Eastern Europe Market Value (US$ Million) by Function, 2024 to 2034

Figure 125: Eastern Europe Market Value (US$ Million) by Country, 2024 to 2034

Figure 126: Eastern Europe Market Value (US$ Million) Analysis by Country, 2019 to 2034

Figure 127: Eastern Europe Market Volume (Tons) Analysis by Country, 2019 to 2034

Figure 128: Eastern Europe Market Value Share (%) and BPS Analysis by Country, 2024 to 2034

Figure 129: Eastern Europe Market Y-o-Y Growth (%) Projections by Country, 2024 to 2034

Figure 130: Eastern Europe Market Value (US$ Million) Analysis by Preservatives Type, 2019 to 2034

Figure 131: Eastern Europe Market Volume (Tons) Analysis by Preservatives Type, 2019 to 2034

Figure 132: Eastern Europe Market Value Share (%) and BPS Analysis by Preservatives Type, 2024 to 2034

Figure 133: Eastern Europe Market Y-o-Y Growth (%) Projections by Preservatives Type, 2024 to 2034

Figure 134: Eastern Europe Market Value (US$ Million) Analysis by Animal Type, 2019 to 2034

Figure 135: Eastern Europe Market Volume (Tons) Analysis by Animal Type, 2019 to 2034

Figure 136: Eastern Europe Market Value Share (%) and BPS Analysis by Animal Type, 2024 to 2034

Figure 137: Eastern Europe Market Y-o-Y Growth (%) Projections by Animal Type, 2024 to 2034

Figure 138: Eastern Europe Market Value (US$ Million) Analysis by Form, 2019 to 2034

Figure 139: Eastern Europe Market Volume (Tons) Analysis by Form, 2019 to 2034

Figure 140: Eastern Europe Market Value Share (%) and BPS Analysis by Form, 2024 to 2034

Figure 141: Eastern Europe Market Y-o-Y Growth (%) Projections by Form, 2024 to 2034

Figure 142: Eastern Europe Market Value (US$ Million) Analysis by Function, 2019 to 2034

Figure 143: Eastern Europe Market Volume (Tons) Analysis by Function, 2019 to 2034

Figure 144: Eastern Europe Market Value Share (%) and BPS Analysis by Function, 2024 to 2034

Figure 145: Eastern Europe Market Y-o-Y Growth (%) Projections by Function, 2024 to 2034

Figure 146: Eastern Europe Market Attractiveness by Preservatives Type, 2024 to 2034

Figure 147: Eastern Europe Market Attractiveness by Animal Type, 2024 to 2034

Figure 148: Eastern Europe Market Attractiveness by Form, 2024 to 2034

Figure 149: Eastern Europe Market Attractiveness by Function, 2024 to 2034

Figure 150: Eastern Europe Market Attractiveness by Country, 2024 to 2034

Figure 151: South Asia and Pacific Market Value (US$ Million) by Preservatives Type, 2024 to 2034

Figure 152: South Asia and Pacific Market Value (US$ Million) by Animal Type, 2024 to 2034

Figure 153: South Asia and Pacific Market Value (US$ Million) by Form, 2024 to 2034

Figure 154: South Asia and Pacific Market Value (US$ Million) by Function, 2024 to 2034

Figure 155: South Asia and Pacific Market Value (US$ Million) by Country, 2024 to 2034

Figure 156: South Asia and Pacific Market Value (US$ Million) Analysis by Country, 2019 to 2034

Figure 157: South Asia and Pacific Market Volume (Tons) Analysis by Country, 2019 to 2034

Figure 158: South Asia and Pacific Market Value Share (%) and BPS Analysis by Country, 2024 to 2034

Figure 159: South Asia and Pacific Market Y-o-Y Growth (%) Projections by Country, 2024 to 2034

Figure 160: South Asia and Pacific Market Value (US$ Million) Analysis by Preservatives Type, 2019 to 2034

Figure 161: South Asia and Pacific Market Volume (Tons) Analysis by Preservatives Type, 2019 to 2034

Figure 162: South Asia and Pacific Market Value Share (%) and BPS Analysis by Preservatives Type, 2024 to 2034

Figure 163: South Asia and Pacific Market Y-o-Y Growth (%) Projections by Preservatives Type, 2024 to 2034

Figure 164: South Asia and Pacific Market Value (US$ Million) Analysis by Animal Type, 2019 to 2034

Figure 165: South Asia and Pacific Market Volume (Tons) Analysis by Animal Type, 2019 to 2034

Figure 166: South Asia and Pacific Market Value Share (%) and BPS Analysis by Animal Type, 2024 to 2034

Figure 167: South Asia and Pacific Market Y-o-Y Growth (%) Projections by Animal Type, 2024 to 2034

Figure 168: South Asia and Pacific Market Value (US$ Million) Analysis by Form, 2019 to 2034

Figure 169: South Asia and Pacific Market Volume (Tons) Analysis by Form, 2019 to 2034

Figure 170: South Asia and Pacific Market Value Share (%) and BPS Analysis by Form, 2024 to 2034

Figure 171: South Asia and Pacific Market Y-o-Y Growth (%) Projections by Form, 2024 to 2034

Figure 172: South Asia and Pacific Market Value (US$ Million) Analysis by Function, 2019 to 2034

Figure 173: South Asia and Pacific Market Volume (Tons) Analysis by Function, 2019 to 2034

Figure 174: South Asia and Pacific Market Value Share (%) and BPS Analysis by Function, 2024 to 2034

Figure 175: South Asia and Pacific Market Y-o-Y Growth (%) Projections by Function, 2024 to 2034

Figure 176: South Asia and Pacific Market Attractiveness by Preservatives Type, 2024 to 2034

Figure 177: South Asia and Pacific Market Attractiveness by Animal Type, 2024 to 2034

Figure 178: South Asia and Pacific Market Attractiveness by Form, 2024 to 2034

Figure 179: South Asia and Pacific Market Attractiveness by Function, 2024 to 2034

Figure 180: South Asia and Pacific Market Attractiveness by Country, 2024 to 2034

Figure 181: East Asia Market Value (US$ Million) by Preservatives Type, 2024 to 2034

Figure 182: East Asia Market Value (US$ Million) by Animal Type, 2024 to 2034

Figure 183: East Asia Market Value (US$ Million) by Form, 2024 to 2034

Figure 184: East Asia Market Value (US$ Million) by Function, 2024 to 2034

Figure 185: East Asia Market Value (US$ Million) by Country, 2024 to 2034

Figure 186: East Asia Market Value (US$ Million) Analysis by Country, 2019 to 2034

Figure 187: East Asia Market Volume (Tons) Analysis by Country, 2019 to 2034

Figure 188: East Asia Market Value Share (%) and BPS Analysis by Country, 2024 to 2034

Figure 189: East Asia Market Y-o-Y Growth (%) Projections by Country, 2024 to 2034

Figure 190: East Asia Market Value (US$ Million) Analysis by Preservatives Type, 2019 to 2034

Figure 191: East Asia Market Volume (Tons) Analysis by Preservatives Type, 2019 to 2034

Figure 192: East Asia Market Value Share (%) and BPS Analysis by Preservatives Type, 2024 to 2034

Figure 193: East Asia Market Y-o-Y Growth (%) Projections by Preservatives Type, 2024 to 2034

Figure 194: East Asia Market Value (US$ Million) Analysis by Animal Type, 2019 to 2034

Figure 195: East Asia Market Volume (Tons) Analysis by Animal Type, 2019 to 2034

Figure 196: East Asia Market Value Share (%) and BPS Analysis by Animal Type, 2024 to 2034

Figure 197: East Asia Market Y-o-Y Growth (%) Projections by Animal Type, 2024 to 2034

Figure 198: East Asia Market Value (US$ Million) Analysis by Form, 2019 to 2034

Figure 199: East Asia Market Volume (Tons) Analysis by Form, 2019 to 2034

Figure 200: East Asia Market Value Share (%) and BPS Analysis by Form, 2024 to 2034

Figure 201: East Asia Market Y-o-Y Growth (%) Projections by Form, 2024 to 2034

Figure 202: East Asia Market Value (US$ Million) Analysis by Function, 2019 to 2034

Figure 203: East Asia Market Volume (Tons) Analysis by Function, 2019 to 2034

Figure 204: East Asia Market Value Share (%) and BPS Analysis by Function, 2024 to 2034

Figure 205: East Asia Market Y-o-Y Growth (%) Projections by Function, 2024 to 2034

Figure 206: East Asia Market Attractiveness by Preservatives Type, 2024 to 2034

Figure 207: East Asia Market Attractiveness by Animal Type, 2024 to 2034

Figure 208: East Asia Market Attractiveness by Form, 2024 to 2034

Figure 209: East Asia Market Attractiveness by Function, 2024 to 2034

Figure 210: East Asia Market Attractiveness by Country, 2024 to 2034

Figure 211: Middle East and Africa Market Value (US$ Million) by Preservatives Type, 2024 to 2034

Figure 212: Middle East and Africa Market Value (US$ Million) by Animal Type, 2024 to 2034

Figure 213: Middle East and Africa Market Value (US$ Million) by Form, 2024 to 2034

Figure 214: Middle East and Africa Market Value (US$ Million) by Function, 2024 to 2034

Figure 215: Middle East and Africa Market Value (US$ Million) by Country, 2024 to 2034

Figure 216: Middle East and Africa Market Value (US$ Million) Analysis by Country, 2019 to 2034

Figure 217: Middle East and Africa Market Volume (Tons) Analysis by Country, 2019 to 2034

Figure 218: Middle East and Africa Market Value Share (%) and BPS Analysis by Country, 2024 to 2034

Figure 219: Middle East and Africa Market Y-o-Y Growth (%) Projections by Country, 2024 to 2034

Figure 220: Middle East and Africa Market Value (US$ Million) Analysis by Preservatives Type, 2019 to 2034

Figure 221: Middle East and Africa Market Volume (Tons) Analysis by Preservatives Type, 2019 to 2034

Figure 222: Middle East and Africa Market Value Share (%) and BPS Analysis by Preservatives Type, 2024 to 2034

Figure 223: Middle East and Africa Market Y-o-Y Growth (%) Projections by Preservatives Type, 2024 to 2034

Figure 224: Middle East and Africa Market Value (US$ Million) Analysis by Animal Type, 2019 to 2034

Figure 225: Middle East and Africa Market Volume (Tons) Analysis by Animal Type, 2019 to 2034

Figure 226: Middle East and Africa Market Value Share (%) and BPS Analysis by Animal Type, 2024 to 2034

Figure 227: Middle East and Africa Market Y-o-Y Growth (%) Projections by Animal Type, 2024 to 2034

Figure 228: Middle East and Africa Market Value (US$ Million) Analysis by Form, 2019 to 2034

Figure 229: Middle East and Africa Market Volume (Tons) Analysis by Form, 2019 to 2034

Figure 230: Middle East and Africa Market Value Share (%) and BPS Analysis by Form, 2024 to 2034

Figure 231: Middle East and Africa Market Y-o-Y Growth (%) Projections by Form, 2024 to 2034

Figure 232: Middle East and Africa Market Value (US$ Million) Analysis by Function, 2019 to 2034

Figure 233: Middle East and Africa Market Volume (Tons) Analysis by Function, 2019 to 2034

Figure 234: Middle East and Africa Market Value Share (%) and BPS Analysis by Function, 2024 to 2034

Figure 235: Middle East and Africa Market Y-o-Y Growth (%) Projections by Function, 2024 to 2034

Figure 236: Middle East and Africa Market Attractiveness by Preservatives Type, 2024 to 2034

Figure 237: Middle East and Africa Market Attractiveness by Animal Type, 2024 to 2034

Figure 238: Middle East and Africa Market Attractiveness by Form, 2024 to 2034

Figure 239: Middle East and Africa Market Attractiveness by Function, 2024 to 2034

Figure 240: Middle East and Africa Market Attractiveness by Country, 2024 to 2034

Recommendations

Food and Beverage

Animal Feed Additive Market

Published : January 2024

Food and Beverage

Animal Feed Market

Published : June 2023

Explore Food and Beverage Insights

View Reports

Animal Feed Preservative Market