Animal Antimicrobials and Antibiotics Market Outlook (2023 to 2033)
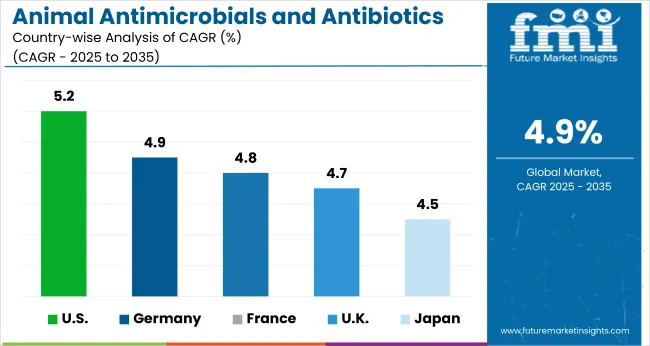
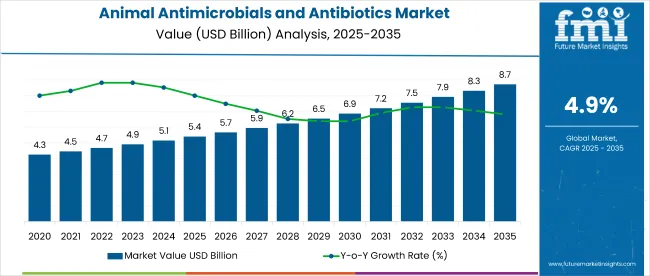
According to Future Market Insights research, during the projected period, the Global animal antimicrobials and antibiotics market is expected to grow at a CAGR of 4.9%. The market value is projected to increase to USD 7,878.2 million by 2033.

Demand for animal antimicrobials and antibiotics is expected to rise as a result of the widespread use of various types of meat and milk in dairy products, notably in the western diet, and the rapid spread of similar eating habits worldwide.

Attribute Details
Animal Antimicrobials and Antibiotics Market Size Value in 2023 USD 4,911.9 million
Animal Antimicrobials and Antibiotics Market Forecast Value in 2033 USD 7,878.2 million
Global Animal Antimicrobials and Antibiotics Market Growth Rate (2023 to 2033) 4.9%

The market is growing due to factors like the rise in zoonotic illnesses, the demand for animal-derived food products, and the adoption of regulations to curb the spread of animal diseases. Due to rising demand for pet insurance and rising expenditures for veterinary care, this market share for animal antimicrobials and antibiotics is predicted to grow.

During the forecast period, animal antimicrobials and antibiotics market participants can anticipate tremendous development potential due to the untapped emerging markets of China, India, and Brazil, as well as the rise in the overall population of companion animals.

Recent Trends Influencing the Animal Antimicrobials and Antibiotics Market

Research and Development

Sales of animal antimicrobials and antibiotics are soaring as a result of the leading companies' new medication innovations and enhanced research and development facilities, which are fueling the demand for effective treatment of animal diseases.

It is anticipated that increasing numbers of people own companion animals and are willing to spend money to ensure their health and welfare. This is likely to support the expansion of the animal health industry, which then fuels the demand for animal antimicrobials and antibiotics.

Government Initiatives

The development of early warning systems for the majority of animal diseases by a number of government and non-government groups has fueled the expansion of the global market for animal antibiotics and antimicrobials.

Restricting Factor

Strict regulatory requirements and rising use of antibiotic substitutes like feed enzymes and probiotics are some of the reasons partially limiting the growth of the global market for animal antibiotics and antimicrobials.

Human infections that are resistant to antibiotics can lengthen sickness times, increase hospital admissions, and treatment failures that are fatal. Nearly 400,000 people per year die from food-borne illnesses, with children under the age of five accounting for over one-third of these deaths, according to the WHO.

Therefore, veterinarians advise treating animals with less potent antibiotics. These actions could have a big impact on how frequently antibiotics are used worldwide.

FDA Approach Animal Antimicrobials and Antibiotics Market for Production Purpose

In addition to organizing listening sessions across the nation to hear the concerns of both producers and veterinarians, FDA has been working closely with the American Veterinary Medical Association, other veterinary associations, and groups that represent animal producers.

Based on our outreach, they are convinced that veterinarians and animal producers are aware of their responsibility in ensuring the proper and prudent administration of the animal antimicrobials and antibiotics.

Medically significant animal antimicrobials and antibiotics can no longer be used for production if manufacturers voluntarily adopt these changes; instead, they must be ordered or prescribed by a qualified veterinarian in order to continue treating, controlling, or preventing disease in food animals.

FDA is presently investigating methods for strengthening current data gathering efforts in partnership with other agencies, such as USDA and CDC. FDA expects to seek additional public feedback, as it creates these improvements in animal antimicrobials and antibiotics.

The USA, European, and Japanese regulatory agencies are brought together by the Veterinary International Committee for Harmonization (VICH), which also harmonizes the rules and technical specifications for registering veterinary products.

Regional Outlook

What is the North America Outlook for the Animal Antimicrobials and Antibiotics Market?

Geographically, North America dominates the market for animal antibiotics and antimicrobials, owing to the region's high prevalence of animal disease outbreaks, excessive consumption of livestock products, prevalence of pet ownership, and elevated awareness of animal disease outbreaks.

The leading market participants in North America are also making significant financial investments in the creation of medicines to treat animal ailments, prompting the demand for animal antimicrobials and antibiotics.

How Asia Pacific is Performing in the Animal Antimicrobials and Antibiotics Market?

On a global scale, the market for animal antibiotics and antimicrobials is expanding at the quickest rate in Asia Pacific. The region's rapid expansion is related to the rise in the number of animals, the demand for animal antibiotics, and the prevalence of animal diseases.

Additionally, the market for animal antibiotics and antimicrobials in the Asia Pacific region is expanding as a result of rising disposable income, a rise in the number of people owning pets as companions, and a rise in government involvement in the fight against the spread of animal diseases in developing nations such as India and China.

Asian nations are predicted to experience the highest growth in the demand for livestock products like beef, milk, mutton, pork, and poultry products, according to a 2018 FAO (Food and Agriculture Organization of the United Nations) survey on mapping the supply and demand for food sourced from animals.

Competitive Landscape

An important development in the market for animal antibiotics and antimicrobials is the strategic collaboration. In order to conduct research and produce cutting-edge animal antibiotics and antimicrobials, companies are forming strategic alliances with key industry players.

Recent Developments in the Market

  • Trianni Inc. (USA) and Zoetis (USA) have decided to work together on developing transgenic monoclonal antibody platforms for the discovery of innovative veterinary medications. This collaboration began in July 2020. The FDA approved Zoetis' purchase of Marboquin (USA).
  • Elanco (USA) and AgBiome worked together to provide nutritional health solutions for pigs in 2019.
  • By balancing its food animal and companion animal divisions, Elanco Animal Health (USA) announced in 2019 that it purchases Bayer's Animal Health Business, boosting its own companion animal business and portfolio mix.
  • In 2019, Sanofi (France) purchased the Animal Health division of Boehringer Ingelheim (Germany) (Merial), and Boehringer Ingelheim (Germany) (CHC) was bought by Sanofi. After acquiring Merial, BI became the second-largest animal health firm in the world.

Animal Antimicrobials and Antibiotics Market Report Scope

Attribute Details
Forecast Period 2023 to 2033
Historical Data Available for 2018 to 2022
Market Analysis USD million for Value and Units for Volume
Key Regions Covered North America; Latin America; Europe; South Asia; East Asia; Oceania; MEA
Key Countries Covered USA, Canada, Mexico, Germany, United Kingdom, France, Italy, Spain, China, Japan, India, South Korea, Australia, Brazil, Argentina, South Africa, UAE
Key Segments Covered Product Type, Animal Type, Mode of Delivery, Region
Key Companies Profiled Bayer AG; BoehringerIngelheim GmbH; CevaSanteAnimale; Dechra Pharmaceuticals PLC; Eli Lilly and Company; Merck & Co., Inc.; Sanofi; Vetoquinol S.A.; Virbac; Zoetis, Inc.; Elanco Animal Health; Phibro Animal Health; Virbac; Kyoritsu Seiyaku (Japan); Tianjin Ringpu; HIPRA; Zydus Animal Health; Inovet
Report Coverage Market Forecast, Company Share Analysis, Competitive Landscape, DROT Analysis, Market Dynamics and Challenges, and Strategic Growth Initiatives
Customization & Pricing Available upon Request

Animal Antimicrobials and Antibiotics Market by Category

By Product Type:

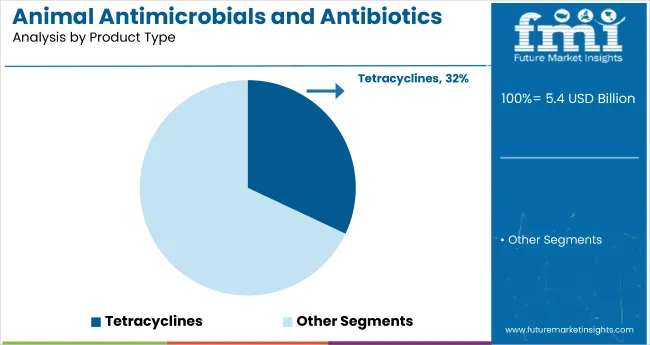
  • Tetracyclines
  • Penicillins
  • Sulfonamides
  • Macrolides
  • Aminoglycosides
  • Lincosamides
  • Fluoroquinolones
  • Cephalosporins
  • Other Antimicrobials and Antibiotics

By Animal Type:

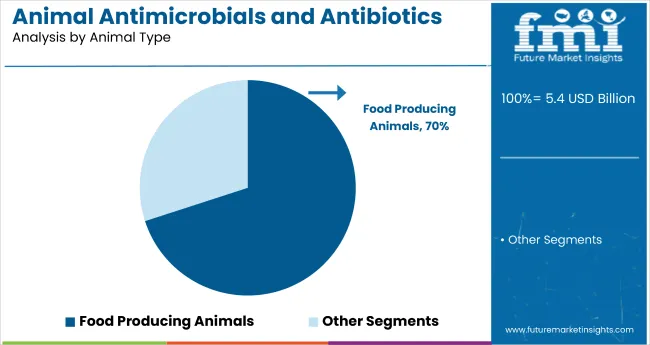
  • Companion Animals
  • Food Producing Animals

By Mode of Delivery:

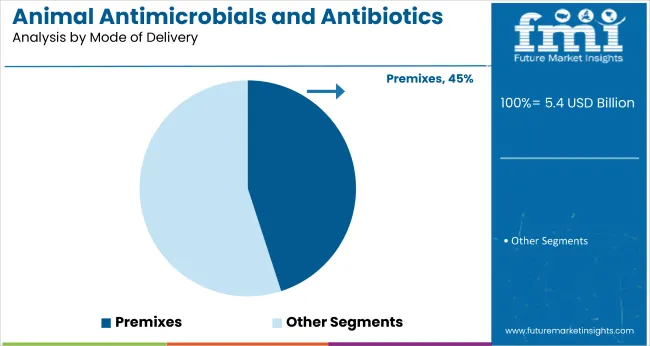
  • Premixes
  • Oral Powder
  • Oral Solution
  • Injection

By Region:

  • North America
  • Latin America
  • Europe
  • East Asia
  • South Asia
  • Oceania
  • Middle East and Africa (MEA)

Table of Content

  • 1. Executive Summary
  • 2. Market Overview
  • 3. Market Background
  • 4. Global Market Analysis 2018 to 2022 and Forecast, 2023 to 2033
  • 5. Global Market Analysis 2018 to 2022 and Forecast 2023 to 2033, By Product Type
    • 5.1. Tetracyclines
    • 5.2. Penicillins
    • 5.3. Sulfonamides
    • 5.4. Macrolides
    • 5.5. Aminoglycosides
    • 5.6. Lincosamides
    • 5.7. Fluoroquinolones
    • 5.8. Cephalosporins
    • 5.9. Others
  • 6. Global Market Analysis 2018 to 2022 and Forecast 2023 to 2033, By Animal Type
    • 6.1. Companion Animals
    • 6.2. Food Producing Animals
  • 7. Global Market Analysis 2018 to 2022 and Forecast 2023 to 2033, By Mode of Delivery
    • 7.1. Premixes
    • 7.2. Oral Powder
    • 7.3. Oral Solution
    • 7.4. Injection
  • 8. Global Market Analysis 2018 to 2022 and Forecast 2023 to 2033, By Region
    • 8.1. North America
    • 8.2. Latin America
    • 8.3. Western Europe
    • 8.4. Eastern Europe
    • 8.5. South Asia and Pacific
    • 8.6. East Asia
    • 8.7. Middle East and Africa
  • 9. North America Market Analysis 2018 to 2022 and Forecast 2023 to 2033, By Country
  • 10. Latin America Market Analysis 2018 to 2022 and Forecast 2023 to 2033, By Country
  • 11. Western Europe Market Analysis 2018 to 2022 and Forecast 2023 to 2033, By Country
  • 12. Eastern Europe Market Analysis 2018 to 2022 and Forecast 2023 to 2033, By Country
  • 13. South Asia and Pacific Market Analysis 2018 to 2022 and Forecast 2023 to 2033, By Country
  • 14. East Asia Market Analysis 2018 to 2022 and Forecast 2023 to 2033, By Country
  • 15. Middle East and Africa Market Analysis 2018 to 2022 and Forecast 2023 to 2033, By Country
  • 16. Key Countries Market Analysis
  • 17. Market Structure Analysis
  • 18. Competition Analysis
    • 18.1. Bayer AG
    • 18.2. Boehringer Ingelheim GmbH
    • 18.3. Ceva Sante Animale
    • 18.4. Dechra Pharmaceuticals PLC
    • 18.5. Eli Lilly and Company
    • 18.6. Merck & Co., Inc.
    • 18.7. Sanofi
    • 18.8. Vetoquinol S.A.
    • 18.9. Virbac
    • 18.10. Zoetis, Inc.
    • 18.11. Elanco Animal Health
    • 18.12. Phibro Animal Health
    • 18.13. Virbac
    • 18.14. Kyoritsu Seiyaku (Japan)
    • 18.15. Tianjin Ringpu
    • 18.16. HIPRA
    • 18.17. Zydus Animal Health
    • 18.18. Inovet
  • 19. Assumptions & Acronyms Used
  • 20. Research Methodology

List of Tables

Table 1: Global Market Value (US$ Million) Forecast by Region, 2018 to 2033

Table 2: Global Market Volume (MT) Forecast by Region, 2018 to 2033

Table 3: Global Market Value (US$ Million) Forecast by Product Type, 2018 to 2033

Table 4: Global Market Volume (MT) Forecast by Product Type, 2018 to 2033

Table 5: Global Market Value (US$ Million) Forecast by Animal Type, 2018 to 2033

Table 6: Global Market Volume (MT) Forecast by Animal Type, 2018 to 2033

Table 7: Global Market Value (US$ Million) Forecast by Mode of Delivery, 2018 to 2033

Table 8: Global Market Volume (MT) Forecast by Mode of Delivery, 2018 to 2033

Table 9: North America Market Value (US$ Million) Forecast by Country, 2018 to 2033

Table 10: North America Market Volume (MT) Forecast by Country, 2018 to 2033

Table 11: North America Market Value (US$ Million) Forecast by Product Type, 2018 to 2033

Table 12: North America Market Volume (MT) Forecast by Product Type, 2018 to 2033

Table 13: North America Market Value (US$ Million) Forecast by Animal Type, 2018 to 2033

Table 14: North America Market Volume (MT) Forecast by Animal Type, 2018 to 2033

Table 15: North America Market Value (US$ Million) Forecast by Mode of Delivery, 2018 to 2033

Table 16: North America Market Volume (MT) Forecast by Mode of Delivery, 2018 to 2033

Table 17: Latin America Market Value (US$ Million) Forecast by Country, 2018 to 2033

Table 18: Latin America Market Volume (MT) Forecast by Country, 2018 to 2033

Table 19: Latin America Market Value (US$ Million) Forecast by Product Type, 2018 to 2033

Table 20: Latin America Market Volume (MT) Forecast by Product Type, 2018 to 2033

Table 21: Latin America Market Value (US$ Million) Forecast by Animal Type, 2018 to 2033

Table 22: Latin America Market Volume (MT) Forecast by Animal Type, 2018 to 2033

Table 23: Latin America Market Value (US$ Million) Forecast by Mode of Delivery, 2018 to 2033

Table 24: Latin America Market Volume (MT) Forecast by Mode of Delivery, 2018 to 2033

Table 25: Western Europe Market Value (US$ Million) Forecast by Country, 2018 to 2033

Table 26: Western Europe Market Volume (MT) Forecast by Country, 2018 to 2033

Table 27: Western Europe Market Value (US$ Million) Forecast by Product Type, 2018 to 2033

Table 28: Western Europe Market Volume (MT) Forecast by Product Type, 2018 to 2033

Table 29: Western Europe Market Value (US$ Million) Forecast by Animal Type, 2018 to 2033

Table 30: Western Europe Market Volume (MT) Forecast by Animal Type, 2018 to 2033

Table 31: Western Europe Market Value (US$ Million) Forecast by Mode of Delivery, 2018 to 2033

Table 32: Western Europe Market Volume (MT) Forecast by Mode of Delivery, 2018 to 2033

Table 33: Eastern Europe Market Value (US$ Million) Forecast by Country, 2018 to 2033

Table 34: Eastern Europe Market Volume (MT) Forecast by Country, 2018 to 2033

Table 35: Eastern Europe Market Value (US$ Million) Forecast by Product Type, 2018 to 2033

Table 36: Eastern Europe Market Volume (MT) Forecast by Product Type, 2018 to 2033

Table 37: Eastern Europe Market Value (US$ Million) Forecast by Animal Type, 2018 to 2033

Table 38: Eastern Europe Market Volume (MT) Forecast by Animal Type, 2018 to 2033

Table 39: Eastern Europe Market Value (US$ Million) Forecast by Mode of Delivery, 2018 to 2033

Table 40: Eastern Europe Market Volume (MT) Forecast by Mode of Delivery, 2018 to 2033

Table 41: South Asia and Pacific Market Value (US$ Million) Forecast by Country, 2018 to 2033

Table 42: South Asia and Pacific Market Volume (MT) Forecast by Country, 2018 to 2033

Table 43: South Asia and Pacific Market Value (US$ Million) Forecast by Product Type, 2018 to 2033

Table 44: South Asia and Pacific Market Volume (MT) Forecast by Product Type, 2018 to 2033

Table 45: South Asia and Pacific Market Value (US$ Million) Forecast by Animal Type, 2018 to 2033

Table 46: South Asia and Pacific Market Volume (MT) Forecast by Animal Type, 2018 to 2033

Table 47: South Asia and Pacific Market Value (US$ Million) Forecast by Mode of Delivery, 2018 to 2033

Table 48: South Asia and Pacific Market Volume (MT) Forecast by Mode of Delivery, 2018 to 2033

Table 49: East Asia Market Value (US$ Million) Forecast by Country, 2018 to 2033

Table 50: East Asia Market Volume (MT) Forecast by Country, 2018 to 2033

Table 51: East Asia Market Value (US$ Million) Forecast by Product Type, 2018 to 2033

Table 52: East Asia Market Volume (MT) Forecast by Product Type, 2018 to 2033

Table 53: East Asia Market Value (US$ Million) Forecast by Animal Type, 2018 to 2033

Table 54: East Asia Market Volume (MT) Forecast by Animal Type, 2018 to 2033

Table 55: East Asia Market Value (US$ Million) Forecast by Mode of Delivery, 2018 to 2033

Table 56: East Asia Market Volume (MT) Forecast by Mode of Delivery, 2018 to 2033

Table 57: Middle East and Africa Market Value (US$ Million) Forecast by Country, 2018 to 2033

Table 58: Middle East and Africa Market Volume (MT) Forecast by Country, 2018 to 2033

Table 59: Middle East and Africa Market Value (US$ Million) Forecast by Product Type, 2018 to 2033

Table 60: Middle East and Africa Market Volume (MT) Forecast by Product Type, 2018 to 2033

Table 61: Middle East and Africa Market Value (US$ Million) Forecast by Animal Type, 2018 to 2033

Table 62: Middle East and Africa Market Volume (MT) Forecast by Animal Type, 2018 to 2033

Table 63: Middle East and Africa Market Value (US$ Million) Forecast by Mode of Delivery, 2018 to 2033

Table 64: Middle East and Africa Market Volume (MT) Forecast by Mode of Delivery, 2018 to 2033

List of Figures

Figure 1: Global Market Value (US$ Million) by Product Type, 2023 to 2033

Figure 2: Global Market Value (US$ Million) by Animal Type, 2023 to 2033

Figure 3: Global Market Value (US$ Million) by Mode of Delivery, 2023 to 2033

Figure 4: Global Market Value (US$ Million) by Region, 2023 to 2033

Figure 5: Global Market Value (US$ Million) Analysis by Region, 2018 to 2033

Figure 6: Global Market Volume (MT) Analysis by Region, 2018 to 2033

Figure 7: Global Market Value Share (%) and BPS Analysis by Region, 2023 to 2033

Figure 8: Global Market Y-o-Y Growth (%) Projections by Region, 2023 to 2033

Figure 9: Global Market Value (US$ Million) Analysis by Product Type, 2018 to 2033

Figure 10: Global Market Volume (MT) Analysis by Product Type, 2018 to 2033

Figure 11: Global Market Value Share (%) and BPS Analysis by Product Type, 2023 to 2033

Figure 12: Global Market Y-o-Y Growth (%) Projections by Product Type, 2023 to 2033

Figure 13: Global Market Value (US$ Million) Analysis by Animal Type, 2018 to 2033

Figure 14: Global Market Volume (MT) Analysis by Animal Type, 2018 to 2033

Figure 15: Global Market Value Share (%) and BPS Analysis by Animal Type, 2023 to 2033

Figure 16: Global Market Y-o-Y Growth (%) Projections by Animal Type, 2023 to 2033

Figure 17: Global Market Value (US$ Million) Analysis by Mode of Delivery, 2018 to 2033

Figure 18: Global Market Volume (MT) Analysis by Mode of Delivery, 2018 to 2033

Figure 19: Global Market Value Share (%) and BPS Analysis by Mode of Delivery, 2023 to 2033

Figure 20: Global Market Y-o-Y Growth (%) Projections by Mode of Delivery, 2023 to 2033

Figure 21: Global Market Attractiveness by Product Type, 2023 to 2033

Figure 22: Global Market Attractiveness by Animal Type, 2023 to 2033

Figure 23: Global Market Attractiveness by Mode of Delivery, 2023 to 2033

Figure 24: Global Market Attractiveness by Region, 2023 to 2033

Figure 25: North America Market Value (US$ Million) by Product Type, 2023 to 2033

Figure 26: North America Market Value (US$ Million) by Animal Type, 2023 to 2033

Figure 27: North America Market Value (US$ Million) by Mode of Delivery, 2023 to 2033

Figure 28: North America Market Value (US$ Million) by Country, 2023 to 2033

Figure 29: North America Market Value (US$ Million) Analysis by Country, 2018 to 2033

Figure 30: North America Market Volume (MT) Analysis by Country, 2018 to 2033

Figure 31: North America Market Value Share (%) and BPS Analysis by Country, 2023 to 2033

Figure 32: North America Market Y-o-Y Growth (%) Projections by Country, 2023 to 2033

Figure 33: North America Market Value (US$ Million) Analysis by Product Type, 2018 to 2033

Figure 34: North America Market Volume (MT) Analysis by Product Type, 2018 to 2033

Figure 35: North America Market Value Share (%) and BPS Analysis by Product Type, 2023 to 2033

Figure 36: North America Market Y-o-Y Growth (%) Projections by Product Type, 2023 to 2033

Figure 37: North America Market Value (US$ Million) Analysis by Animal Type, 2018 to 2033

Figure 38: North America Market Volume (MT) Analysis by Animal Type, 2018 to 2033

Figure 39: North America Market Value Share (%) and BPS Analysis by Animal Type, 2023 to 2033

Figure 40: North America Market Y-o-Y Growth (%) Projections by Animal Type, 2023 to 2033

Figure 41: North America Market Value (US$ Million) Analysis by Mode of Delivery, 2018 to 2033

Figure 42: North America Market Volume (MT) Analysis by Mode of Delivery, 2018 to 2033

Figure 43: North America Market Value Share (%) and BPS Analysis by Mode of Delivery, 2023 to 2033

Figure 44: North America Market Y-o-Y Growth (%) Projections by Mode of Delivery, 2023 to 2033

Figure 45: North America Market Attractiveness by Product Type, 2023 to 2033

Figure 46: North America Market Attractiveness by Animal Type, 2023 to 2033

Figure 47: North America Market Attractiveness by Mode of Delivery, 2023 to 2033

Figure 48: North America Market Attractiveness by Country, 2023 to 2033

Figure 49: Latin America Market Value (US$ Million) by Product Type, 2023 to 2033

Figure 50: Latin America Market Value (US$ Million) by Animal Type, 2023 to 2033

Figure 51: Latin America Market Value (US$ Million) by Mode of Delivery, 2023 to 2033

Figure 52: Latin America Market Value (US$ Million) by Country, 2023 to 2033

Figure 53: Latin America Market Value (US$ Million) Analysis by Country, 2018 to 2033

Figure 54: Latin America Market Volume (MT) Analysis by Country, 2018 to 2033

Figure 55: Latin America Market Value Share (%) and BPS Analysis by Country, 2023 to 2033

Figure 56: Latin America Market Y-o-Y Growth (%) Projections by Country, 2023 to 2033

Figure 57: Latin America Market Value (US$ Million) Analysis by Product Type, 2018 to 2033

Figure 58: Latin America Market Volume (MT) Analysis by Product Type, 2018 to 2033

Figure 59: Latin America Market Value Share (%) and BPS Analysis by Product Type, 2023 to 2033

Figure 60: Latin America Market Y-o-Y Growth (%) Projections by Product Type, 2023 to 2033

Figure 61: Latin America Market Value (US$ Million) Analysis by Animal Type, 2018 to 2033

Figure 62: Latin America Market Volume (MT) Analysis by Animal Type, 2018 to 2033

Figure 63: Latin America Market Value Share (%) and BPS Analysis by Animal Type, 2023 to 2033

Figure 64: Latin America Market Y-o-Y Growth (%) Projections by Animal Type, 2023 to 2033

Figure 65: Latin America Market Value (US$ Million) Analysis by Mode of Delivery, 2018 to 2033

Figure 66: Latin America Market Volume (MT) Analysis by Mode of Delivery, 2018 to 2033

Figure 67: Latin America Market Value Share (%) and BPS Analysis by Mode of Delivery, 2023 to 2033

Figure 68: Latin America Market Y-o-Y Growth (%) Projections by Mode of Delivery, 2023 to 2033

Figure 69: Latin America Market Attractiveness by Product Type, 2023 to 2033

Figure 70: Latin America Market Attractiveness by Animal Type, 2023 to 2033

Figure 71: Latin America Market Attractiveness by Mode of Delivery, 2023 to 2033

Figure 72: Latin America Market Attractiveness by Country, 2023 to 2033

Figure 73: Western Europe Market Value (US$ Million) by Product Type, 2023 to 2033

Figure 74: Western Europe Market Value (US$ Million) by Animal Type, 2023 to 2033

Figure 75: Western Europe Market Value (US$ Million) by Mode of Delivery, 2023 to 2033

Figure 76: Western Europe Market Value (US$ Million) by Country, 2023 to 2033

Figure 77: Western Europe Market Value (US$ Million) Analysis by Country, 2018 to 2033

Figure 78: Western Europe Market Volume (MT) Analysis by Country, 2018 to 2033

Figure 79: Western Europe Market Value Share (%) and BPS Analysis by Country, 2023 to 2033

Figure 80: Western Europe Market Y-o-Y Growth (%) Projections by Country, 2023 to 2033

Figure 81: Western Europe Market Value (US$ Million) Analysis by Product Type, 2018 to 2033

Figure 82: Western Europe Market Volume (MT) Analysis by Product Type, 2018 to 2033

Figure 83: Western Europe Market Value Share (%) and BPS Analysis by Product Type, 2023 to 2033

Figure 84: Western Europe Market Y-o-Y Growth (%) Projections by Product Type, 2023 to 2033

Figure 85: Western Europe Market Value (US$ Million) Analysis by Animal Type, 2018 to 2033

Figure 86: Western Europe Market Volume (MT) Analysis by Animal Type, 2018 to 2033

Figure 87: Western Europe Market Value Share (%) and BPS Analysis by Animal Type, 2023 to 2033

Figure 88: Western Europe Market Y-o-Y Growth (%) Projections by Animal Type, 2023 to 2033

Figure 89: Western Europe Market Value (US$ Million) Analysis by Mode of Delivery, 2018 to 2033

Figure 90: Western Europe Market Volume (MT) Analysis by Mode of Delivery, 2018 to 2033

Figure 91: Western Europe Market Value Share (%) and BPS Analysis by Mode of Delivery, 2023 to 2033

Figure 92: Western Europe Market Y-o-Y Growth (%) Projections by Mode of Delivery, 2023 to 2033

Figure 93: Western Europe Market Attractiveness by Product Type, 2023 to 2033

Figure 94: Western Europe Market Attractiveness by Animal Type, 2023 to 2033

Figure 95: Western Europe Market Attractiveness by Mode of Delivery, 2023 to 2033

Figure 96: Western Europe Market Attractiveness by Country, 2023 to 2033

Figure 97: Eastern Europe Market Value (US$ Million) by Product Type, 2023 to 2033

Figure 98: Eastern Europe Market Value (US$ Million) by Animal Type, 2023 to 2033

Figure 99: Eastern Europe Market Value (US$ Million) by Mode of Delivery, 2023 to 2033

Figure 100: Eastern Europe Market Value (US$ Million) by Country, 2023 to 2033

Figure 101: Eastern Europe Market Value (US$ Million) Analysis by Country, 2018 to 2033

Figure 102: Eastern Europe Market Volume (MT) Analysis by Country, 2018 to 2033

Figure 103: Eastern Europe Market Value Share (%) and BPS Analysis by Country, 2023 to 2033

Figure 104: Eastern Europe Market Y-o-Y Growth (%) Projections by Country, 2023 to 2033

Figure 105: Eastern Europe Market Value (US$ Million) Analysis by Product Type, 2018 to 2033

Figure 106: Eastern Europe Market Volume (MT) Analysis by Product Type, 2018 to 2033

Figure 107: Eastern Europe Market Value Share (%) and BPS Analysis by Product Type, 2023 to 2033

Figure 108: Eastern Europe Market Y-o-Y Growth (%) Projections by Product Type, 2023 to 2033

Figure 109: Eastern Europe Market Value (US$ Million) Analysis by Animal Type, 2018 to 2033

Figure 110: Eastern Europe Market Volume (MT) Analysis by Animal Type, 2018 to 2033

Figure 111: Eastern Europe Market Value Share (%) and BPS Analysis by Animal Type, 2023 to 2033

Figure 112: Eastern Europe Market Y-o-Y Growth (%) Projections by Animal Type, 2023 to 2033

Figure 113: Eastern Europe Market Value (US$ Million) Analysis by Mode of Delivery, 2018 to 2033

Figure 114: Eastern Europe Market Volume (MT) Analysis by Mode of Delivery, 2018 to 2033

Figure 115: Eastern Europe Market Value Share (%) and BPS Analysis by Mode of Delivery, 2023 to 2033

Figure 116: Eastern Europe Market Y-o-Y Growth (%) Projections by Mode of Delivery, 2023 to 2033

Figure 117: Eastern Europe Market Attractiveness by Product Type, 2023 to 2033

Figure 118: Eastern Europe Market Attractiveness by Animal Type, 2023 to 2033

Figure 119: Eastern Europe Market Attractiveness by Mode of Delivery, 2023 to 2033

Figure 120: Eastern Europe Market Attractiveness by Country, 2023 to 2033

Figure 121: South Asia and Pacific Market Value (US$ Million) by Product Type, 2023 to 2033

Figure 122: South Asia and Pacific Market Value (US$ Million) by Animal Type, 2023 to 2033

Figure 123: South Asia and Pacific Market Value (US$ Million) by Mode of Delivery, 2023 to 2033

Figure 124: South Asia and Pacific Market Value (US$ Million) by Country, 2023 to 2033

Figure 125: South Asia and Pacific Market Value (US$ Million) Analysis by Country, 2018 to 2033

Figure 126: South Asia and Pacific Market Volume (MT) Analysis by Country, 2018 to 2033

Figure 127: South Asia and Pacific Market Value Share (%) and BPS Analysis by Country, 2023 to 2033

Figure 128: South Asia and Pacific Market Y-o-Y Growth (%) Projections by Country, 2023 to 2033

Figure 129: South Asia and Pacific Market Value (US$ Million) Analysis by Product Type, 2018 to 2033

Figure 130: South Asia and Pacific Market Volume (MT) Analysis by Product Type, 2018 to 2033

Figure 131: South Asia and Pacific Market Value Share (%) and BPS Analysis by Product Type, 2023 to 2033

Figure 132: South Asia and Pacific Market Y-o-Y Growth (%) Projections by Product Type, 2023 to 2033

Figure 133: South Asia and Pacific Market Value (US$ Million) Analysis by Animal Type, 2018 to 2033

Figure 134: South Asia and Pacific Market Volume (MT) Analysis by Animal Type, 2018 to 2033

Figure 135: South Asia and Pacific Market Value Share (%) and BPS Analysis by Animal Type, 2023 to 2033

Figure 136: South Asia and Pacific Market Y-o-Y Growth (%) Projections by Animal Type, 2023 to 2033

Figure 137: South Asia and Pacific Market Value (US$ Million) Analysis by Mode of Delivery, 2018 to 2033

Figure 138: South Asia and Pacific Market Volume (MT) Analysis by Mode of Delivery, 2018 to 2033

Figure 139: South Asia and Pacific Market Value Share (%) and BPS Analysis by Mode of Delivery, 2023 to 2033

Figure 140: South Asia and Pacific Market Y-o-Y Growth (%) Projections by Mode of Delivery, 2023 to 2033

Figure 141: South Asia and Pacific Market Attractiveness by Product Type, 2023 to 2033

Figure 142: South Asia and Pacific Market Attractiveness by Animal Type, 2023 to 2033

Figure 143: South Asia and Pacific Market Attractiveness by Mode of Delivery, 2023 to 2033

Figure 144: South Asia and Pacific Market Attractiveness by Country, 2023 to 2033

Figure 145: East Asia Market Value (US$ Million) by Product Type, 2023 to 2033

Figure 146: East Asia Market Value (US$ Million) by Animal Type, 2023 to 2033

Figure 147: East Asia Market Value (US$ Million) by Mode of Delivery, 2023 to 2033

Figure 148: East Asia Market Value (US$ Million) by Country, 2023 to 2033

Figure 149: East Asia Market Value (US$ Million) Analysis by Country, 2018 to 2033

Figure 150: East Asia Market Volume (MT) Analysis by Country, 2018 to 2033

Figure 151: East Asia Market Value Share (%) and BPS Analysis by Country, 2023 to 2033

Figure 152: East Asia Market Y-o-Y Growth (%) Projections by Country, 2023 to 2033

Figure 153: East Asia Market Value (US$ Million) Analysis by Product Type, 2018 to 2033

Figure 154: East Asia Market Volume (MT) Analysis by Product Type, 2018 to 2033

Figure 155: East Asia Market Value Share (%) and BPS Analysis by Product Type, 2023 to 2033

Figure 156: East Asia Market Y-o-Y Growth (%) Projections by Product Type, 2023 to 2033

Figure 157: East Asia Market Value (US$ Million) Analysis by Animal Type, 2018 to 2033

Figure 158: East Asia Market Volume (MT) Analysis by Animal Type, 2018 to 2033

Figure 159: East Asia Market Value Share (%) and BPS Analysis by Animal Type, 2023 to 2033

Figure 160: East Asia Market Y-o-Y Growth (%) Projections by Animal Type, 2023 to 2033

Figure 161: East Asia Market Value (US$ Million) Analysis by Mode of Delivery, 2018 to 2033

Figure 162: East Asia Market Volume (MT) Analysis by Mode of Delivery, 2018 to 2033

Figure 163: East Asia Market Value Share (%) and BPS Analysis by Mode of Delivery, 2023 to 2033

Figure 164: East Asia Market Y-o-Y Growth (%) Projections by Mode of Delivery, 2023 to 2033

Figure 165: East Asia Market Attractiveness by Product Type, 2023 to 2033

Figure 166: East Asia Market Attractiveness by Animal Type, 2023 to 2033

Figure 167: East Asia Market Attractiveness by Mode of Delivery, 2023 to 2033

Figure 168: East Asia Market Attractiveness by Country, 2023 to 2033

Figure 169: Middle East and Africa Market Value (US$ Million) by Product Type, 2023 to 2033

Figure 170: Middle East and Africa Market Value (US$ Million) by Animal Type, 2023 to 2033

Figure 171: Middle East and Africa Market Value (US$ Million) by Mode of Delivery, 2023 to 2033

Figure 172: Middle East and Africa Market Value (US$ Million) by Country, 2023 to 2033

Figure 173: Middle East and Africa Market Value (US$ Million) Analysis by Country, 2018 to 2033

Figure 174: Middle East and Africa Market Volume (MT) Analysis by Country, 2018 to 2033

Figure 175: Middle East and Africa Market Value Share (%) and BPS Analysis by Country, 2023 to 2033

Figure 176: Middle East and Africa Market Y-o-Y Growth (%) Projections by Country, 2023 to 2033

Figure 177: Middle East and Africa Market Value (US$ Million) Analysis by Product Type, 2018 to 2033

Figure 178: Middle East and Africa Market Volume (MT) Analysis by Product Type, 2018 to 2033

Figure 179: Middle East and Africa Market Value Share (%) and BPS Analysis by Product Type, 2023 to 2033

Figure 180: Middle East and Africa Market Y-o-Y Growth (%) Projections by Product Type, 2023 to 2033

Figure 181: Middle East and Africa Market Value (US$ Million) Analysis by Animal Type, 2018 to 2033

Figure 182: Middle East and Africa Market Volume (MT) Analysis by Animal Type, 2018 to 2033

Figure 183: Middle East and Africa Market Value Share (%) and BPS Analysis by Animal Type, 2023 to 2033

Figure 184: Middle East and Africa Market Y-o-Y Growth (%) Projections by Animal Type, 2023 to 2033

Figure 185: Middle East and Africa Market Value (US$ Million) Analysis by Mode of Delivery, 2018 to 2033

Figure 186: Middle East and Africa Market Volume (MT) Analysis by Mode of Delivery, 2018 to 2033

Figure 187: Middle East and Africa Market Value Share (%) and BPS Analysis by Mode of Delivery, 2023 to 2033

Figure 188: Middle East and Africa Market Y-o-Y Growth (%) Projections by Mode of Delivery, 2023 to 2033

Figure 189: Middle East and Africa Market Attractiveness by Product Type, 2023 to 2033

Figure 190: Middle East and Africa Market Attractiveness by Animal Type, 2023 to 2033

Figure 191: Middle East and Africa Market Attractiveness by Mode of Delivery, 2023 to 2033

Figure 192: Middle East and Africa Market Attractiveness by Country, 2023 to 2033

Frequently Asked Questions

How Big is the Animal Antimicrobials and Antibiotics Market?

The market is valued at USD 4,911.9 million in 2023.

Which are the Top 3 Companies Leading in the Market?

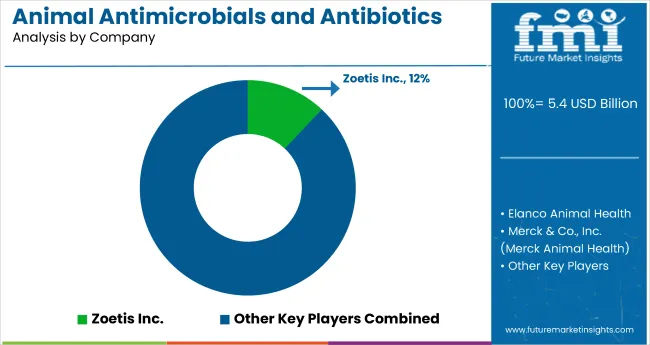
The leading companies in the market are Zoetis, Merck, and Elanco.

Which Industry is the Key Consumer of the Market?

The food industry is the primary consumer of the market.

How Big will the Animal Antimicrobials and Antibiotics Market by 2033?

The market is estimated to reach USD 7,878.2 million by 2033.

What is the Expected Growth Rate for Animal Antimicrobials and Antibiotics Market?

The market is expected to record a CAGR of 4.9% by 2033.

Explore Similar Insights

Future Market Insights

Animal Antimicrobials and Antibiotics Market