Animal Feed Antioxidants Market
Is There Enough Traction in the Animal Feed Antioxidants Market to Scale? FMI Explores Market Trends and Opportunities Governing in the USA, the United Kingdom, Japan, and 30+ Other Countries
Animal Feed Antioxidants Market by Product, Livestock, Form & Region | Forecast 2023 to 2033
Animal Feed Antioxidants Market Outlook (2023 to 2033)
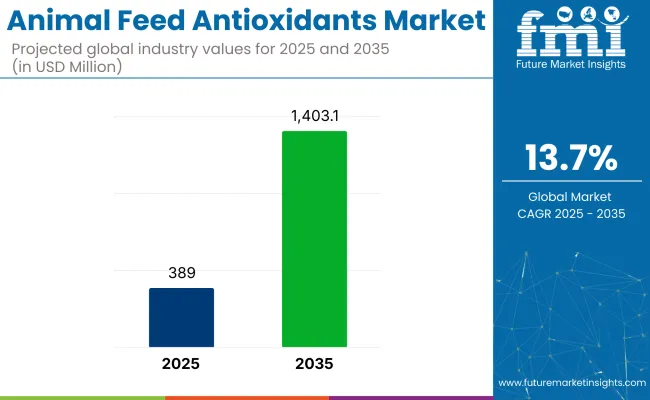
The animal feed antioxidants market is estimated to be around USD 323.61 Million in 2023 and is anticipated to grow to USD 1056.48 Million by 2033, with a CAGR of 12.56% from 2023 to 2033.
It is anticipated that revenue may increase at a consistent CAGR throughout the forecast period due to the sizeable animal feed antioxidants market used in animal feed. Animal feed antioxidants' market revenue development is most likely to be influenced by the three key variables mentioned earlier: improved feed production methods, increased demand for animal feed antioxidants, and rising meat product homogeneity. Concern over animal health and feed safety is one of the main factors boosting demand for animal feed antioxidants. Lack of nutrients in oxidized meals affects animal performance and may result in a number of health issues. Antioxidants may extend the feed's shelf life while preserving its nutritious quality.
Attributes |
Details |
Animal Feed Antioxidants Market CAGR (2023 to 2033) |
12.56% |
Animal Feed Antioxidants Market Size (2023) |
USD 323.61 Million |
Animal Feed Antioxidants Market Size (2033) |
USD 1056.48 Million |
Don't pay for what you don't need
Customize your report by selecting specific countries or regions and save 30%!
Market Front Runners Governing Growth
As people's purchasing power and sense of health increase, they are requesting more foods that are high in protein and nutrients. The consumption of dairy and meat is drastically decreasing worldwide. This accelerates the growth of the animal feed antioxidants market as a whole.
Meat consumption is also increasing yearly, in addition to dairy products. All of the aforementioned factors are anticipated to soon influence the animal feed antioxidants market in question.
Rapid Advancements in Antioxidants to bring New Opportunities
The prevalence of spine flu and pathogenic avian influenza has grown slightly. These viruses have undergone a minor mutation. Some believe that after a mutation, there is a probability for the animal to human transmission. This boosts the animal feed antioxidants market growth on the whole.
Farm owners are utilizing a variety of feed additives to counteract such hazards and to protect animal health at first. The rising industrialization and technological advancements are increasing people's discretionary income. As a result, people are making more rational and healthy decisions, which surges the animal feed antioxidants market adoption trends.
Barriers to the Market Growth
The growth of the animal feed antioxidants market globally is severely constrained by a number of negative factors. The existence of strict government regulations governing the production of antioxidant feeds is one of the main factors anticipated to slow the market growth of animal feed antioxidants.
The deepening of vegan tendencies and the growing vegan population are two important factors that are projected to restrain the growth of the animal feed antioxidants market.
Find your sweet spots for generating winning opportunities in this market.
Talk to AnalystOpportunities in the Market's Perspective
The growth of the animal feed antioxidants market is being driven by rising concerns about animal health and feed safety. Businesses are developing antioxidants to assist boost the nutritional value and shelf life of feeds.
It speeds up the economic boom of the market for animal feed antioxidants as a whole. Increased demand for dairy products is also expected to create profitable prospects for industry participants.
Comparative View of Adjacent Animal Feed Antioxidants Market
Animal Feed Antioxidants Market:
Attributes |
Animal Feed Antioxidants Market |
CAGR (2023 to 2033) |
12.56% |
Animal Feed Antioxidants Market Value (2023) |
USD 323.61 Million |
Growth Factor |
The increased production of meat anticipated as a result of consumers' growing knowledge of the advantages of eating foods high in protein and the availability of domestic cattle is expected to have a substantial impact on the market. |
Opportunity |
The future is expected to bring new opportunities for market players due to the optimistic outlook for agriculture in China, India, and Brazil as a result of regulatory support and domestic innovation of new irrigation technology. |
Key Trends |
Concern over animal health and feed safety is one of the main factors influencing the market demand for antioxidants in animal feed. |
Poultry Feed Market:
Attributes |
Poultry Feed Market |
CAGR (2023 to 2033) |
4.5% |
Animal Feed Antioxidants Market Value (2023) |
USD 219.20 Billion |
Growth Factor |
The increase in poultry farming to meet the expanding demand for chicken meat and eggs around the world is primarily responsible for the increase in demand. |
Opportunity |
Population and income factors have a significant impact on the demand for poultry products. In comparison to conventional poultry feed, packaged chicken feed is predicted to develop faster, opening up new business prospects for industry players. |
Key Trends |
Suppliers are essential to the poultry feed industry as a result of the quality and pricing of feed products emerging as one of the most important market determinants. |
Natural Antioxidants Market:
Attributes |
Natural Antioxidants Market |
CAGR (2023 to 2033) |
6% |
Animal Feed Antioxidants Market Value (2023) |
USD 2.23 Billion |
Growth Factor |
Due to the rising demand for natural antioxidants in food and drink, cosmetics, pharmaceuticals, and animal feed, the market for natural antioxidants is expected to expand globally. |
Opportunity |
Market expansion is projected to be prompted by the rising demand for these antioxidants in the production of high-quality animal feed to encourage cattle growth and lower the incidence of illnesses. |
Key Trends |
Over the course of the forecast period, it is predicted that the global market may be driven by rising demand for fortified food and drinks as a result of the rising propensity for a healthy lifestyle. |
Get the data you need at a Fraction of the cost
Personalize your report by choosing insights you need
and save 40%!
Which Product Segment of Animal Feed Antioxidants Market to Bring in High Revenue Streams?
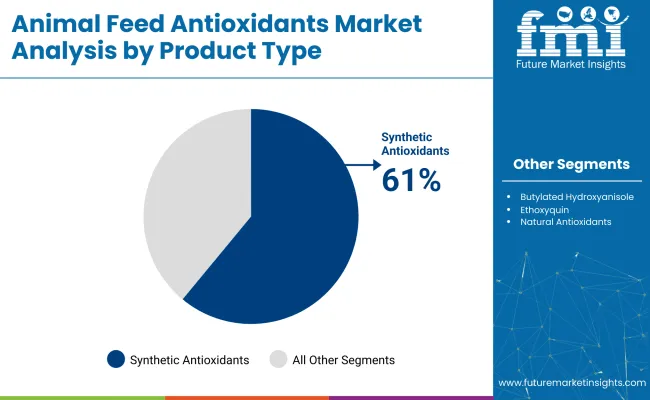
Synthetic antioxidants led the industry in terms of goods, accounting for more than 51% of the global market. These goods are frequently used to protect finished goods or raw materials by providing product stability and longer shelf life.
The number of antioxidants and their inexpensive price are other factors that greatly contribute to the market's growth. Due to the growing need to replace synthetic antioxidants, the market for natural antioxidants is expanding.
Natural animal feed antioxidants are anticipated to grow significantly between 2015 and 2022, with a CAGR of over 4%. Over the forecast period, it is anticipated that the importance of natural products may increase due to regulatory trends toward limiting the use of synthetic chemicals in feed due to growing concerns over their hazardous effects.
Which Form Type Accounts for Highest Sales of Animal Feed Antioxidants?
Based on the form type, it is estimated that the dry category may continue to represent a steady revenue share during the projected period. Farmers who raise cattle are very interested in dry feed antioxidants since they are simple to handle, store, and include in the feed.
Due to the rising demand from multiple end-use applications, the majority of feed antioxidant producers on the market offer feed in dry forms such as powders, pellets, and granules.
Which Livestock Segment is Projected to Boost the Animal Feed Antioxidants Market?
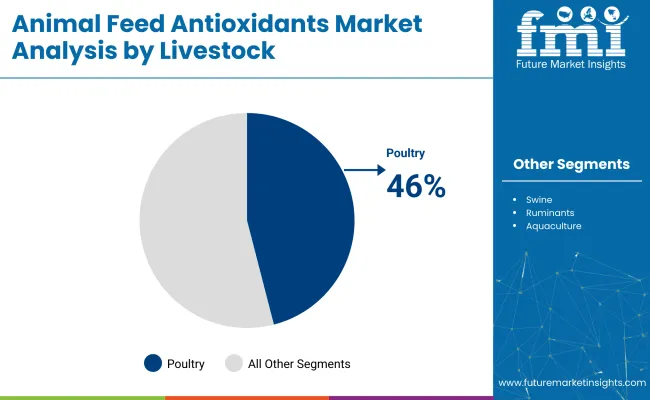
Poultry made up the majority of the global market, and this trend is anticipated to remain throughout the projection period. Due to religious approval, there is expected to be a rise in the consumption of chicken over other meats from swine and cattle species. This may improve livestock penetration and boost market growth.
African governments, especially those in Nigeria and South Africa, have declared the adoption of a business strategy to support domestic chicken production. Therefore, it is anticipated that government involvement may result in greater market penetration.
It is anticipated that there would be an increase in demand for antioxidants in animal feed for cattle due to increased concerns over disease outbreaks like BSE in bovine species. The poultry and cattle dairy industries are expected to grow the fastest. This increase in demand for high-protein meals is attributable to greater consumer health awareness.
Regional Outlook
Why are Animal Feed Antioxidants Suppliers Focusing on the Asia Pacific?
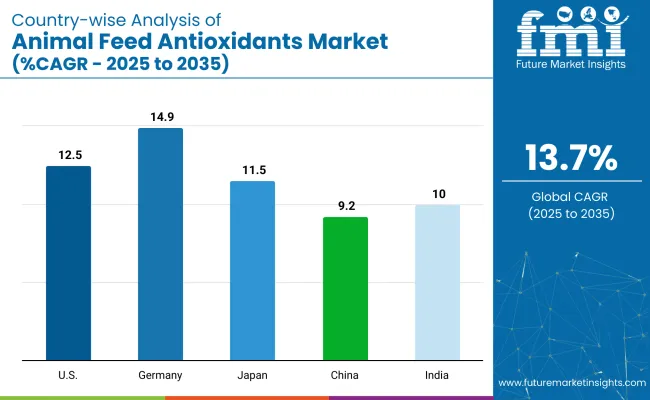
Asia Pacific is expected to offer attractive growth opportunities. This rise is due to the rising economies of developing countries, which have increased people's disposable income and, as a result, their need for nutritious food.
One of the reasons this market is growing is that there is a rising demand for dairy products and meat due to the enormous population density on the Asian continent. The majority of meat eaters are concentrated in China. Most Asian people consume pork, shellfish, and poultry including chicken and turkey.
Seafood, such as tuna, salmon, and shrimp, can be found in almost every home in Japan, and Indonesia. Meat producers are using cutting-edge methods that use feed antioxidants to ensure the quality of the meat and stop the spread of disease in order to meet this enormous demand.
Why are Sales of Animal Feed Antioxidants Products Higher in North America?
Over the projected period, North America is anticipated to continue to be one of the top markets.
High demand for these chemicals is anticipated as a result of the USA's strong meat manufacturing base, which mostly consists of JBF, Tyson, Cargill, and National Beef. Rising red meat consumption in Mexico is anticipated to have a positive effect due to the expansion of stores that deliver frozen meals.
The solid hog meat manufacturing base in European countries such as Germany, France, and Russia is predicted to improve livestock availability. As a result, industry growth during the next seven years.
How is the Start-up Ecosystem in the Animal Feed Antioxidants Market?
- InnovaFeed - Creator of aquaculture feeds based on insects
Insect farming is one of the company's activities. Insect larvae are used to transform inexpensive agri-food feedstock into aquaculture feed items. The business raises fly insects called Hermetia illucens in their facility.
Today, a company that is a pioneer in producing insects (Hermetia illucens) for animal and plant nutrition revealed that it has secured US$ 250 Million in Series D funding. ADM, Cargill, Future French Champions, ABC Impact, IDIA Capital Investissement, and Grow Forward are among the new strategic and financial investors in the round led by the Qatar Investment Authority (QIA), which also includes existing investors Creadev and Temasek. Both companies have strategic partnerships with Innovafeed.
- Deep Branch - Supplier of carbon-to-protein conversion systems.
In order to produce a proton, it uses a method that uses CO2 from industrial emissions. Its biological carbon recycling system, which turns carbon dioxide into high-value goods, assists businesses in lowering their carbon footprints without adversely affecting operational expenses.
The United Kingdom government's Department for Business, Energy & Industrial Strategy's £4.8 Million Net Zero Innovation Portfolio has granted funding to Deep Branch.
As the company commercializes its CO2-to-protein technology platform, the cash may be utilized to fund the Deep Blue C project, fostering faster company growth.
How Competition Influences the Animal Feed Antioxidants Market?
Players in the animal feed antioxidants market primarily employ product launches, mergers and acquisitions, joint ventures, and geographic expansions.
Manufacturers of the animal feed antioxidants market should increase their investment in the development of natural antioxidants like tocopherols as consumer preference shifts away from synthetic chemicals and toward bio-based alternatives due to fluctuating petrochemical feedstock prices.
Recent Development:
Date | November 2021 |
Plan | Purchase |
Company | Synergia Life Sciences |
Details | The Danish biotechnology business Novozymes may buy the Indian pharmaceutical company Synergia Life Sciences in November 2021. Synergia is well-known for producing probiotics and natural Vitamin K2-7. Novozymes completes the transaction with a $150 Mn payment. Novozymes' functional food division may benefit from the acquisition. |
Date | August 2021 |
Plan | Acquisition |
Company | Sanderson farms |
Details | Two food firms agreed to buy the USA-based company Sanderson farms in August 2021. The first is Cargill, Inc. of Minnesota, while the second is Continental Grain Company of Belgium. In order to consummate the acquisition, both companies agreed to pay Sanderson a total of $4.53 Billion, or $203 per share. |
Date | November 2020 |
Plan | Acquisition |
Company | FRAmelco Group |
Details | The successful acquisition of the feed additive company FRAmelco Group from the Netherlands was announced by China-based Bluestar Adisseo, also known as Adisseo, in November 2020. Adisseo made the acquisition primarily to fuel its ambition to control the animal additives market. The business operates three facilities, one each in Thailand, Spain, and the Netherlands. The company also brings in close to 30 Million pounds annually. |
Key Players
Key Segments
By Product:
- Natural
- Synthetic
By Livestock:
- Swine
- Cattle
- Poultry
- Aquaculture
By Form:
- Dry
- Liquid
By Region:
- North America
- Europe
- Asia Pacific
- Latin America
- Middle East and Africa(MEA)
Frequently Asked Questions
How is the Animal Feed Antioxidants Market Growing?
The animal feed antioxidants market is predicted to grow at a CAGR of 12.56% through 2033.
Which Region Holds the Highest Revenue Potential in the Animal Feed Antioxidants Market?
Asia Pacific's animal feed antioxidants market holds the highest revenue potential.
What is the Current Animal Feed Antioxidants Market Size?
The animal feed antioxidants market size is anticipated to be over US$ 323.61 Million in 2023.
What is the Future Scope of Growth for the Animal Feed Antioxidants Market?
The animal feed antioxidants market is expected to surpass US$ 1056.48 Million by 2033.
Table of Content
1. Executive Summary | Animal Feed Antioxidants Market 1.1. Global Market Outlook 1.2. Demand-side Trends 1.3. Supply-side Trends 1.4. Technology Roadmap Analysis 1.5. Analysis and Recommendations 2. Market Overview 2.1. Market Coverage / Taxonomy 2.2. Market Definition / Scope / Limitations 3. Market Background 3.1. Market Dynamics 3.1.1. Drivers 3.1.2. Restraints 3.1.3. Opportunity 3.1.4. Trends 3.2. Scenario Forecast 3.2.1. Demand in Optimistic Scenario 3.2.2. Demand in Likely Scenario 3.2.3. Demand in Conservative Scenario 3.3. Opportunity Map Analysis 3.4. Product Life Cycle Analysis 3.5. Supply Chain Analysis 3.5.1. Supply Side Participants and their Roles 3.5.1.1. Producers 3.5.1.2. Mid-Level Participants (Traders/ Agents/ Brokers) 3.5.1.3. Wholesalers and Distributors 3.5.2. Value Added and Value Created at Node in the Supply Chain 3.5.3. List of Raw Material Suppliers 3.5.4. List of Existing and Potential Buyers 3.6. Investment Feasibility Matrix 3.7. Value Chain Analysis 3.7.1. Profit Margin Analysis 3.7.2. Wholesalers and Distributors 3.7.3. Retailers 3.8. PESTLE and Porter’s Analysis 3.9. Regulatory Landscape 3.9.1. By Key Regions 3.9.2. By Key Countries 3.10. Regional Parent Market Outlook 3.11. Production and Consumption Statistics 3.12. Import and Export Statistics 4. Global Market Analysis 2018 to 2022 and Forecast, 2023 to 2033 4.1. Historical Market Size Value (US$ Million) & Volume (Tons) Analysis, 2018 to 2022 4.2. Current and Future Market Size Value (US$ Million) & Volume (Tons) Projections, 2023 to 2033 4.2.1. Y-o-Y Growth Trend Analysis 4.2.2. Absolute $ Opportunity Analysis 5. Global Market Analysis 2018 to 2022 and Forecast 2023 to 2033, By Product 5.1. Introduction / Key Findings 5.2. Historical Market Size Value (US$ Million) & Volume (Tons) Analysis By Product, 2018 to 2022 5.3. Current and Future Market Size Value (US$ Million) & Volume (Tons) Analysis and Forecast By Product, 2023 to 2033 5.3.1. Natural Antioxidants 5.3.2. Synthetic Antioxidants 5.3.2.1. Ethoxyquin 5.3.2.2. Butylated Hydroxyanisole - BHA 5.3.2.3. Butylated Hydroxytoluene - BHT 5.4. Y-o-Y Growth Trend Analysis By Product, 2018 to 2022 5.5. Absolute $ Opportunity Analysis By Product, 2023 to 2033 6. Global Market Analysis 2018 to 2022 and Forecast 2023 to 2033, By Livestock 6.1. Introduction / Key Findings 6.2. Historical Market Size Value (US$ Million) & Volume (Tons) Analysis By Livestock, 2018 to 2022 6.3. Current and Future Market Size Value (US$ Million) & Volume (Tons) Analysis and Forecast By Livestock, 2023 to 2033 6.3.1. Swine 6.3.2. Poultry 6.3.3. Cattle 6.3.4. Aquaculture 6.3.5. Others 6.4. Y-o-Y Growth Trend Analysis By Livestock, 2018 to 2022 6.5. Absolute $ Opportunity Analysis By Livestock, 2023 to 2033 7. Global Market Analysis 2018 to 2022 and Forecast 2023 to 2033, By Region 7.1. Introduction 7.2. Historical Market Size Value (US$ Million) & Volume (Tons) Analysis By Region, 2018 to 2022 7.3. Current Market Size Value (US$ Million) & Volume (Tons) Analysis and Forecast By Region, 2023 to 2033 7.3.1. North America 7.3.2. Latin America 7.3.3. Europe 7.3.4. Asia Pacific 7.3.5. Middle East and Africa(MEA) 7.4. Market Attractiveness Analysis By Region 8. North America Market Analysis 2018 to 2022 and Forecast 2023 to 2033, By Country 8.1. Historical Market Size Value (US$ Million) & Volume (Tons) Trend Analysis By Market Taxonomy, 2018 to 2022 8.2. Market Size Value (US$ Million) & Volume (Tons) Forecast By Market Taxonomy, 2023 to 2033 8.2.1. By Country 8.2.1.1. USA 8.2.1.2. Canada 8.2.2. By Product 8.2.3. By Livestock 8.3. Market Attractiveness Analysis 8.3.1. By Country 8.3.2. By Product 8.3.3. By Livestock 8.4. Key Takeaways 9. Latin America Market Analysis 2018 to 2022 and Forecast 2023 to 2033, By Country 9.1. Historical Market Size Value (US$ Million) & Volume (Tons) Trend Analysis By Market Taxonomy, 2018 to 2022 9.2. Market Size Value (US$ Million) & Volume (Tons) Forecast By Market Taxonomy, 2023 to 2033 9.2.1. By Country 9.2.1.1. Brazil 9.2.1.2. Mexico 9.2.1.3. Rest of Latin America 9.2.2. By Product 9.2.3. By Livestock 9.3. Market Attractiveness Analysis 9.3.1. By Country 9.3.2. By Product 9.3.3. By Livestock 9.4. Key Takeaways 10. Europe Market Analysis 2018 to 2022 and Forecast 2023 to 2033, By Country 10.1. Historical Market Size Value (US$ Million) & Volume (Tons) Trend Analysis By Market Taxonomy, 2018 to 2022 10.2. Market Size Value (US$ Million) & Volume (Tons) Forecast By Market Taxonomy, 2023 to 2033 10.2.1. By Country 10.2.1.1. Germany 10.2.1.2. United Kingdom 10.2.1.3. France 10.2.1.4. Spain 10.2.1.5. Italy 10.2.1.6. Rest of Europe 10.2.2. By Product 10.2.3. By Livestock 10.3. Market Attractiveness Analysis 10.3.1. By Country 10.3.2. By Product 10.3.3. By Livestock 10.4. Key Takeaways 11. Asia Pacific Market Analysis 2018 to 2022 and Forecast 2023 to 2033, By Country 11.1. Historical Market Size Value (US$ Million) & Volume (Tons) Trend Analysis By Market Taxonomy, 2018 to 2022 11.2. Market Size Value (US$ Million) & Volume (Tons) Forecast By Market Taxonomy, 2023 to 2033 11.2.1. By Country 11.2.1.1. China 11.2.1.2. Japan 11.2.1.3. South Korea 11.2.1.4. Singapore 11.2.1.5. Thailand 11.2.1.6. Indonesia 11.2.1.7. Australia 11.2.1.8. New Zealand 11.2.1.9. Rest of Asia Pacific 11.2.2. By Product 11.2.3. By Livestock 11.3. Market Attractiveness Analysis 11.3.1. By Country 11.3.2. By Product 11.3.3. By Livestock 11.4. Key Takeaways 12. MEA Market Analysis 2018 to 2022 and Forecast 2023 to 2033, By Country 12.1. Historical Market Size Value (US$ Million) & Volume (Tons) Trend Analysis By Market Taxonomy, 2018 to 2022 12.2. Market Size Value (US$ Million) & Volume (Tons) Forecast By Market Taxonomy, 2023 to 2033 12.2.1. By Country 12.2.1.1. GCC Countries 12.2.1.2. South Africa 12.2.1.3. Israel 12.2.1.4. Rest of Middle East and Africa(MEA) 12.2.2. By Product 12.2.3. By Livestock 12.3. Market Attractiveness Analysis 12.3.1. By Country 12.3.2. By Product 12.3.3. By Livestock 12.4. Key Takeaways 13. Key Countries Market Analysis 13.1. USA 13.1.1. Pricing Analysis 13.1.2. Market Share Analysis, 2022 13.1.2.1. By Product 13.1.2.2. By Livestock 13.2. Canada 13.2.1. Pricing Analysis 13.2.2. Market Share Analysis, 2022 13.2.2.1. By Product 13.2.2.2. By Livestock 13.3. Brazil 13.3.1. Pricing Analysis 13.3.2. Market Share Analysis, 2022 13.3.2.1. By Product 13.3.2.2. By Livestock 13.4. Mexico 13.4.1. Pricing Analysis 13.4.2. Market Share Analysis, 2022 13.4.2.1. By Product 13.4.2.2. By Livestock 13.5. Germany 13.5.1. Pricing Analysis 13.5.2. Market Share Analysis, 2022 13.5.2.1. By Product 13.5.2.2. By Livestock 13.6. United Kingdom 13.6.1. Pricing Analysis 13.6.2. Market Share Analysis, 2022 13.6.2.1. By Product 13.6.2.2. By Livestock 13.7. France 13.7.1. Pricing Analysis 13.7.2. Market Share Analysis, 2022 13.7.2.1. By Product 13.7.2.2. By Livestock 13.8. Spain 13.8.1. Pricing Analysis 13.8.2. Market Share Analysis, 2022 13.8.2.1. By Product 13.8.2.2. By Livestock 13.9. Italy 13.9.1. Pricing Analysis 13.9.2. Market Share Analysis, 2022 13.9.2.1. By Product 13.9.2.2. By Livestock 13.10. China 13.10.1. Pricing Analysis 13.10.2. Market Share Analysis, 2022 13.10.2.1. By Product 13.10.2.2. By Livestock 13.11. Japan 13.11.1. Pricing Analysis 13.11.2. Market Share Analysis, 2022 13.11.2.1. By Product 13.11.2.2. By Livestock 13.12. South Korea 13.12.1. Pricing Analysis 13.12.2. Market Share Analysis, 2022 13.12.2.1. By Product 13.12.2.2. By Livestock 13.13. Singapore 13.13.1. Pricing Analysis 13.13.2. Market Share Analysis, 2022 13.13.2.1. By Product 13.13.2.2. By Livestock 13.14. Thailand 13.14.1. Pricing Analysis 13.14.2. Market Share Analysis, 2022 13.14.2.1. By Product 13.14.2.2. By Livestock 13.15. Indonesia 13.15.1. Pricing Analysis 13.15.2. Market Share Analysis, 2022 13.15.2.1. By Product 13.15.2.2. By Livestock 13.16. Australia 13.16.1. Pricing Analysis 13.16.2. Market Share Analysis, 2022 13.16.2.1. By Product 13.16.2.2. By Livestock 13.17. New Zealand 13.17.1. Pricing Analysis 13.17.2. Market Share Analysis, 2022 13.17.2.1. By Product 13.17.2.2. By Livestock 13.18. GCC Countries 13.18.1. Pricing Analysis 13.18.2. Market Share Analysis, 2022 13.18.2.1. By Product 13.18.2.2. By Livestock 13.19. South Africa 13.19.1. Pricing Analysis 13.19.2. Market Share Analysis, 2022 13.19.2.1. By Product 13.19.2.2. By Livestock 13.20. Israel 13.20.1. Pricing Analysis 13.20.2. Market Share Analysis, 2022 13.20.2.1. By Product 13.20.2.2. By Livestock 14. Market Structure Analysis 14.1. Competition Dashboard 14.2. Competition Benchmarking 14.3. Market Share Analysis of Top Players 14.3.1. By Regional 14.3.2. By Product 14.3.3. By Livestock 15. Competition Analysis 15.1. Competition Deep Dive 15.1.1. BASF 15.1.1.1. Overview 15.1.1.2. Product Portfolio 15.1.1.3. Profitability by Market Segments 15.1.1.4. Sales Footprint 15.1.1.5. Strategy Overview 15.1.1.5.1. Marketing Strategy 15.1.1.5.2. Product Strategy 15.1.1.5.3. Channel Strategy 15.1.2. ADM 15.1.2.1. Overview 15.1.2.2. Product Portfolio 15.1.2.3. Profitability by Market Segments 15.1.2.4. Sales Footprint 15.1.2.5. Strategy Overview 15.1.2.5.1. Marketing Strategy 15.1.2.5.2. Product Strategy 15.1.2.5.3. Channel Strategy 15.1.3. DuPont 15.1.3.1. Overview 15.1.3.2. Product Portfolio 15.1.3.3. Profitability by Market Segments 15.1.3.4. Sales Footprint 15.1.3.5. Strategy Overview 15.1.3.5.1. Marketing Strategy 15.1.3.5.2. Product Strategy 15.1.3.5.3. Channel Strategy 15.1.4. DSM Nutritional Product, LLC 15.1.4.1. Overview 15.1.4.2. Product Portfolio 15.1.4.3. Profitability by Market Segments 15.1.4.4. Sales Footprint 15.1.4.5. Strategy Overview 15.1.4.5.1. Marketing Strategy 15.1.4.5.2. Product Strategy 15.1.4.5.3. Channel Strategy 15.1.5. Cargill Inc. 15.1.5.1. Overview 15.1.5.2. Product Portfolio 15.1.5.3. Profitability by Market Segments 15.1.5.4. Sales Footprint 15.1.5.5. Strategy Overview 15.1.5.5.1. Marketing Strategy 15.1.5.5.2. Product Strategy 15.1.5.5.3. Channel Strategy 15.1.6. Zhejiang Medicine Co., Ltd. 15.1.6.1. Overview 15.1.6.2. Product Portfolio 15.1.6.3. Profitability by Market Segments 15.1.6.4. Sales Footprint 15.1.6.5. Strategy Overview 15.1.6.5.1. Marketing Strategy 15.1.6.5.2. Product Strategy 15.1.6.5.3. Channel Strategy 15.1.7. Adisseo 15.1.7.1. Overview 15.1.7.2. Product Portfolio 15.1.7.3. Profitability by Market Segments 15.1.7.4. Sales Footprint 15.1.7.5. Strategy Overview 15.1.7.5.1. Marketing Strategy 15.1.7.5.2. Product Strategy 15.1.7.5.3. Channel Strategy 15.1.8. Novozymes 15.1.8.1. Overview 15.1.8.2. Product Portfolio 15.1.8.3. Profitability by Market Segments 15.1.8.4. Sales Footprint 15.1.8.5. Strategy Overview 15.1.8.5.1. Marketing Strategy 15.1.8.5.2. Product Strategy 15.1.8.5.3. Channel Strategy 15.1.9. Alltech 15.1.9.1. Overview 15.1.9.2. Product Portfolio 15.1.9.3. Profitability by Market Segments 15.1.9.4. Sales Footprint 15.1.9.5. Strategy Overview 15.1.9.5.1. Marketing Strategy 15.1.9.5.2. Product Strategy 15.1.9.5.3. Channel Strategy 15.1.10. Beldem 15.1.10.1. Overview 15.1.10.2. Product Portfolio 15.1.10.3. Profitability by Market Segments 15.1.10.4. Sales Footprint 15.1.10.5. Strategy Overview 15.1.10.5.1. Marketing Strategy 15.1.10.5.2. Product Strategy 15.1.10.5.3. Channel Strategy 15.1.11. Kemin Industries, Inc. 15.1.11.1. Overview 15.1.11.2. Product Portfolio 15.1.11.3. Profitability by Market Segments 15.1.11.4. Sales Footprint 15.1.11.5. Strategy Overview 15.1.11.5.1. Marketing Strategy 15.1.11.5.2. Product Strategy 15.1.11.5.3. Channel Strategy 15.1.12. AB Vista 15.1.12.1. Overview 15.1.12.2. Product Portfolio 15.1.12.3. Profitability by Market Segments 15.1.12.4. Sales Footprint 15.1.12.5. Strategy Overview 15.1.12.5.1. Marketing Strategy 15.1.12.5.2. Product Strategy 15.1.12.5.3. Channel Strategy 16. Assumptions & Acronyms Used 17. Research Methodology
Don't pay for what you don't need
Customize your report by selecting specific countries or regions and save 30%!
List of Tables
Table 1: Global Market Value (US$ Million) Forecast by Region, 2018 to 2033 Table 2: Global Market Volume (Tons) Forecast by Region, 2018 to 2033 Table 3: Global Market Value (US$ Million) Forecast by Product, 2018 to 2033 Table 4: Global Market Volume (Tons) Forecast by Product, 2018 to 2033 Table 5: Global Market Value (US$ Million) Forecast by Livestock, 2018 to 2033 Table 6: Global Market Volume (Tons) Forecast by Livestock, 2018 to 2033 Table 7: North America Market Value (US$ Million) Forecast by Country, 2018 to 2033 Table 8: North America Market Volume (Tons) Forecast by Country, 2018 to 2033 Table 9: North America Market Value (US$ Million) Forecast by Product, 2018 to 2033 Table 10: North America Market Volume (Tons) Forecast by Product, 2018 to 2033 Table 11: North America Market Value (US$ Million) Forecast by Livestock, 2018 to 2033 Table 12: North America Market Volume (Tons) Forecast by Livestock, 2018 to 2033 Table 13: Latin America Market Value (US$ Million) Forecast by Country, 2018 to 2033 Table 14: Latin America Market Volume (Tons) Forecast by Country, 2018 to 2033 Table 15: Latin America Market Value (US$ Million) Forecast by Product, 2018 to 2033 Table 16: Latin America Market Volume (Tons) Forecast by Product, 2018 to 2033 Table 17: Latin America Market Value (US$ Million) Forecast by Livestock, 2018 to 2033 Table 18: Latin America Market Volume (Tons) Forecast by Livestock, 2018 to 2033 Table 19: Europe Market Value (US$ Million) Forecast by Country, 2018 to 2033 Table 20: Europe Market Volume (Tons) Forecast by Country, 2018 to 2033 Table 21: Europe Market Value (US$ Million) Forecast by Product, 2018 to 2033 Table 22: Europe Market Volume (Tons) Forecast by Product, 2018 to 2033 Table 23: Europe Market Value (US$ Million) Forecast by Livestock, 2018 to 2033 Table 24: Europe Market Volume (Tons) Forecast by Livestock, 2018 to 2033 Table 25: Asia Pacific Market Value (US$ Million) Forecast by Country, 2018 to 2033 Table 26: Asia Pacific Market Volume (Tons) Forecast by Country, 2018 to 2033 Table 27: Asia Pacific Market Value (US$ Million) Forecast by Product, 2018 to 2033 Table 28: Asia Pacific Market Volume (Tons) Forecast by Product, 2018 to 2033 Table 29: Asia Pacific Market Value (US$ Million) Forecast by Livestock, 2018 to 2033 Table 30: Asia Pacific Market Volume (Tons) Forecast by Livestock, 2018 to 2033 Table 31: MEA Market Value (US$ Million) Forecast by Country, 2018 to 2033 Table 32: MEA Market Volume (Tons) Forecast by Country, 2018 to 2033 Table 33: MEA Market Value (US$ Million) Forecast by Product, 2018 to 2033 Table 34: MEA Market Volume (Tons) Forecast by Product, 2018 to 2033 Table 35: MEA Market Value (US$ Million) Forecast by Livestock, 2018 to 2033 Table 36: MEA Market Volume (Tons) Forecast by Livestock, 2018 to 2033
Find your sweet spots for generating winning opportunities in this market.
Talk to AnalystList of Charts
Figure 1: Global Market Value (US$ Million) by Product, 2023 to 2033 Figure 2: Global Market Value (US$ Million) by Livestock, 2023 to 2033 Figure 3: Global Market Value (US$ Million) by Region, 2023 to 2033 Figure 4: Global Market Value (US$ Million) Analysis by Region, 2018 to 2033 Figure 5: Global Market Volume (Tons) Analysis by Region, 2018 to 2033 Figure 6: Global Market Value Share (%) and BPS Analysis by Region, 2023 to 2033 Figure 7: Global Market Y-o-Y Growth (%) Projections by Region, 2023 to 2033 Figure 8: Global Market Value (US$ Million) Analysis by Product, 2018 to 2033 Figure 9: Global Market Volume (Tons) Analysis by Product, 2018 to 2033 Figure 10: Global Market Value Share (%) and BPS Analysis by Product, 2023 to 2033 Figure 11: Global Market Y-o-Y Growth (%) Projections by Product, 2023 to 2033 Figure 12: Global Market Value (US$ Million) Analysis by Livestock, 2018 to 2033 Figure 13: Global Market Volume (Tons) Analysis by Livestock, 2018 to 2033 Figure 14: Global Market Value Share (%) and BPS Analysis by Livestock, 2023 to 2033 Figure 15: Global Market Y-o-Y Growth (%) Projections by Livestock, 2023 to 2033 Figure 16: Global Market Attractiveness by Product, 2023 to 2033 Figure 17: Global Market Attractiveness by Livestock, 2023 to 2033 Figure 18: Global Market Attractiveness by Region, 2023 to 2033 Figure 19: North America Market Value (US$ Million) by Product, 2023 to 2033 Figure 20: North America Market Value (US$ Million) by Livestock, 2023 to 2033 Figure 21: North America Market Value (US$ Million) by Country, 2023 to 2033 Figure 22: North America Market Value (US$ Million) Analysis by Country, 2018 to 2033 Figure 23: North America Market Volume (Tons) Analysis by Country, 2018 to 2033 Figure 24: North America Market Value Share (%) and BPS Analysis by Country, 2023 to 2033 Figure 25: North America Market Y-o-Y Growth (%) Projections by Country, 2023 to 2033 Figure 26: North America Market Value (US$ Million) Analysis by Product, 2018 to 2033 Figure 27: North America Market Volume (Tons) Analysis by Product, 2018 to 2033 Figure 28: North America Market Value Share (%) and BPS Analysis by Product, 2023 to 2033 Figure 29: North America Market Y-o-Y Growth (%) Projections by Product, 2023 to 2033 Figure 30: North America Market Value (US$ Million) Analysis by Livestock, 2018 to 2033 Figure 31: North America Market Volume (Tons) Analysis by Livestock, 2018 to 2033 Figure 32: North America Market Value Share (%) and BPS Analysis by Livestock, 2023 to 2033 Figure 33: North America Market Y-o-Y Growth (%) Projections by Livestock, 2023 to 2033 Figure 34: North America Market Attractiveness by Product, 2023 to 2033 Figure 35: North America Market Attractiveness by Livestock, 2023 to 2033 Figure 36: North America Market Attractiveness by Country, 2023 to 2033 Figure 37: Latin America Market Value (US$ Million) by Product, 2023 to 2033 Figure 38: Latin America Market Value (US$ Million) by Livestock, 2023 to 2033 Figure 39: Latin America Market Value (US$ Million) by Country, 2023 to 2033 Figure 40: Latin America Market Value (US$ Million) Analysis by Country, 2018 to 2033 Figure 41: Latin America Market Volume (Tons) Analysis by Country, 2018 to 2033 Figure 42: Latin America Market Value Share (%) and BPS Analysis by Country, 2023 to 2033 Figure 43: Latin America Market Y-o-Y Growth (%) Projections by Country, 2023 to 2033 Figure 44: Latin America Market Value (US$ Million) Analysis by Product, 2018 to 2033 Figure 45: Latin America Market Volume (Tons) Analysis by Product, 2018 to 2033 Figure 46: Latin America Market Value Share (%) and BPS Analysis by Product, 2023 to 2033 Figure 47: Latin America Market Y-o-Y Growth (%) Projections by Product, 2023 to 2033 Figure 48: Latin America Market Value (US$ Million) Analysis by Livestock, 2018 to 2033 Figure 49: Latin America Market Volume (Tons) Analysis by Livestock, 2018 to 2033 Figure 50: Latin America Market Value Share (%) and BPS Analysis by Livestock, 2023 to 2033 Figure 51: Latin America Market Y-o-Y Growth (%) Projections by Livestock, 2023 to 2033 Figure 52: Latin America Market Attractiveness by Product, 2023 to 2033 Figure 53: Latin America Market Attractiveness by Livestock, 2023 to 2033 Figure 54: Latin America Market Attractiveness by Country, 2023 to 2033 Figure 55: Europe Market Value (US$ Million) by Product, 2023 to 2033 Figure 56: Europe Market Value (US$ Million) by Livestock, 2023 to 2033 Figure 57: Europe Market Value (US$ Million) by Country, 2023 to 2033 Figure 58: Europe Market Value (US$ Million) Analysis by Country, 2018 to 2033 Figure 59: Europe Market Volume (Tons) Analysis by Country, 2018 to 2033 Figure 60: Europe Market Value Share (%) and BPS Analysis by Country, 2023 to 2033 Figure 61: Europe Market Y-o-Y Growth (%) Projections by Country, 2023 to 2033 Figure 62: Europe Market Value (US$ Million) Analysis by Product, 2018 to 2033 Figure 63: Europe Market Volume (Tons) Analysis by Product, 2018 to 2033 Figure 64: Europe Market Value Share (%) and BPS Analysis by Product, 2023 to 2033 Figure 65: Europe Market Y-o-Y Growth (%) Projections by Product, 2023 to 2033 Figure 66: Europe Market Value (US$ Million) Analysis by Livestock, 2018 to 2033 Figure 67: Europe Market Volume (Tons) Analysis by Livestock, 2018 to 2033 Figure 68: Europe Market Value Share (%) and BPS Analysis by Livestock, 2023 to 2033 Figure 69: Europe Market Y-o-Y Growth (%) Projections by Livestock, 2023 to 2033 Figure 70: Europe Market Attractiveness by Product, 2023 to 2033 Figure 71: Europe Market Attractiveness by Livestock, 2023 to 2033 Figure 72: Europe Market Attractiveness by Country, 2023 to 2033 Figure 73: Asia Pacific Market Value (US$ Million) by Product, 2023 to 2033 Figure 74: Asia Pacific Market Value (US$ Million) by Livestock, 2023 to 2033 Figure 75: Asia Pacific Market Value (US$ Million) by Country, 2023 to 2033 Figure 76: Asia Pacific Market Value (US$ Million) Analysis by Country, 2018 to 2033 Figure 77: Asia Pacific Market Volume (Tons) Analysis by Country, 2018 to 2033 Figure 78: Asia Pacific Market Value Share (%) and BPS Analysis by Country, 2023 to 2033 Figure 79: Asia Pacific Market Y-o-Y Growth (%) Projections by Country, 2023 to 2033 Figure 80: Asia Pacific Market Value (US$ Million) Analysis by Product, 2018 to 2033 Figure 81: Asia Pacific Market Volume (Tons) Analysis by Product, 2018 to 2033 Figure 82: Asia Pacific Market Value Share (%) and BPS Analysis by Product, 2023 to 2033 Figure 83: Asia Pacific Market Y-o-Y Growth (%) Projections by Product, 2023 to 2033 Figure 84: Asia Pacific Market Value (US$ Million) Analysis by Livestock, 2018 to 2033 Figure 85: Asia Pacific Market Volume (Tons) Analysis by Livestock, 2018 to 2033 Figure 86: Asia Pacific Market Value Share (%) and BPS Analysis by Livestock, 2023 to 2033 Figure 87: Asia Pacific Market Y-o-Y Growth (%) Projections by Livestock, 2023 to 2033 Figure 88: Asia Pacific Market Attractiveness by Product, 2023 to 2033 Figure 89: Asia Pacific Market Attractiveness by Livestock, 2023 to 2033 Figure 90: Asia Pacific Market Attractiveness by Country, 2023 to 2033 Figure 91: MEA Market Value (US$ Million) by Product, 2023 to 2033 Figure 92: MEA Market Value (US$ Million) by Livestock, 2023 to 2033 Figure 93: MEA Market Value (US$ Million) by Country, 2023 to 2033 Figure 94: MEA Market Value (US$ Million) Analysis by Country, 2018 to 2033 Figure 95: MEA Market Volume (Tons) Analysis by Country, 2018 to 2033 Figure 96: MEA Market Value Share (%) and BPS Analysis by Country, 2023 to 2033 Figure 97: MEA Market Y-o-Y Growth (%) Projections by Country, 2023 to 2033 Figure 98: MEA Market Value (US$ Million) Analysis by Product, 2018 to 2033 Figure 99: MEA Market Volume (Tons) Analysis by Product, 2018 to 2033 Figure 100: MEA Market Value Share (%) and BPS Analysis by Product, 2023 to 2033 Figure 101: MEA Market Y-o-Y Growth (%) Projections by Product, 2023 to 2033 Figure 102: MEA Market Value (US$ Million) Analysis by Livestock, 2018 to 2033 Figure 103: MEA Market Volume (Tons) Analysis by Livestock, 2018 to 2033 Figure 104: MEA Market Value Share (%) and BPS Analysis by Livestock, 2023 to 2033 Figure 105: MEA Market Y-o-Y Growth (%) Projections by Livestock, 2023 to 2033 Figure 106: MEA Market Attractiveness by Product, 2023 to 2033 Figure 107: MEA Market Attractiveness by Livestock, 2023 to 2033 Figure 108: MEA Market Attractiveness by Country, 2023 to 2033
Recommendations
Explore Food and Beverage Insights
View Reports