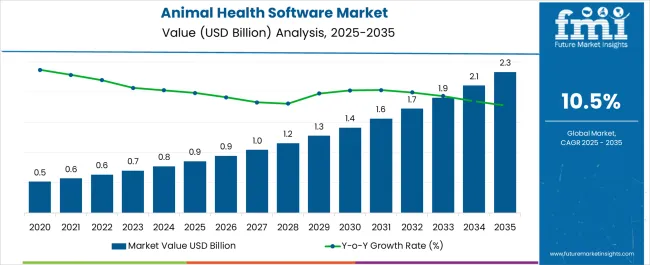
The Animal Health Software Market is estimated to be valued at USD 0.9 billion in 2025 and is projected to reach USD 2.3 billion by 2035, registering a compound annual growth rate (CAGR) of 10.6% over the forecast period.
| Metric | Value |
|---|---|
| Animal Health Software Market Estimated Value in (2025 E) | USD 0.9 billion |
| Animal Health Software Market Forecast Value in (2035 F) | USD 2.3 billion |
| Forecast CAGR (2025 to 2035) | 10.6% |
The animal health software market is experiencing steady expansion, driven by the increasing adoption of digital tools in veterinary practices and the rising emphasis on animal health management. Industry updates and company announcements have highlighted that veterinary clinics and hospitals are integrating software solutions to streamline clinical workflows, manage patient data, and improve client communication.
The shift towards preventive healthcare and the growing companion animal population have created consistent demand for advanced data-driven platforms. Furthermore, government initiatives supporting animal health surveillance and technological investments by veterinary service providers have accelerated market penetration.
Cloud-enabled platforms, offering scalability and cost-effectiveness, have broadened accessibility across small and large practices. Additionally, the trend toward telemedicine, wearable animal health monitoring devices, and AI-powered diagnostic tools is shaping the next phase of software adoption. Looking forward, the market is expected to sustain growth through continued innovation in veterinary information systems, regulatory compliance tools, and client engagement applications, with segmental leadership anticipated from veterinary practice management software, cloud-based deployment, and small animal practices.
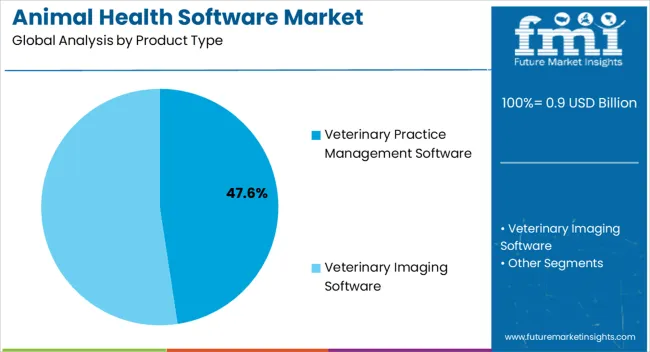
The veterinary practice management software segment is projected to hold 47.6% of the animal health software market revenue in 2025, establishing itself as the leading product type. This dominance has been supported by the software’s ability to centralize clinical records, manage appointment scheduling, billing, and inventory tracking, all of which are vital for efficient veterinary operations.
Veterinary organizations have increasingly adopted such systems to improve workflow efficiency and reduce administrative burden, allowing more time for patient care. Press releases from software developers have highlighted continued product innovations, such as integrated diagnostic imaging and mobile application support, which have enhanced adoption rates.
Moreover, rising client expectations for streamlined communication and digital access to pet health records have reinforced the demand for practice management systems. With the increasing digital transformation of veterinary care, this segment is expected to remain the backbone of animal health software adoption.
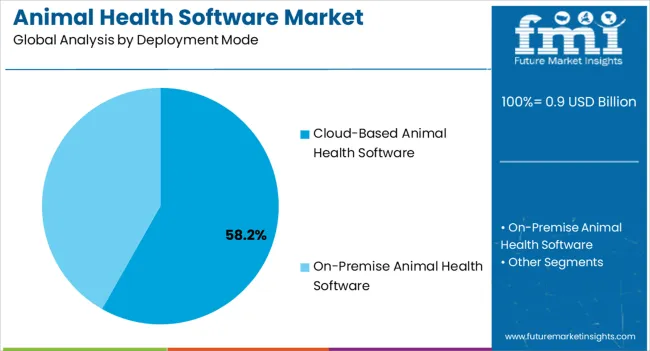
The cloud-based animal health software segment is projected to account for 58.2% of the market revenue in 2025, maintaining its leading position in deployment models. Growth of this segment has been driven by the scalability, accessibility, and cost-effectiveness that cloud platforms provide.
Veterinary practices of varying sizes have increasingly opted for cloud-based systems to avoid heavy upfront investments in IT infrastructure. Industry updates have emphasized the role of cloud solutions in enabling remote access to patient records, facilitating telehealth consultations, and ensuring data security through regular updates.
Cloud-based deployment has also supported seamless integration with other veterinary applications, from diagnostics to pharmacy management. The ability to provide real-time data access across multiple practice locations has further strengthened adoption. With rising demand for flexible, subscription-based software models, cloud-based platforms are expected to continue leading the market, particularly as veterinary practices prioritize efficiency and digital connectivity.
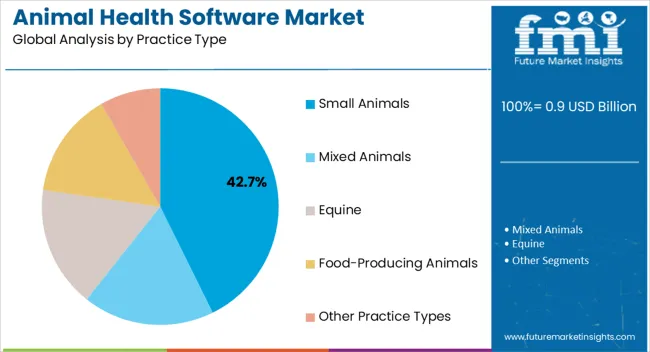
The small animals segment is projected to contribute 42.7% of the animal health software market revenue in 2025, positioning itself as the leading practice type. This growth has been driven by the rising global companion animal population and the increasing expenditure on pet healthcare.
Veterinary practices focused on small animals have been among the earliest adopters of digital tools to manage patient data, diagnostics, and treatment plans. Reports from veterinary associations have indicated that small animal clinics require advanced client communication systems to engage pet owners and provide preventive care services.
Software platforms have been tailored to meet these needs, offering vaccination reminders, wellness plan tracking, and teleconsultation features. Additionally, the growing humanization of pets has led to greater expectations for healthcare quality, encouraging practices to adopt digital systems for transparency and efficiency. With the sustained rise in pet ownership and expanding access to veterinary services, the small animals segment is expected to anchor continued growth in the animal health software market.
As per the Animal Health Software industry research by Future Market Insights - a market research and competitive intelligence provider, historically, from 2020 to 2025, the market value of the Animal Health Software industry increased at around 10% CAGR, wherein, countries such as the USA, UK, China, South Korea and Japan held significant share in the global market.
Owing to the continuous adoption, the Animal Health Software market is projected to grow at a CAGR of 11% over the coming 10 years.
Animal Health Software provides a comprehensive solution for the management of a veterinarian's office, including the maintenance of schedules and records. According to the American Veterinary Medical Association, there are approximately 68,000 veterinarians in North America and approximately 22,000 in the United Kingdom who practice privately. This figure is expected to rise further over the forecast period. This increase is expected to drive demand for Animal Health Software for carrying out operations in clinics and reference research labs.
The demand for virtual pet care visits increased during the pandemic, resulting in the widespread adoption of Animal Health Software solutions. The number of pet owners has grown significantly over the years, and this trend is likely to continue in the years ahead. According to the American Pet Products Association, approximately 33% of pet owners owned a dog, while 27% of pet owners owned a cat. In total, it was estimated to be around 59% in 2025. As a result, the increase in the adoption of pets accelerates market growth.
Due to rising demand for Animal Health Software in developing nations, particularly India and China, the market in the Asia Pacific region is predicted to grow at the fastest rate of almost 9.5% during the forecast period. This rise can also be attributed to a higher standard of living. The need for software is likely to rise as the pet population grows and health issues for pets become more prevalent.
The market in the Asia Pacific is projected to increase at a significant pace throughout the projection period. Increased disposable income is predicted to improve the possibility of pet adoption and open up new commercial opportunities. The market is likely to grow throughout the forecast period as advanced healthcare infrastructure continues to be modernized. It has been reported that market opportunities, particularly in the Asia Pacific, have risen as a result of expanding veterinary healthcare expenditure and pet population lifestyle in countries such as China and India.
The Asia Pacific market is expected to grow at the highest rate during the forecast period due to the rising market for veterinary practice management as a result of the region's constantly growing livestock population, rising demand for animal-derived food products, and soaring pet adoption. The existence of unmet clinical needs, as well as rising levels of awareness among patients and practitioners, are expected to drive market growth over the coming years. The urgent need to address healthcare issues caused by the high prevalence of zoonotic diseases, as well as the need to manage disease outbreaks, are expected to drive market growth.
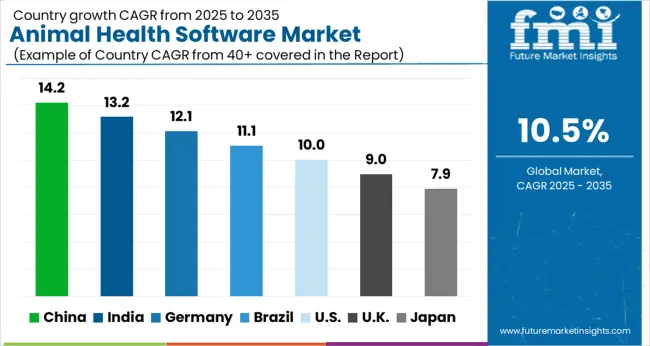
The United States market holds the highest Animal Health Software market share of more than 41%, which is expected to continue throughout the projected period. The presence of well-established businesses, advanced health IT infrastructure, and increased buying capacity of pet owners account for the majority of this segment's revenue share.
There are numerous opportunities for PMS implementation in this region which provides lucrative opportunities for investment in this industry. The growing number of pet health organizations, such as the World Small Animal Veterinary Association, combined with rising pet care spending by individuals and governments, is expected to drive market growth in this region even further.
Over the last few decades, the increasing use of information systems in healthcare practices has significantly altered the way patients are cared for. The new veterinary practice management software enables veterinary service providers to directly access diagnostic lab results, thus reducing the treatment time and making it convenient for pet owners.
This type of data sharing via the internet also improves treatment efficiency and reduces the possibility of any medical slipups. The introduction of technically sophisticated software that provides solutions for all processes in veterinary clinics on a single platform is anticipated to produce an increasing adoption rate.
The food-producing animals retained a dominant position of more than 42% in 2025, owing to rising demand for cost-effective products to safeguard livestock health. The growing need for such goods from veterinarian medication makers to oversee the manufacturing process, maintain product stockpile and quality information, and monitor activities like pharmacovigilance is moving the segment ahead.
Nutritional animal products account for one-third of human protein intake in emerging nations, according to the Food and Agriculture Organization. This increases the demand for increased livestock output, which is necessary to meet the world's rising population's dietary needs. These pressures have an impact on the entire section.
The advent of veterinary control management systems that aid in the identification and registration of livestock, as well as the maintenance of farm records including owner information, is expected to accelerate the adoption of these solutions in the coming years. Some Animal Health Software systems can also map disease prevalence, treatment rates, and vaccination rates. As a result, widespread use of this software in food-producing animal healthcare coverage is expected to fuel growth.
Owing to their convenience, on-premise solutions are expected dominate the overall industry in 2025, with a revenue share of more than 51%. The cost of these platforms, however, is higher because it includes the cost of the overall system as well as the hardware and software package.
This is expected to be a barrier to the growth of on-premise amenities. Because of the associated benefits, the cloud/web-based strategies segment is expected to grow at a profitable CAGR during the forecast period. Users can access health information remotely, and these solutions help to reduce the risk of information misuse.
The ease of access provided by proper IT facilities used in the deployment of cloud/web-based solutions aids in increasing productivity and profits for the organization. The high cost of implementation is expected to restrict their adoption by new players.
The implementation of cloud-based solutions, on the other hand, is expected to alter the dynamics. These services provide a centralized location for patients, researchers, and practitioners to access medical information. These platforms reduce the risk of data theft by providing a secure platform for information sharing and allowing veterinarians to keep track of data. This is expected to increase the adoption of cloud/web-based solutions in the coming years.
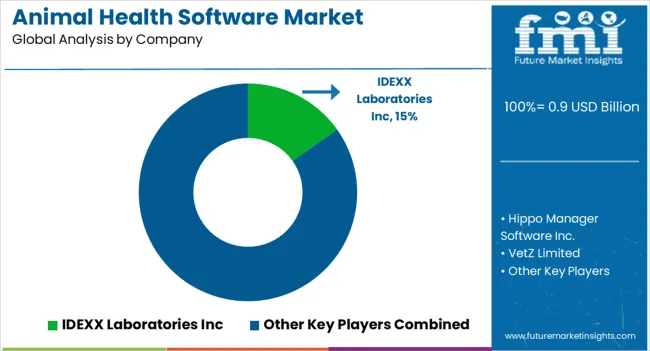
The key Animal Health Software companies include IDEXX Laboratories Inc., Hippo Manager Software Inc., VetZ Limited, Esaote SpA, Henry Schein Inc, Patterson Companies, Vetter Software, Animal Intelligence Software, Timeless Veterinary Systems, ezyVet Limited, Britton’s Wise Computer, FirmCloud Corporation, Clientrax, VIA Information System, Finnish Net Solutions, Carestream Health, and OR Technology.
Some of the recent developments of key Animal Health Software providers are as follows:
| Report Attributes | Details |
|---|---|
| Global Animal Health Software Market CAGR (2025 to 2035) | 10.6% |
| Base Year for Estimation | 2025 |
| Historical Data | 2020 to 2025 |
| Forecast Period | 2025 to 2035 |
| Global Animal Health Software Market Size (2025) | USD 0.9 billion |
| Global Animal Health Software Market Size (2035) | USD 2.3 billion |
| Quantitative Units | Revenue in USD Million and CAGR from 2025 to 2035 |
| Report Coverage | Revenue Forecast, Volume Forecast, Company Ranking, Competitive Landscape, Growth Factors, Trends and Pricing Analysis |
| Segments Covered | Product Type, Deployment Mode, Practice Type, End-User, Region |
| Regions Covered | North America; Latin America; Western Europe; Eastern Europe; South Asia & Pacific; East Asia; Middle East & Africa (MEA) |
| Key Countries Profiled | United States, Canada, Brazil, Mexico, Germany, United Kingdom, France, Spain, Italy, Poland, Russia, Czech Republic, Romania, India, Bangladesh, Australia, New Zealand, China, Japan, South Korea, GCC Countries, South Africa, Israel |
| Key Companies Covered | IDEXX Laboratories Inc; Hippo Manager Software Inc.; VetZ Limited; Esaote SpA; Henry Schein Inc; Patterson Companies; Vetter Software; Animal Intelligence Software; Timeless Veterinary Systems; ezyVet Limited; Britton’s Wise Computer; FirmCloud Corporation; Clientrax; VIA Information System; Finnish Net Solutions; Carestream Health; OR Technology |
| Customization | Available Upon Request |
The global animal health software market is estimated to be valued at USD 0.9 billion in 2025.
The market size for the animal health software market is projected to reach USD 2.3 billion by 2035.
The animal health software market is expected to grow at a 10.6% CAGR between 2025 and 2035.
The key product types in animal health software market are veterinary practice management software and veterinary imaging software.
In terms of deployment mode, cloud-based animal health software segment to command 58.2% share in the animal health software market in 2025.


Full Research Suite comprises of:
Market outlook & trends analysis
Interviews & case studies
Strategic recommendations
Vendor profiles & capabilities analysis
5-year forecasts
8 regions and 60+ country-level data splits
Market segment data splits
12 months of continuous data updates
DELIVERED AS:
PDF EXCEL ONLINE
Animal External Fixation Market Size and Share Forecast Outlook 2025 to 2035
Animal Antibiotics and Antimicrobials Market Size and Share Forecast Outlook 2025 to 2035
Animal Auto-Immune Disease Diagnostics Market Size and Share Forecast Outlook 2025 to 2035
Animal Disinfectants Market Size and Share Forecast Outlook 2025 to 2035
Animal Antimicrobials and Antibiotics Market Size and Share Forecast Outlook 2025 to 2035
Animal Sedative Market Size and Share Forecast Outlook 2025 to 2035
Animal Genetics Market Size and Share Forecast Outlook 2025 to 2035
Animal Peptides Market Size and Share Forecast Outlook 2025 to 2035
Animal Immunoassay Kits Market Analysis - Size, Share, and Forecast Outlook 2025 to 2035
Animal Gastroesophageal Reflux Disease Market Size and Share Forecast Outlook 2025 to 2035
Animal Parasiticide Market Size and Share Forecast Outlook 2025 to 2035
Animal Model Market Analysis - Size, Share, and Forecast Outlook 2025 to 2035
Animal Feed Additives Market Analysis - Size, Share, & Forecast Outlook 2025 to 2035
Animal Feed Organic Trace Minerals Market Size and Share Forecast Outlook 2025 to 2035
Animal Nutrition Chemicals Market Analysis - Size, Share, and Forecast Outlook 2025 to 2035
Animal Artificial Insemination Market Report - Trends, Demand & Industry Forecast 2025 to 2035
Animal Wound Care Market Size and Share Forecast Outlook 2025 to 2035
Animal Parasiticides Market Size and Share Forecast Outlook 2025 to 2035
Animal Feeds Microalgae Market Size and Share Forecast Outlook 2025 to 2035
Animal Feed Probiotic Market Analysis - Size, Share, and Forecast Outlook 2025 to 2035

Thank you!
You will receive an email from our Business Development Manager. Please be sure to check your SPAM/JUNK folder too.
Chat With
MaRIA