Animal Digest Market Size, Share, and Forecast Outlook 2025 to 2035

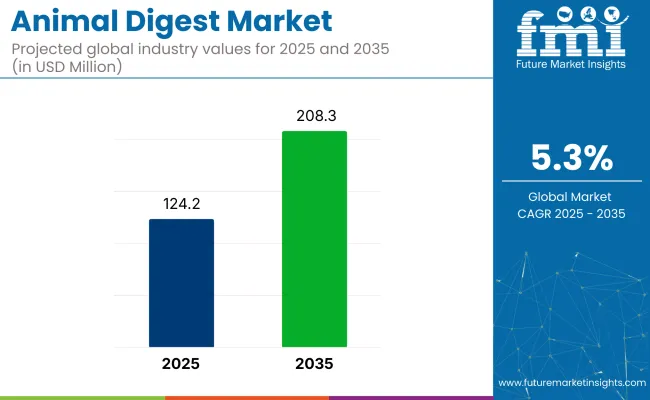
The animal digest market is projected to grow from USD 124.2 million in 2025 to USD 208.3 million by 2035, reflecting a CAGR of 5.3% over the forecast period. Demand is anticipated to remain consistent as animal digest continues to serve as a palatability enhancer and nutritional supplement in pet food and livestock feed. While North America remains the core manufacturing and consumption hub, expansion into Latin America and Southeast Asia is expected to gain pace.
Quick Stats in Animal Digest Market

  • Market Value (2025): USD 124.2 million
  • Forecast Value (2035): USD 208.3 million
  • Forecast CAGR: 5.3%
  • Top Form Segment: Liquid (55% market share in 2025)
  • Primary End Use: Dog Food (55% market share in 2025)
  • Key Growth Country: India (8.8% CAGR)

Animal Digest Market

Technological improvements in rendering processes and ingredient traceability are helping address historical concerns around transparency and safety. As consumers scrutinize labels more closely, producers are highlighting the nutritional relevance of digest through better documentation and certification. Enhanced processing control and cleaner supply chains are likely to elevate its status across both mainstream and specialty feed applications.

As of 2025, the animal digest market holds a specialized but vital share across its broader parent markets. Within the global animal feed additives market, it accounts for approximately 2-3%, primarily due to its role in enhancing feed palatability. In the pet food ingredients market, holds a more substantial share of about 5-7%, driven by its widespread use in dry kibble and treats for flavor enhancement.

Within the global animal nutrition market, its contribution is estimated at 1-2%, as it serves a specific functional role. In the rendered products market, it represents around 3-5%, since it is a value-added by-product. In the global livestock feed market, animal digest comprises roughly 1-2%, especially in formulations targeting improved feed intake.

Analyzing Animal Digest Market by Top Investment Segments

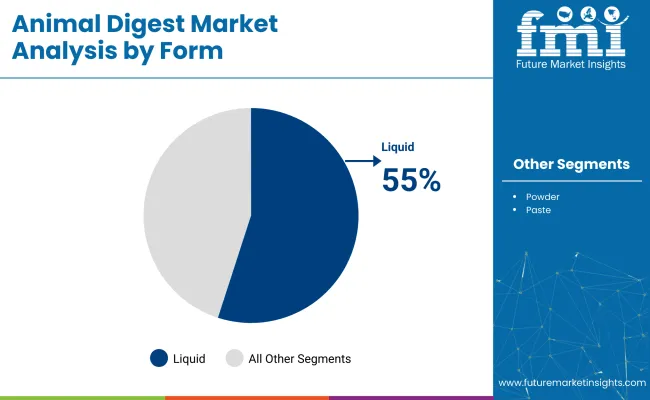
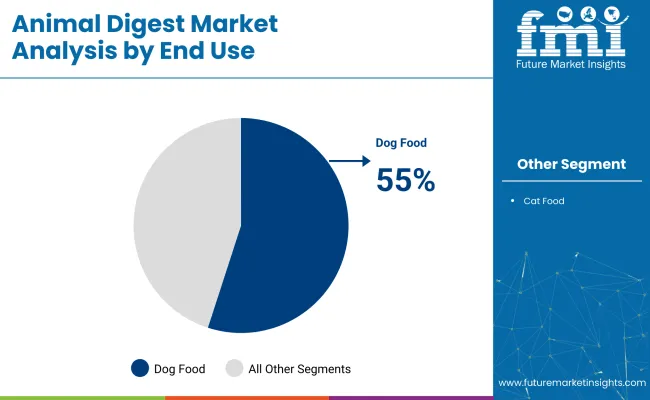
Liquid form is projected to dominate the form segment with 55% market share by 2025, while pork remains the leading source with a 40% share. Dog food is expected to account for 55% of the end-use segment, driven by increasing demand for palatable and protein-rich pet diets.

Liquid Form to Dominate the Form Segment with 55% Market Share

Liquid animal digest is forecasted to lead the form segment, holding 55% of the market share by 2025, due to superior flavor dispersion and high absorption efficiency.
  • Liquid formats are being increasingly used by pet food manufacturers to enhance taste and consistency in wet and dry pet food formulations. Palatability enhancers in liquid form help increase feed intake, especially among picky pets.
  • Flexible application, uniform coating ability, and longer shelf stability are making liquid digests a preferred choice in large-scale production. Consistent demand for flavorful pet food across retail and veterinary channels continues to support liquid format dominance.

Animal Digest Market Analysis By Form

Pork to Lead the Source Segment with 40% Market Share

Pork is expected to secure 40% of the source segment in the market by 2025, supported by widespread availability and cost-effectiveness.

  • Pork-derived digests are being favored for their strong aroma and compatibility with a variety of pet food recipes. High digestibility and protein content are also contributing to its popularity in mass-market formulations.
  • As consumer preference for meat-based ingredients grows, pork continues to serve as a reliable and economical source for digest manufacturing. Leading pet food brands are incorporating pork digest to enhance flavor profiles and nutritional value across product ranges.

Dog Food to Dominate the End-Use Segment with 55% Market Share

Dog food is anticipated to dominate the end-use segment, capturing 55% of the market share by 2025, due to growing pet ownership and demand for enhanced palatability.
  • Animal digest is being added to dog food to improve taste and encourage higher food consumption, particularly in older dogs and those with appetite issues. Nutritional enrichment through digest inclusion supports gut health and protein intake.
  • Both wet and dry dog food segments are utilizing digest to differentiate product lines in a competitive retail space. The expanding premium and prescription dog food categories continue to boost digest utilization rates across global markets.

Animal Digest Market Analysis By End Use

Top Animal Digest Market Dynamics

The market is experiencing growth driven by increasing use in pet nutrition and livestock performance. Manufacturers are focusing on enhancing palatability, improving nutritional uptake, and meeting rising demand for functional and high-quality feed ingredients.

Growing Use in Pet Food and Companion Animal Nutrition

Animal digests are key flavor enhancers in both wet and dry pet food, increasing feed acceptance among pets. Producers are developing species-specific formulas, such as poultry, beef, or fish-based digests, tailored to animal preferences. Premium pet food brands rely on high-quality digests to improve product appeal, particularly in treats and specialty diets for older or sensitive pets. Demand is also supported by growing pet adoption and humanization trends.

  • Animal digests boost flavor and acceptance in both wet and dry pet foods.
  • Species-specific digests like poultry or fish are tailored to pet preferences.
  • Premium pet food uses high-quality digests for specialty diets and treats.

Enhanced Role in Livestock Feed Efficiency and Nutrient Utilization

In commercial livestock, animal digests are utilized to improve feed intake and digestion. Their inclusion helps optimize growth rates and feed conversion ratios in poultry, swine, and aquaculture. Feed producers are integrating digests into starter feeds and performance diets to promote early growth and improve health outcomes. This has led to increased purchasing by feed mills and integrated farms aiming for consistent productivity gains.
  • Animal digests support better digestion and feed intake in livestock.
  • They are widely used in starter and performance diets for young animals.
  • Feed mills and farms adopt digests to enhance growth and productivity.

Analysis of Top Countries Producing, Integrating, and Scaling Animal Digest Products Globally

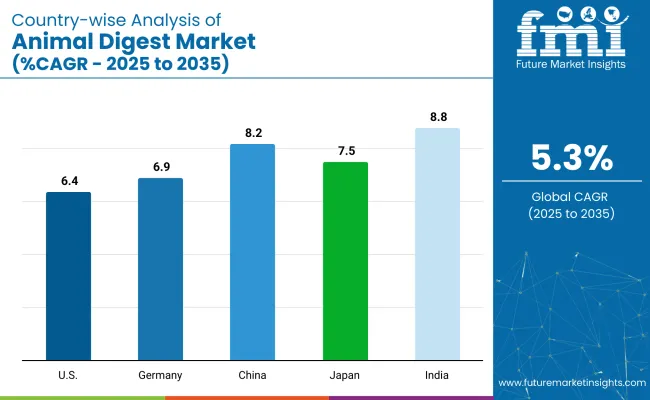
Country Wise Analysis Of Animal Digest Market Cagr 2025 To 2035

Countries CAGR (2025 to 2035)
USA 6.4%
Germany 6.9%
China 8.2%
Japan 7.5%
India 8.8%

The global market is forecast to grow at a CAGR of 5.3% from 2025 to 2035, with varied growth patterns across key regions. India, a member of the BRICS group, is leading the market with an 8.8% CAGR, supported by rapid expansion in livestock and aquaculture feed demand. China, also a BRICS nation, follows with a CAGR of 8.2%, driven by large-scale pet food and fish farming sectors.

Japan, an OECD member, is advancing steadily at 7.5% CAGR, focused on premium pet nutrition and marine aquaculture. In Europe, Germany is growing at 6.9% CAGR, fueled by sustainability policies and advanced feed processing. The USA, another OECD country, maintains strong growth at 6.4%, supported by premiumization in companion animal nutrition and regulatory compliance.

While BRICS nations are scaling rapidly through volume and affordability, OECD countries are shaping the market through innovation, quality standards, and regulatory rigor.

The report provides insights across 40+ countries. The five below are highlighted for their strategic influence and growth trajectory.

India Animal Digest Market Expansion and Outlook

Demand in India is forecast to grow at 8.8% CAGR through 2035, the fastest among major markets. This growth is underpinned by rising demand for high-efficiency feed in poultry, aquaculture, and dairy sectors. Increasing focus on protein-enriched diets and the need to boost palatability in compound feeds are pushing digest usage across rural and industrial regions.

As a BRICS and Emerging Market nation, India is investing in local rendering infrastructure to reduce import dependence and enable scalable digest production. Growth is also supported by expanding pet food retail and rising awareness of functional animal nutrition, particularly in urban hubs.

  • Poultry and fish farming are driving large-scale digest adoption.
  • Rendering capacity is expanding to meet domestic feed needs.
  • Pet food and functional feed are creating new downstream demand.

China Animal Digest Market Performance

The market in China is projected to grow at a CAGR of 8.2%, driven by its dominant role in aquafeed and growing urban pet food demand. Digest ingredients are widely adopted in feed for carp, tilapia, and shrimp, enhancing palatability and nutrient uptake. Pet food manufacturers are incorporating poultry- and fish-based digest into high-value dry and wet formulations.

As a BRICS and Protein-Transition Market, China is pushing for feed conversion efficiency in both commercial livestock and pet care. Domestic suppliers are expanding rapidly to meet government goals of sustainable feed practices and reduced food waste through byproduct valorization.

  • Aquaculture feed demand is increasing use of marine-based digest.
  • Urban pet care trends are driving functional ingredient adoption.
  • Digest production is aligned with China’s food waste reduction policies.

Japan Animal Digest Industry Outlook

Japan is experiencing steady growth in the market with a CAGR of 7.5%, led by demand for precision-formulated pet food and high-value aquafeed. As an OECD member with stringent safety standards, Japan emphasizes digest ingredients that are traceable, refined, and suitable for senior and specialty pet diets.

Marine-based digest, particularly from sardines and tuna, is gaining ground in fish farming regions. The domestic market favors functionality, palatability, and low-allergen potential. Local producers are innovating in processing techniques that preserve bioavailability, meeting demand in a mature but highly selective feed and pet food ecosystem.

  • Specialty diets are using digest to enhance taste and nutrition.
  • Marine-based digest is preferred in aquafeed applications.
  • Innovation focuses on purity, traceability, and digestibility.

Germany Animal Digest Market Insights

Germany’s industry is forecast to grow at 6.9% CAGR, driven by regulatory alignment, clean-label trends, and performance-focused feed solutions. As part of the EU27 and Sustainability-Focused Nations, Germany places high importance on responsible sourcing and traceable byproducts. Pet food brands are increasingly incorporating hydrolyzed digest for flavor enhancement without artificial additives.

In livestock feed, digest use supports reduced antibiotic reliance and improved animal intake. Germany’s advanced rendering facilities and compliance-driven production processes are setting benchmarks in the EU market, particularly in poultry, swine, and premium pet nutrition sectors.

  • Pet food brands are prioritizing hydrolyzed, clean-label digest.
  • Livestock feed uses digest to support reduced antibiotic usage.
  • EU-aligned quality systems ensure compliance and safety.

United States Animal Digest Market Overview

The USA market is expanding at a 6.4% CAGR, supported by growth in premium pet nutrition and the modernization of aquafeed practices. As an OECD economy, the USA enforces strict AAFCO and FDA standards that are shaping digest production and labeling practices.

Digest is widely used in pet food for palatability and nutrient density, especially in products targeting older pets or those with sensitive digestion. In aquaculture, digest contributes to protein efficiency and reduced feed waste. USA manufacturers are investing in advanced hydrolysis technologies, long-term shelf stability, and clean-label formulations to meet evolving consumer expectations.

  • Digest supports performance and taste in premium pet products.
  • Aquaculture producers are adopting digest for feed optimization.
  • Regulatory oversight ensures high safety and transparency standards.

Leading Animal Digest Companies

The market is moderately fragmented, featuring a mix of global players and emerging suppliers that cater to growing demands in pet nutrition and animal feed industries. Established companies like Kemin Industries, ADM Animal Nutrition, Cargill, and BASF SE lead the market with robust R&D capabilities and advanced manufacturing processes, ensuring consistent quality and palatability in feed-grade digest products. Darling Ingredients and Omega Protein Corporation play key roles in providing sustainable raw materials derived from animal by-products.

Nestlé and B&G Foods, Inc. integrate animal digest components into their pet food portfolios, enhancing flavor and nutritional value. Companies such as John Pointon and Sons Ltd, BRF Ingredients, and Novozymes contribute through specialized enzyme solutions and feed additives. Emerging firms like Foodchem and New Alliance Fine Chem Pvt. Ltd. are expanding their footprint in regional markets with customized solutions.

Report Coverage and Scope Summary

Report Attribute Details
Market Size (2025) USD 124.2 million
Projected Market Size (2035) USD 208.3 million
CAGR (2025 to 2035) 5.3%
Base Year for Estimation 2024
Historical Period 2020 to 2024
Projections Period 2025 to 2035
Quantitative Units USD million for market value
Forms Analyzed (Segment 1) Paste, Powder, Liquid
Sources Analyzed (Segment 2) Poultry, Pork, Turkey, Duck, Salmon, Lamb
End Uses Analyzed (Segment 3) Dog Food, Cat Food
Regions Covered North America, Latin America, Western Europe, Eastern Europe, East Asia, South Asia & Pacific, Central Asia, Russia & Belarus, Balkan & Baltic Countries, Middle East & Africa
Key Players Kemin Industries, B&G Foods, Inc., ADM Animal Nutrition, BASF SE, Cargill, Darling Ingredients, John Pointon and Sons Ltd, Nestlé, Omega Protein Corporation, DowDuPont Inc., Novozymes, Foodchem, BRF Ingredients, New Alliance Fine Chem Pvt. Ltd., and other emerging competitors
Additional Attributes Dollar sales by form and source, rising preference for poultry and salmon digest, expanding pet ownership, and premium pet food demand are shaping market growth across emerging and developed economies.

Leading Brands in Animal Digest Industry

  • Kemin Industries
  • B&G Foods, Inc.
  • ADM Animal Nutrition
  • BASF SE
  • Cargill
  • Darling Ingredients
  • John Pointon and Sons Ltd
  • Nestle
  • Omega Protein Corporation
  • DowDuPony Inc.
  • Novozymes
  • Foodchem
  • BRF Ingredients
  • New Alliance Fine Chem Pvt. Ltd.
  • Other Emerging Players

Animal Digest Market Analyzed by Key Investment Segments

By Form:

The industry is segmented based on form into paste, powder, and liquid animal digest formulations.

By Source:

Animal digest is derived from multiple sources, including pork, poultry, turkey, duck, salmon, and lamb.

By End Use:

The key end-use applications are in pet nutrition, specifically in dog food and cat food products.

By Region:

The market spans across various regions, including North America, Latin America, Western Europe, Eastern Europe, East Asia, South Asia & Pacific, Central Asia, Russia and Belarus, Balkan & Baltic Countries, and the Middle East & Africa.

Table of Content

  1. Executive Summary
    • Global Market Outlook
    • Demand-side Trends
    • Supply-side Trends
    • Technology Roadmap Analysis
    • Analysis and Recommendations
  2. Market Overview
    • Market Coverage / Taxonomy
    • Market Definition / Scope / Limitations
  3. Market Background
    • Market Dynamics
      • Drivers
      • Restraints
      • Opportunity
      • Trends
    • Scenario Forecast
      • Demand in Optimistic Scenario
      • Demand in Likely Scenario
      • Demand in Conservative Scenario
    • Opportunity Map Analysis
    • Product Life Cycle Analysis
    • Supply Chain Analysis
      • Supply Side Participants and their Roles
        • Producers
        • Mid-Level Participants (Traders/ Agents/ Brokers)
        • Wholesalers and Distributors
      • Value Added and Value Created at Node in the Supply Chain
      • List of Raw Material Suppliers
      • List of Existing and Potential Buyer’s
    • Investment Feasibility Matrix
    • Value Chain Analysis
      • Profit Margin Analysis
      • Wholesalers and Distributors
      • Retailers
    • PESTLE and Porter’s Analysis
    • Regulatory Landscape
      • By Key Regions
      • By Key Countries
    • Regional Parent Market Outlook
    • Production and Consumption Statistics
    • Import and Export Statistics
  4. Global Analysis 2020 to 2024 and Forecast, 2025 to 2035
    • Historical Market Size Value (USD Million) & Volume (Metric tons) Analysis, 2020 to 2024
    • Current and Future Market Size Value (USD Million) & Volume (Metric tons) Projections, 2025 to 2035
      • Y-o-Y Growth Trend Analysis
      • Absolute $ Opportunity Analysis
  5. Global Pricing Analysis 2020 to 2024 and Forecast 2025 to 2035
  6. Global Analysis 2020 to 2024 and Forecast 2025 to 2035, By Form
    • Introduction / Key Findings
    • Historical Market Size Value (USD Million) & Volume (Metric tons) Analysis By Form, 2020 to 2024
    • Current and Future Market Size Value (USD Million) & Volume (Metric tons) Analysis and Forecast By Form, 2025 to 2035
      • Paste
      • Powder
      • Liquid
    • Y-o-Y Growth Trend Analysis By Form, 2020 to 2024
    • Absolute $ Opportunity Analysis By Form, 2025 to 2035
  7. Global Analysis 2020 to 2024 and Forecast 2025 to 2035, By Source
    • Introduction / Key Findings
    • Historical Market Size Value (USD Million) & Volume (Metric tons) Analysis By Source, 2020 to 2024
    • Current and Future Market Size Value (USD Million) & Volume (Metric tons) Analysis and Forecast By Source, 2025 to 2035
      • Poultry
      • Pork
      • Turkey
      • Duck
      • Salmon
      • Lamb
    • Y-o-Y Growth Trend Analysis By Source, 2020 to 2024
    • Absolute $ Opportunity Analysis By Source, 2025 to 2035
  8. Global Analysis 2020 to 2024 and Forecast 2025 to 2035, By End Use
    • Introduction / Key Findings
    • Historical Market Size Value (USD Million) & Volume (Metric tons) Analysis By End Use, 2020 to 2024
    • Current and Future Market Size Value (USD Million) & Volume (Metric tons) Analysis and Forecast By End Use, 2025 to 2035
      • Dog Food
      • Cat Food
    • Y-o-Y Growth Trend Analysis By End Use, 2020 to 2024
    • Absolute $ Opportunity Analysis By End Use, 2025 to 2035
  9. Global Analysis 2020 to 2024 and Forecast 2025 to 2035, By Region
    • Introduction
    • Historical Market Size Value (USD Million) & Volume (Metric tons) Analysis By Region, 2020 to 2024
    • Current Market Size Value (USD Million) & Volume (Metric tons) Analysis and Forecast By Region, 2025 to 2035
      • North America
      • Latin America
      • Western Europe
      • Eastern Europe
      • East Asia
      • South Asia & Pacific
      • Middle East and Africa
    • Market Attractiveness Analysis By Region
  10. North America Analysis 2020 to 2024 and Forecast 2025 to 2035, By Country
    • Historical Market Size Value (USD Million) & Volume (Metric tons) Trend Analysis By Market Taxonomy, 2020 to 2024
    • Market Size Value (USD Million) & Volume (Metric tons) Forecast By Market Taxonomy, 2025 to 2035
      • By Country
        • USA
        • Canada
        • Mexico
      • By Form
      • By Source
      • By End Use
    • Market Attractiveness Analysis
      • By Country
      • By Form
      • By Source
      • By End Use
    • Key Takeaways
  11. Latin America Analysis 2020 to 2024 and Forecast 2025 to 2035, By Country
    • Historical Market Size Value (USD Million) & Volume (Metric tons) Trend Analysis By Market Taxonomy, 2020 to 2024
    • Market Size Value (USD Million) & Volume (Metric tons) Forecast By Market Taxonomy, 2025 to 2035
      • By Country
        • Brazil
        • Argentina
        • Rest of LATAM
      • By Form
      • By Source
      • By End Use
    • Market Attractiveness Analysis
      • By Country
      • By Form
      • By Source
      • By End Use
    • Key Takeaways
  12. Western Europe Analysis 2020 to 2024 and Forecast 2025 to 2035, By Country
    • Historical Market Size Value (USD Million) & Volume (Metric tons) Trend Analysis By Market Taxonomy, 2020 to 2024
    • Market Size Value (USD Million) & Volume (Metric tons) Forecast By Market Taxonomy, 2025 to 2035
      • By Country
        • Germany
        • Italy
        • France
        • UK
        • Spain
        • BENELUX
        • Nordic
        • Rest of W.Europe
      • By Form
      • By Source
      • By End Use
    • Market Attractiveness Analysis
      • By Country
      • By Form
      • By Source
      • By End Use
    • Key Takeaways
  13. Eastern Europe Analysis 2020 to 2024 and Forecast 2025 to 2035, By Country
    • Historical Market Size Value (USD Million) & Volume (Metric tons) Trend Analysis By Market Taxonomy, 2020 to 2024
    • Market Size Value (USD Million) & Volume (Metric tons) Forecast By Market Taxonomy, 2025 to 2035
      • By Country
        • Russia
        • Hungary
        • Poland
        • Balkan & Baltics
        • Rest of E. Europe
      • By Form
      • By Source
      • By End Use
    • Market Attractiveness Analysis
      • By Country
      • By Form
      • By Source
      • By End Use
    • Key Takeaways
  14. East Asia Analysis 2020 to 2024 and Forecast 2025 to 2035, By Country
    • Historical Market Size Value (USD Million) & Volume (Metric tons) Trend Analysis By Market Taxonomy, 2020 to 2024
    • Market Size Value (USD Million) & Volume (Metric tons) Forecast By Market Taxonomy, 2025 to 2035
      • By Country
        • China
        • Japan
        • South Korea
      • By Form
      • By Source
      • By End Use
    • Market Attractiveness Analysis
      • By Country
      • By Form
      • By Source
      • By End Use
    • Key Takeaways
  15. South Asia & Pacific Analysis 2020 to 2024 and Forecast 2025 to 2035, By Country
    • Historical Market Size Value (USD Million) & Volume (Metric tons) Trend Analysis By Market Taxonomy, 2020 to 2024
    • Market Size Value (USD Million) & Volume (Metric tons) Forecast By Market Taxonomy, 2025 to 2035
      • By Country
        • India
        • Australia & New Zealand
        • ASEAN
        • Rest of SAP
      • By Form
      • By Source
      • By End Use
    • Market Attractiveness Analysis
      • By Country
      • By Form
      • By Source
      • By End Use
    • Key Takeaways
  16. Middle East and Africa Analysis 2020 to 2024 and Forecast 2025 to 2035, By Country
    • Historical Market Size Value (USD Million) & Volume (Metric tons) Trend Analysis By Market Taxonomy, 2020 to 2024
    • Market Size Value (USD Million) & Volume (Metric tons) Forecast By Market Taxonomy, 2025 to 2035
      • By Country
        • GCC Countries
        • Northern Africa
        • South Africa
        • Turkiye
        • Rest of MEA
      • By Form
      • By Source
      • By End Use
    • Market Attractiveness Analysis
      • By Country
      • By Form
      • By Source
      • By End Use
    • Key Takeaways
  17. Key Countries Analysis
    • USA
      • Pricing Analysis
      • Market Share Analysis, 2024
        • By Form
        • By Source
        • By End Use
    • Canada
      • Pricing Analysis
      • Market Share Analysis, 2024
        • By Form
        • By Source
        • By End Use
    • Brazil
      • Pricing Analysis
      • Market Share Analysis, 2024
        • By Form
        • By Source
        • By End Use
    • Mexico
      • Pricing Analysis
      • Market Share Analysis, 2024
        • By Form
        • By Source
        • By End Use
    • Argentina
      • Pricing Analysis
      • Market Share Analysis, 2024
        • By Form
        • By Source
        • By End Use
  18. Market Structure Analysis
    • Competition Dashboard
    • Competition Benchmarking
    • Market Share Analysis of Top Players
      • By Regional
      • By Form
      • By Source
      • By End Use
  19. Competition Analysis
    • Competition Deep Dive
      • Kemin Industries
        • Overview
        • Product Portfolio
        • Profitability by Market Segments (Product/Age /Sales Channel/Region)
        • Sales Footprint
        • Strategy Overview
          • Marketing Strategy
          • Product Strategy
          • Channel Strategy
      • B&G Foods, Inc.
        • Overview
        • Product Portfolio
        • Profitability by Market Segments (Product/Age /Sales Channel/Region)
        • Sales Footprint
        • Strategy Overview
          • Marketing Strategy
          • Product Strategy
          • Channel Strategy
      • ADM Animal Nutrition
        • Overview
        • Product Portfolio
        • Profitability by Market Segments (Product/Age /Sales Channel/Region)
        • Sales Footprint
        • Strategy Overview
          • Marketing Strategy
          • Product Strategy
          • Channel Strategy
      • BASF SE
        • Overview
        • Product Portfolio
        • Profitability by Market Segments (Product/Age /Sales Channel/Region)
        • Sales Footprint
        • Strategy Overview
          • Marketing Strategy
          • Product Strategy
          • Channel Strategy
      • Cargill
        • Overview
        • Product Portfolio
        • Profitability by Market Segments (Product/Age /Sales Channel/Region)
        • Sales Footprint
        • Strategy Overview
          • Marketing Strategy
          • Product Strategy
          • Channel Strategy
      • Darling Ingredients
        • Overview
        • Product Portfolio
        • Profitability by Market Segments (Product/Age /Sales Channel/Region)
        • Sales Footprint
        • Strategy Overview
          • Marketing Strategy
          • Product Strategy
          • Channel Strategy
      • John Pointon and Sons Ltd
        • Overview
        • Product Portfolio
        • Profitability by Market Segments (Product/Age /Sales Channel/Region)
        • Sales Footprint
        • Strategy Overview
          • Marketing Strategy
          • Product Strategy
          • Channel Strategy
      • Nestle
        • Overview
        • Product Portfolio
        • Profitability by Market Segments (Product/Age /Sales Channel/Region)
        • Sales Footprint
        • Strategy Overview
          • Marketing Strategy
          • Product Strategy
          • Channel Strategy
      • Omega Protein Corporation
        • Overview
        • Product Portfolio
        • Profitability by Market Segments (Product/Age /Sales Channel/Region)
        • Sales Footprint
        • Strategy Overview
          • Marketing Strategy
          • Product Strategy
          • Channel Strategy
      • DowDuPony Inc.
        • Overview
        • Product Portfolio
        • Profitability by Market Segments (Product/Age /Sales Channel/Region)
        • Sales Footprint
        • Strategy Overview
          • Marketing Strategy
          • Product Strategy
          • Channel Strategy
      • Novozymes
        • Overview
        • Product Portfolio
        • Profitability by Market Segments (Product/Age /Sales Channel/Region)
        • Sales Footprint
        • Strategy Overview
          • Marketing Strategy
          • Product Strategy
          • Channel Strategy
      • Foodchem
        • Overview
        • Product Portfolio
        • Profitability by Market Segments (Product/Age /Sales Channel/Region)
        • Sales Footprint
        • Strategy Overview
          • Marketing Strategy
          • Product Strategy
          • Channel Strategy
      • BRF Ingredients
        • Overview
        • Product Portfolio
        • Profitability by Market Segments (Product/Age /Sales Channel/Region)
        • Sales Footprint
        • Strategy Overview
          • Marketing Strategy
          • Product Strategy
          • Channel Strategy
      • New Alliance Fine Chem Pvt. Ltd.
        • Overview
        • Product Portfolio
        • Profitability by Market Segments (Product/Age /Sales Channel/Region)
        • Sales Footprint
        • Strategy Overview
          • Marketing Strategy
          • Product Strategy
          • Channel Strategy
      • Other Emerging Players
        • Overview
        • Product Portfolio
        • Profitability by Market Segments (Product/Age /Sales Channel/Region)
        • Sales Footprint
        • Strategy Overview
          • Marketing Strategy
          • Product Strategy
          • Channel Strategy
  20. Assumptions & Acronyms Used
  21. Research Methodology

List of Tables

  • Table 1: Global Market Value (USD Million) Forecast by Region, 2020 to 2035
  • Table 2: Global Market Volume (Metric tons) Forecast by Region, 2020 to 2035
  • Table 3: Global Market Value (USD Million) Forecast by Form, 2020 to 2035
  • Table 4: Global Market Volume (Metric tons) Forecast by Form, 2020 to 2035
  • Table 5: Global Market Value (USD Million) Forecast by Source, 2020 to 2035
  • Table 6: Global Market Volume (Metric tons) Forecast by Source, 2020 to 2035
  • Table 7: Global Market Value (USD Million) Forecast by End Use, 2020 to 2035
  • Table 8: Global Market Volume (Metric tons) Forecast by End Use, 2020 to 2035
  • Table 9: North America Market Value (USD Million) Forecast by Country, 2020 to 2035
  • Table 10: North America Market Volume (Metric tons) Forecast by Country, 2020 to 2035
  • Table 11: North America Market Value (USD Million) Forecast by Form, 2020 to 2035
  • Table 12: North America Market Volume (Metric tons) Forecast by Form, 2020 to 2035
  • Table 13: North America Market Value (USD Million) Forecast by Source, 2020 to 2035
  • Table 14: North America Market Volume (Metric tons) Forecast by Source, 2020 to 2035
  • Table 15: North America Market Value (USD Million) Forecast by End Use, 2020 to 2035
  • Table 16: North America Market Volume (Metric tons) Forecast by End Use, 2020 to 2035
  • Table 17: Latin America Market Value (USD Million) Forecast by Country, 2020 to 2035
  • Table 18: Latin America Market Volume (Metric tons) Forecast by Country, 2020 to 2035
  • Table 19: Latin America Market Value (USD Million) Forecast by Form, 2020 to 2035
  • Table 20: Latin America Market Volume (Metric tons) Forecast by Form, 2020 to 2035
  • Table 21: Latin America Market Value (USD Million) Forecast by Source, 2020 to 2035
  • Table 22: Latin America Market Volume (Metric tons) Forecast by Source, 2020 to 2035
  • Table 23: Latin America Market Value (USD Million) Forecast by End Use, 2020 to 2035
  • Table 24: Latin America Market Volume (Metric tons) Forecast by End Use, 2020 to 2035
  • Table 25: Western Europe Market Value (USD Million) Forecast by Country, 2020 to 2035
  • Table 26: Western Europe Market Volume (Metric tons) Forecast by Country, 2020 to 2035
  • Table 27: Western Europe Market Value (USD Million) Forecast by Form, 2020 to 2035
  • Table 28: Western Europe Market Volume (Metric tons) Forecast by Form, 2020 to 2035
  • Table 29: Western Europe Market Value (USD Million) Forecast by Source, 2020 to 2035
  • Table 30: Western Europe Market Volume (Metric tons) Forecast by Source, 2020 to 2035
  • Table 31: Western Europe Market Value (USD Million) Forecast by End Use, 2020 to 2035
  • Table 32: Western Europe Market Volume (Metric tons) Forecast by End Use, 2020 to 2035
  • Table 33: Eastern Europe Market Value (USD Million) Forecast by Country, 2020 to 2035
  • Table 34: Eastern Europe Market Volume (Metric tons) Forecast by Country, 2020 to 2035
  • Table 35: Eastern Europe Market Value (USD Million) Forecast by Form, 2020 to 2035
  • Table 36: Eastern Europe Market Volume (Metric tons) Forecast by Form, 2020 to 2035
  • Table 37: Eastern Europe Market Value (USD Million) Forecast by Source, 2020 to 2035
  • Table 38: Eastern Europe Market Volume (Metric tons) Forecast by Source, 2020 to 2035
  • Table 39: Eastern Europe Market Value (USD Million) Forecast by End Use, 2020 to 2035
  • Table 40: Eastern Europe Market Volume (Metric tons) Forecast by End Use, 2020 to 2035
  • Table 41: East Asia Market Value (USD Million) Forecast by Country, 2020 to 2035
  • Table 42: East Asia Market Volume (Metric tons) Forecast by Country, 2020 to 2035
  • Table 43: East Asia Market Value (USD Million) Forecast by Form, 2020 to 2035
  • Table 44: East Asia Market Volume (Metric tons) Forecast by Form, 2020 to 2035
  • Table 45: East Asia Market Value (USD Million) Forecast by Source, 2020 to 2035
  • Table 46: East Asia Market Volume (Metric tons) Forecast by Source, 2020 to 2035
  • Table 47: East Asia Market Value (USD Million) Forecast by End Use, 2020 to 2035
  • Table 48: East Asia Market Volume (Metric tons) Forecast by End Use, 2020 to 2035
  • Table 49: South Asia & Pacific Market Value (USD Million) Forecast by Country, 2020 to 2035
  • Table 50: South Asia & Pacific Market Volume (Metric tons) Forecast by Country, 2020 to 2035
  • Table 51: South Asia & Pacific Market Value (USD Million) Forecast by Form, 2020 to 2035
  • Table 52: South Asia & Pacific Market Volume (Metric tons) Forecast by Form, 2020 to 2035
  • Table 53: South Asia & Pacific Market Value (USD Million) Forecast by Source, 2020 to 2035
  • Table 54: South Asia & Pacific Market Volume (Metric tons) Forecast by Source, 2020 to 2035
  • Table 55: South Asia & Pacific Market Value (USD Million) Forecast by End Use, 2020 to 2035
  • Table 56: South Asia & Pacific Market Volume (Metric tons) Forecast by End Use, 2020 to 2035
  • Table 57: Middle East and Africa Market Value (USD Million) Forecast by Country, 2020 to 2035
  • Table 58: Middle East and Africa Market Volume (Metric tons) Forecast by Country, 2020 to 2035
  • Table 59: Middle East and Africa Market Value (USD Million) Forecast by Form, 2020 to 2035
  • Table 60: Middle East and Africa Market Volume (Metric tons) Forecast by Form, 2020 to 2035
  • Table 61: Middle East and Africa Market Value (USD Million) Forecast by Source, 2020 to 2035
  • Table 62: Middle East and Africa Market Volume (Metric tons) Forecast by Source, 2020 to 2035
  • Table 63: Middle East and Africa Market Value (USD Million) Forecast by End Use, 2020 to 2035
  • Table 64: Middle East and Africa Market Volume (Metric tons) Forecast by End Use, 2020 to 2035

List of Figures

  • Figure 1: Global Market Volume (Metric tons) Forecast 2020 to 2035
  • Figure 2: Global Market Pricing Analysis
  • Figure 3: Global Market Value (USD Million) Forecast 2020 to 2035
  • Figure 4: Global Market Value Share and BPS Analysis by Form, 2025 and 2035
  • Figure 5: Global Market Y-o-Y Growth Comparison by Form, 2025 to 2035
  • Figure 6: Global Market Attractiveness Analysis by Form
  • Figure 7: Global Market Value Share and BPS Analysis by Source, 2025 and 2035
  • Figure 8: Global Market Y-o-Y Growth Comparison by Source, 2025 to 2035
  • Figure 9: Global Market Attractiveness Analysis by Source
  • Figure 10: Global Market Value Share and BPS Analysis by End Use, 2025 and 2035
  • Figure 11: Global Market Y-o-Y Growth Comparison by End Use, 2025 to 2035
  • Figure 12: Global Market Attractiveness Analysis by End Use
  • Figure 13: Global Market Value (USD Million) Share and BPS Analysis by Region, 2025 and 2035
  • Figure 14: Global Market Y-o-Y Growth Comparison by Region, 2025 to 2035
  • Figure 15: Global Market Attractiveness Analysis by Region
  • Figure 16: North America Market Incremental $ Opportunity, 2025 to 2035
  • Figure 17: Latin America Market Incremental $ Opportunity, 2025 to 2035
  • Figure 18: Western Europe Market Incremental $ Opportunity, 2025 to 2035
  • Figure 19: Eastern Europe Market Incremental $ Opportunity, 2025 to 2035
  • Figure 20: East Asia Market Incremental $ Opportunity, 2025 to 2035
  • Figure 21: South Asia & Pacific Market Incremental $ Opportunity, 2025 to 2035
  • Figure 22: Middle East and Africa Market Incremental $ Opportunity, 2025 to 2035
  • Figure 23: North America Market Value Share and BPS Analysis by Country, 2025 and 2035
  • Figure 24: North America Market Value Share and BPS Analysis by Form, 2025 and 2035
  • Figure 25: North America Market Y-o-Y Growth Comparison by Form, 2025 to 2035
  • Figure 26: North America Market Attractiveness Analysis by Form
  • Figure 27: North America Market Value Share and BPS Analysis by Source, 2025 and 2035
  • Figure 28: North America Market Y-o-Y Growth Comparison by Source, 2025 to 2035
  • Figure 29: North America Market Attractiveness Analysis by Source
  • Figure 30: North America Market Value Share and BPS Analysis by End Use, 2025 and 2035
  • Figure 31: North America Market Y-o-Y Growth Comparison by End Use, 2025 to 2035
  • Figure 32: North America Market Attractiveness Analysis by End Use
  • Figure 33: Latin America Market Value Share and BPS Analysis by Country, 2025 and 2035
  • Figure 34: Latin America Market Value Share and BPS Analysis by Form, 2025 and 2035
  • Figure 35: Latin America Market Y-o-Y Growth Comparison by Form, 2025 to 2035
  • Figure 36: Latin America Market Attractiveness Analysis by Form
  • Figure 37: Latin America Market Value Share and BPS Analysis by Source, 2025 and 2035
  • Figure 38: Latin America Market Y-o-Y Growth Comparison by Source, 2025 to 2035
  • Figure 39: Latin America Market Attractiveness Analysis by Source
  • Figure 40: Latin America Market Value Share and BPS Analysis by End Use, 2025 and 2035
  • Figure 41: Latin America Market Y-o-Y Growth Comparison by End Use, 2025 to 2035
  • Figure 42: Latin America Market Attractiveness Analysis by End Use
  • Figure 43: Western Europe Market Value Share and BPS Analysis by Country, 2025 and 2035
  • Figure 44: Western Europe Market Value Share and BPS Analysis by Form, 2025 and 2035
  • Figure 45: Western Europe Market Y-o-Y Growth Comparison by Form, 2025 to 2035
  • Figure 46: Western Europe Market Attractiveness Analysis by Form
  • Figure 47: Western Europe Market Value Share and BPS Analysis by Source, 2025 and 2035
  • Figure 48: Western Europe Market Y-o-Y Growth Comparison by Source, 2025 to 2035
  • Figure 49: Western Europe Market Attractiveness Analysis by Source
  • Figure 50: Western Europe Market Value Share and BPS Analysis by End Use, 2025 and 2035
  • Figure 51: Western Europe Market Y-o-Y Growth Comparison by End Use, 2025 to 2035
  • Figure 52: Western Europe Market Attractiveness Analysis by End Use
  • Figure 53: Eastern Europe Market Value Share and BPS Analysis by Country, 2025 and 2035
  • Figure 54: Eastern Europe Market Value Share and BPS Analysis by Form, 2025 and 2035
  • Figure 55: Eastern Europe Market Y-o-Y Growth Comparison by Form, 2025 to 2035
  • Figure 56: Eastern Europe Market Attractiveness Analysis by Form
  • Figure 57: Eastern Europe Market Value Share and BPS Analysis by Source, 2025 and 2035
  • Figure 58: Eastern Europe Market Y-o-Y Growth Comparison by Source, 2025 to 2035
  • Figure 59: Eastern Europe Market Attractiveness Analysis by Source
  • Figure 60: Eastern Europe Market Value Share and BPS Analysis by End Use, 2025 and 2035
  • Figure 61: Eastern Europe Market Y-o-Y Growth Comparison by End Use, 2025 to 2035
  • Figure 62: Eastern Europe Market Attractiveness Analysis by End Use
  • Figure 63: East Asia Market Value Share and BPS Analysis by Country, 2025 and 2035
  • Figure 64: East Asia Market Value Share and BPS Analysis by Form, 2025 and 2035
  • Figure 65: East Asia Market Y-o-Y Growth Comparison by Form, 2025 to 2035
  • Figure 66: East Asia Market Attractiveness Analysis by Form
  • Figure 67: East Asia Market Value Share and BPS Analysis by Source, 2025 and 2035
  • Figure 68: East Asia Market Y-o-Y Growth Comparison by Source, 2025 to 2035
  • Figure 69: East Asia Market Attractiveness Analysis by Source
  • Figure 70: East Asia Market Value Share and BPS Analysis by End Use, 2025 and 2035
  • Figure 71: East Asia Market Y-o-Y Growth Comparison by End Use, 2025 to 2035
  • Figure 72: East Asia Market Attractiveness Analysis by End Use
  • Figure 73: South Asia & Pacific Market Value Share and BPS Analysis by Country, 2025 and 2035
  • Figure 74: South Asia & Pacific Market Value Share and BPS Analysis by Form, 2025 and 2035
  • Figure 75: South Asia & Pacific Market Y-o-Y Growth Comparison by Form, 2025 to 2035
  • Figure 76: South Asia & Pacific Market Attractiveness Analysis by Form
  • Figure 77: South Asia & Pacific Market Value Share and BPS Analysis by Source, 2025 and 2035
  • Figure 78: South Asia & Pacific Market Y-o-Y Growth Comparison by Source, 2025 to 2035
  • Figure 79: South Asia & Pacific Market Attractiveness Analysis by Source
  • Figure 80: South Asia & Pacific Market Value Share and BPS Analysis by End Use, 2025 and 2035
  • Figure 81: South Asia & Pacific Market Y-o-Y Growth Comparison by End Use, 2025 to 2035
  • Figure 82: South Asia & Pacific Market Attractiveness Analysis by End Use
  • Figure 83: Middle East and Africa Market Value Share and BPS Analysis by Country, 2025 and 2035
  • Figure 84: Middle East and Africa Market Value Share and BPS Analysis by Form, 2025 and 2035
  • Figure 85: Middle East and Africa Market Y-o-Y Growth Comparison by Form, 2025 to 2035
  • Figure 86: Middle East and Africa Market Attractiveness Analysis by Form
  • Figure 87: Middle East and Africa Market Value Share and BPS Analysis by Source, 2025 and 2035
  • Figure 88: Middle East and Africa Market Y-o-Y Growth Comparison by Source, 2025 to 2035
  • Figure 89: Middle East and Africa Market Attractiveness Analysis by Source
  • Figure 90: Middle East and Africa Market Value Share and BPS Analysis by End Use, 2025 and 2035
  • Figure 91: Middle East and Africa Market Y-o-Y Growth Comparison by End Use, 2025 to 2035
  • Figure 92: Middle East and Africa Market Attractiveness Analysis by End Use
  • Figure 93: Global Market - Tier Structure Analysis
  • Figure 94: Global Market - Company Share Analysis

Frequently Asked Questions

What is the projected size of the global animal digest market by 2035?

The global animal digest market is anticipated to reach USD 208.3 million by 2035.

What is the estimated market size of the animal digest industry in 2025?

The market is forecast to be valued at USD 124.2 million in 2025.

What is the expected CAGR for the animal digest market from 2025 to 2035?

The market is expected to grow at a compound annual growth rate of 5.3% during the forecast period.

Which form is expected to lead the animal digest market in 2025?

Liquid animal digest is expected to dominate the form segment with a 55% market share in 2025.

Which end-use category will account for the largest market share in 2025?

Dog food applications are projected to lead end use, capturing a 55% share of the market in 2025.

Explore Similar Insights

Future Market Insights

Animal Digest Market