Animal Feed Probiotics Market
Market Insights on Animal Feed Probiotics covering sales outlook, demand forecast & up-to-date key trends
Animal Feed Probiotics Market By Source (Bacteria, Non Bacteria), Animal (Companion Animal, Livestock, Equine, Swine, and Aquaculture), Form (Liquid, Dry) & Region - Forecast 2021-2031
Animal Feed Probiotics Market Outlook
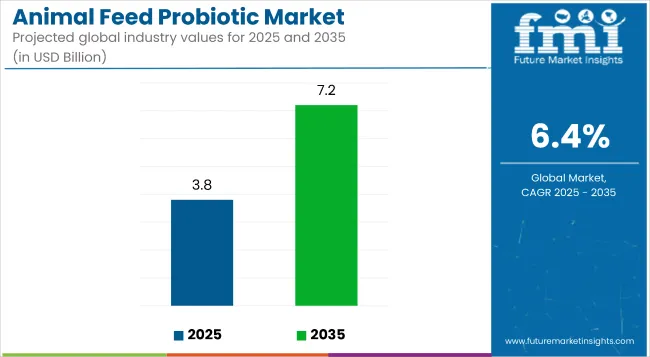
The animal feed probiotics market value is expected to total US$ 3,113.3 Mn in 2021, according to Future Market Insights (FMI). The overall animal feed probiotics market value is expected to reach US$ 6,997.2 Mn by 2031, growing at a CAGR of 8.4%.
Attributes |
Details |
Animal Feed Probiotics Market (CAGR) |
8.4% |
Animal Feed Probiotics Market (2021) |
US$ 3,113.3 Mn |
Animal Feed Probiotics Market (2031) |
US$ 6,997.2 Mn |
The increasing consumption of animal protein has put pressure on livestock farmers to maintain enough nutritional supplements in feeds, which has resulted in a strong demand for animal feed probiotics.
Regulatory scrutiny on food derived from an animal source, including meat, chicken, eggs, and beef and aversion to antibiotic-fed farm animals, will fuel the demand for animal feed probiotics and sales of animal feed probiotics in the coming years.
Given the rapid growth in animal product consumption over the last two decades, and the likelihood of further growth in demand for animal feed probiotics, particularly in emerging markets, there is increasing pressure on the livestock sector to produce more with limited resources.
Maintaining and improving animal performance and preventing and controlling enteric infections are two of the most significant goals for employing probiotics in animal feed.
Let us know your requirement to get
100% FREE customization
How is Growth in Consumption of Quality Animal-based Products Impacting the Demand for Animal Feed Probiotics
Several changes in dietary preferences and consumption patterns of people around the world have been documented, including a move toward the increasing intake of meat and dairy products resulting in increased sales of animal feed probiotics.
The rising demand for animal products such as dairy, meat products, and other non-food goods has resulted in escalating demand for animal feed probiotics, boosting the animal feed probiotics market.
Food demand has increased across the world as a result of the fast population growth. Consumers are growing more health-conscious, emphasizing nutrient-dense diets, which are delivered through enhanced feed products provided to animals.
The livestock sector is under enormous strain to meet the expanding global demand for high-value animal products demand for animal feed probiotics.
Irritable bowel syndrome, viral diarrhea, inflammatory bowel disease, and antibiotic-related diarrhea can all be helped by probiotics in animal feed. This allows animals to get the most nutrition from their feed, improving the quality of animal products without causing a drop in sales of animal feed probiotics.
Will Continuous Product Innovation Reduce the Cost of Production of Animal Feed Probiotics in the Long Run?
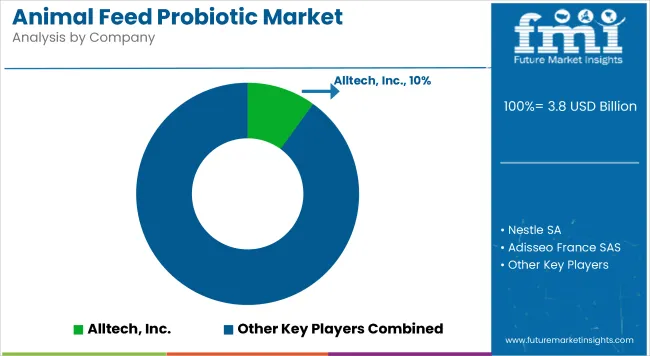
Some of the leading animal feed probiotics market players such as DuPont, Alltech and others have stepped up their efforts with different and unique products such as non-bacteria animal feed probiotics.
Through the launch of these products and robust marketing strategies, they intend to cater to the increasing demand for animal feed probiotics and sales of animal feed probiotics.
Improved sources to manufacture quality feed probiotics, innovative processes, and advanced transportation facilities to reach international customers are different factors aiding cost reduction.
Hence the price of animal feed probiotics is expected to reduce further in the global animal feed probiotics market.
Find your sweet spots for generating winning opportunities in this market.
Talk to AnalystWhat is the Impact of COVID-19 on the Animal Feed Probiotics Market?
Animal feed probiotics labeling may be subjected to enhanced scrutiny following the COVID-19 pandemic. More information on the potential role of food in the transmission of the virus through local and international trade is being sought by national food safety authorities and the International Food Safety Authorities Network (INFOSAN) Secretariat.
Meanwhile, the World Health Organization has recommended specific standards to maintain food hygiene and food safety practices to prevent transmission of COVID-19 through food.
Clean label legal animal feed probiotics products in the animal feed probiotics market will be in high demand for animal feed probiotics due to these trends. The recovery of the global economy would eventually lead to an increase in per capita income and the adoption of healthier animal lives, which will boost the animal feed probiotics market in the forecast period.
What is the Growth Opportunity of the Animal Feed Probiotics Market in the U.S.?
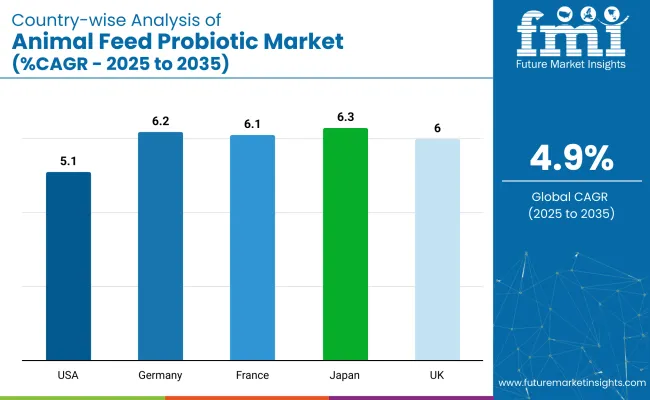
Growing awareness about the benefits of probiotics for animal health is creating a big opportunity for animal feed probiotics market manufacturers. The U.S. animal feed probiotics market is projected to register a CAGR of 4.7% during the forecast period.
Increasing industrialized livestock production, as well as rising demand for animal feed probiotics market for companion animals and cattle, is contributing to the expansion of the market and boosting of sales of animal feed probiotics.
Furthermore, the U.S. is a well-established industry with a strong demand for organic meat, which has driven farmers to improve product quality, favorably impacting the animal feed probiotic market.

An unified Market Research Subscription Platform, built for today’s disparate research needs.
How is Increasing Demand for High-Value Animal Protein Driving Sales of Animal Feed Probiotics in the Philippines?
According to the study, the animal feed probiotics market of the Philippines is estimated to be valued at US$ 160.6 Mn in the year 2021.
The Philippines have a reputation for being one of Asia's leading exporters of aquaculture yields in the animal feed probiotics market. These shifts in consumption, combined with significant population growth, have resulted in significant increases in the country's total demand for animal feed probiotics. This tendency is projected to continue in the following years as well.
Thus, increase in demand for various animal products, such as milk, dairy products, meat products, eggs, and other non-food items, has led to the growth in the demand for animal feed probiotics as well as sales of animal feed probiotics, thereby boosting the animal feed probiotics market.
Are there Potential Opportunities for New Product Categories in India for Animal Feed Probiotics Market?
According to FMI, the animal feed probiotics market of India is estimated to be valued at US$ 208.5 Mn in the year 2021.
The true potential of the animal feed probiotics market manufacturers lies in targeting emerging economies that are fast becoming opportunity hotbeds for various animal feed probiotics markets.
India offers greater potential for manufacturers to address the dietary shifts of cattle and poultry farm owners towards high-value products while catering to local needs and tastes.
With a dramatic increase in the number of pet owners, spending on quality meat products is on the rise. This is creating growth opportunities for demand for animal feed probiotics in the animal feed probiotics market manufacturers across the India animal feed probiotics value chain, and geographical expansion is no longer a secondary growth strategy.
What is the Analysis for Sales of Animal Feed Probiotics in China?
According to FMI's, China the animal feed probiotics market is forecast to grow at a CAGR of 2.6%. Major revenue-generating countries support the Asia Pacific region, with China at the top of the list.
Due to the adaptation of an urbanized lifestyle, China has a big population base, as well as an increase in the number of middle-class people who are opting for food products with health benefits. As a result, China's demand for poultry products has surged, propelling the growth of demand for animal feed probiotics in the country.
What is the Competitive Landscape of the Animal Feed Probiotics Market?
Leading animal feed probiotics market players are now focusing on certain animal species, such as cattle, dogs, or horses, and introducing products appropriately, resulting in increased customer interest.
In July 2021- Alltech addressed one of the hot topics at the recent virtual "Alltech ONE ideas conference" were how to feed livestock in the future by several speakers, who discussed how to take into account the carbon footprint, sustainable feed sources and human and animal health, while producing enough food in the future.
In May 2021- Alltech introduced a new line of Lifeforce™ premium equine supplements to the market, backed by more than 40 years of scientific research and formulated with field-proven technologies.
In July 2021- DuPont (Animal Nutrition) launched an expansion of the industry-leading novel phytase enzyme, Axtra® PHY GOLD, in Malaysia, Thailand and Australia. At the same time, Axtra® PHY GOLD was first launched in India in 2020 and will eventually be available across all markets in the Asia Pacific, pending regulatory authorizations.
Scope Of The Report
Report Attribute |
Details |
Growth rate |
CAGR of 8.4% from 2022 to 2032 |
Base year for estimation |
2021 |
Historical data |
2015 - 2020 |
Forecast period |
2022 - 2032 |
Quantitative units |
Revenue in USD billion, volume in kilotons, and CAGR from 2022 to 2032 |
Report coverage |
Revenue forecast, volume forecast, company ranking, competitive landscape, growth factors, and trends, Pricing Analysis, |
Segments covered |
Source, Animal, Form, Distribution Channel, Region |
Regional scope |
North America; Western Europe, Eastern Europe, Middle East, Africa, ASEAN, South Asia, Rest of Asia, Australia and New Zealand |
Country scope |
U.S.; Canada; Mexico; Germany; U.K.; France; Italy; Spain; Russia; Belgium; Poland; Czech Republic; China; India; Japan; Australia; Brazil; Argentina; Colombia; Saudi Arabia; UAE; Iran; South Africa |
Key companies profiled |
Du Chr. Hansen (Denmark), Koninklijke DSM N.V. (Netherlands), DuPont (US), Evonik Industries (Germany), Land O'Lakes (US), Mitsui & Co., Ltd. (Japan), Ohly (Denmark), Lesaffre (France), Alltech (US), Novozymes (Denmark), Calpis Co., Ltd. (Japan), Unique Biotech (India), and Pure Cultures (US). |
Customization scope |
Free report customization (equivalent to up to 8 analysts working days) with purchase. Addition or alteration to country, regional & segment scope. |
Pricing and purchase options |
Avail customized purchase options to meet your exact research needs. |
Frequently Asked Questions
The animal feed probiotics market is forecasted to register a CAGR of 8.4% during the forecast period.
Key players holding substantial animal feed probiotics market include Chr. Hansen (Denmark), Koninklijke DSM N.V. (Netherlands), DuPont (US), Evonik Industries (Germany), Land O'Lakes (US).
As per the analysis, the animal feed probiotics market share is likely to be US$ 6,997.2 Mn by 2031.
The demand for animal feed probiotics is expected to continue strong as consumers become more aware of their advantages and are prepared to pay more for premium goods that include animal feed probiotics market.
Table of Content
1. Executive Summary
1.1. Key Market Statistics and Analysis
1.2. Competition Blueprint
1.3. Market Theme
2. Scenario Assessment of the Impact of COVID-19 on Animal Feed Probiotics Market
2.1. Current Scenario/Immediate Action
2.2. Market Scenario and Forward Path
2.2.1. Optimistic Scenario
2.2.1.1. Greater china
2.2.1.2. US
2.2.1.3. Europe
2.2.1.4. Philippines
2.2.2. Likely Scenario
2.2.2.1. Greater china
2.2.2.2. US
2.2.2.3. Europe
2.2.2.4. Philippines
2.2.3. Pessimistic Scenario
2.2.3.1. Greater china
2.2.3.2. US
2.2.3.3. Europe
2.2.3.4. Philippines
2.3. Key Factors Impacting the Market
3. Production and Trade Assessment
3.1. Global Animal Feed Probiotics Apparent Production Capacity Forecast, 2016-2031
3.2. Global Animal Feed Probiotics Apparent Production Capacity by Region, 2020
3.3. Global Animal Feed Probiotics Trade Statistics – Import and Export Analysis, 2020
3.4. Animal Feed Probiotics Market, Production, Consumption, and Trade Analysis
4. Global Animal Feed Probiotics Production and Market Outlook
4.1. Innovation in product and Consumer Response
4.2. Selection of Microbial Strains and Processing
4.3. Key Trends Impacting the Market
5. Market Overview
5.1. Market Coverage / Taxonomy
5.2. Market Definition / Scope / Limitations
5.3. Key Market Trends
5.3.1. Key Trends Impacting the Market
5.3.2. Product Innovation / Development Trends
6. Market Background
6.1. Macro-economic Factors
6.1.1. Per-Capita Consumption Expenditure
6.1.2. Embracing Transparency
6.1.3. Buyer Awareness
6.1.4. Strengthened Distribution to least Penetrated Potential Markets
6.2. Forecast Factors - Relevance & Impact
6.2.1. Increasing Livestock and Companion Animals
6.2.2. Growing E-Commerce
6.2.3. Increasing Number of Small & Medium Scale Producers
6.2.4. Demand for Ethical and Sustainable Products
6.3. Key Success Factors
7. Market Dynamics
7.1. Drivers
7.2. Restraints
7.3. Opportunity
8. Policy and Regulatory Landscape
8.1. Generally Regarded As Safe (GRAS)
8.2. European Food Safety Authority (EFSA)
9. Supply Chain Analysis
9.1. Profitability and Gross Margin Analysis By Competition
9.2. List of Active Participants
9.2.1. Raw Material Suppliers
9.2.2. Key Manufacturers
9.2.3. Key Distributor/Retailers
10. Global Animal Feed Probiotics Market - Pricing Analysis
10.1. Regional Pricing Analysis (US$/MT) By Source
10.2. Global Average Pricing Analysis Benchmark
10.3. Key factors Impacting the Pricing
11. Global Animal Feed Probiotics Market Demand Analysis 2016-2020 and Forecast, 2021-2031
11.1. Historical Market Volume (MT) Analysis, 2016-2020
11.2. Current and Future Market Volume (MT) Projections, 2021-2031
11.3. Y-o-Y Growth Trend Analysis Optimistic Scenario
12. Global Animal Feed Probiotics Market Demand (Size in US$ Mn) Analysis 2016-2020 and Forecast, 2021-2031
12.1. Historical Market Value (US$ Mn) Analysis, 2016-2020
12.2. Current and Future Market Value (US$ Mn) Projections, 2021-2031
12.2.1. Y-o-Y Growth Trend Analysis
12.2.2. Absolute $ Opportunity Analysis Country of Operation
13. Global Animal Feed Probiotics Market Analysis 2016-2020 and Forecast 2021-2031, By Source
13.1. Introduction / Key Findings
13.2. Historical Market Size (US$ Mn) and Volume (MT) Analysis By Source, 2016-2020
13.3. Current and Future Market Size (US$ Mn) and Volume (MT) Analysis and Forecast By Source, 2021-2031
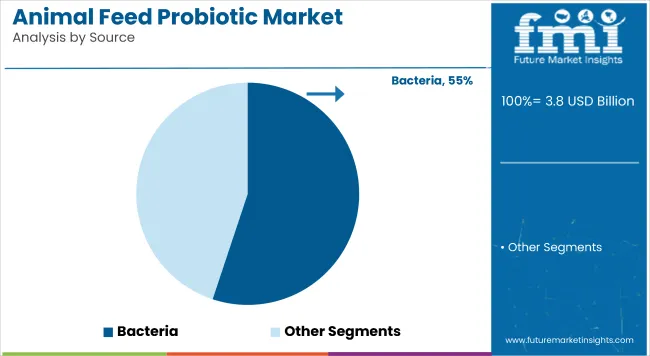
13.3.1. Bacteria
13.3.1.1. Bifidobacterium
13.3.1.2. Enterococcus
13.3.1.3. Lactobacillus
13.3.1.3.1. Homofermentative
13.3.1.3.2. Heterofermentative
13.3.1.4. Pediococcus
13.3.1.5. Bacillus
13.3.1.6. Propionibacterium
13.3.1.7. SACCHAROMYCES
13.3.1.8. Streptococcus
13.3.1.9. Aspergillus
13.3.1.10. Others*
13.3.2. Non Bacteria
13.3.2.1. Yeast
13.3.2.2. Fungal
13.3.2.3. Aroma Chemicals
13.4. Market Attractiveness Analysis By Source
14. Global Animal Feed Probiotics Market Analysis 2016-2020 and Forecast 2021-2031, By Animal
14.1. Introduction / Key Findings
14.2. Historical Market Size (US$ Mn) and Volume (MT) Analysis By Animal , 2016-2020
14.3. Current and Future Market Size (US$ Mn) and Volume (MT) Analysis and Forecast By Animal , 2021-2031
14.3.1.1. Companion Animals
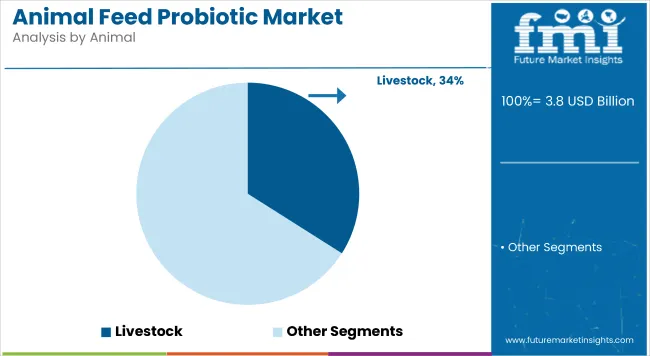
14.3.1.2. Livestock
14.3.1.2.1. Cattle
14.3.1.2.2. Poultry
14.3.1.2.2.1. Broilers
14.3.1.2.2.2. Turkey
14.3.1.2.2.3. Layers
14.3.1.3. Equine
14.3.1.4. Swine
14.3.1.5. Aquaculture
14.4. Market Attractiveness Analysis By Animal
15. Global Animal Feed Probiotics Market Analysis 2016-2020 and Forecast 2021-2031, By Form
15.1. Introduction / Key Findings
15.2. Historical Market Size (US$ Mn) and Volume (MT) Analysis By Form , 2016-2020
15.3. Current and Future Market Size (US$ Mn) and Volume (MT) Analysis and Forecast By Form , 2021-2031
15.3.1. Liquid
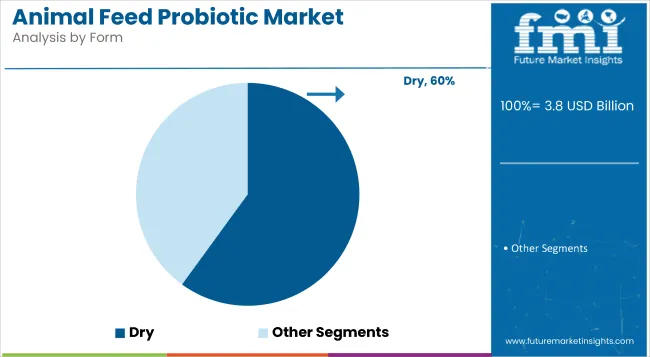
15.3.2. Dry
15.4. Market Attractiveness Analysis By Form
16. Global Animal Feed Probiotics Market Analysis 2016-2020 and Forecast 2021-2031, By Sales Channel
16.1. Introduction / Key Findings
16.2. Historical Market Size (US$ Mn) and Volume (MT) Analysis By Sales Channel , 2016-2020
16.3. Current and Future Market Size (US$ Mn) and Volume (MT) Analysis and Forecast By Sales Channel , 2021-2031
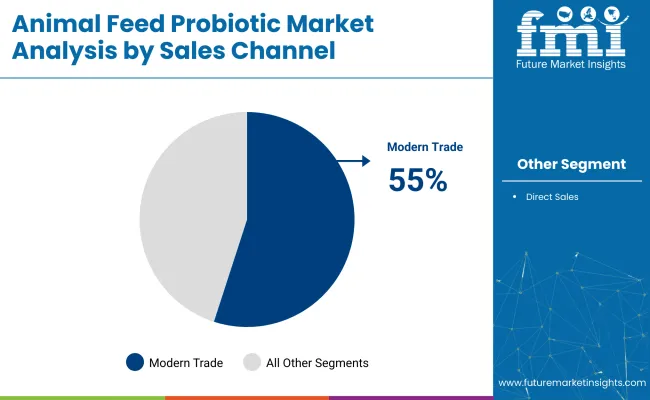
16.3.1. Modern Trade
16.3.2. Direct Sales
16.3.3. Specialty Stores
16.3.4. Convenience Stores
16.3.5. Online Retailers
16.4. Market Attractiveness Analysis By Sales Channel
17. Global Animal Feed Probiotics Market Analysis 2016-2020 and Forecast 2021-2031, By Region
17.1. Introduction
17.2. Historical Market Size (US$ Mn) and Volume (MT) Analysis By Country, 2016-2020
17.3. Current Market Size (US$ Mn) and Volume (MT) Analysis and Forecast By Region, 2021-2031
17.3.1. North America
17.3.2. Latin America
17.3.3. Europe
17.3.4. CIS and Russia
17.3.5. APEJ
17.3.6. Japan
17.3.7. MEA
17.3.8. Philippines
17.4. Market Attractiveness Analysis By Region
18. North America Animal Feed Probiotics Market Analysis 2016-2020 and Forecast 2021-2031
18.1. Introduction
18.2. Historical Market Size (US$ Mn) and Volume Trend Analysis By Market Taxonomy, 2016-2020
18.3. Market Size (US$ Mn) and Volume Forecast By Market Taxonomy, 2021-2031
18.3.1. By Country
18.3.1.1. U.S. (Market Share Analysis 2016, 2021)
18.3.1.1.1. By Source
18.3.1.1.2. By Animal
18.3.1.1.3. By Form
18.3.1.1.4. By Sales Channel
18.3.1.2. Canada(Market Share Analysis 2016, 2021)
18.3.1.2.1. By Source
18.3.1.2.2. By Animal
18.3.1.2.3. By Form
18.3.1.2.4. By Sales Channel
18.3.2. By Source
18.3.3. By Animal
18.3.4. By Form
18.3.5. By Sales Channel
18.4. Market Attractiveness Analysis
18.4.1. By Source
18.4.2. By Animal
18.4.3. By Form
18.4.4. By Sales Channel
18.5. Market Trends
18.6. Drivers and Restraints - Impact Analysis
19. Latin America Animal Feed Probiotics Market Analysis 2016-2020 and Forecast 2021-2031
19.1. Introduction
19.2. Historical Market Size (US$ Mn) and Volume Trend Analysis By Market Taxonomy, 2016-2020
19.3. Market Size (US$ Mn) and Volume Forecast By Market Taxonomy, 2021-2031
19.3.1. By Country
19.3.1.1. Brazil(Market Share Analysis 2016, 2021)
19.3.1.1.1. By Source
19.3.1.1.2. By Animal
19.3.1.1.3. By Form
19.3.1.1.4. By Sales Channel
19.3.1.2. Mexico(Market Share Analysis 2016, 2021)
19.3.1.2.1. By Source
19.3.1.2.2. By Animal
19.3.1.2.3. By Form
19.3.1.2.4. By Sales Channel
19.3.1.3. Argentina (Market Share Analysis 2016, 2021)
19.3.1.3.1. By Source
19.3.1.3.2. By Animal
19.3.1.3.3. By Form
19.3.1.3.4. By Sales Channel
19.3.1.4. Peru (Market Share Analysis 2016, 2021)
19.3.1.4.1. By Source
19.3.1.4.2. By Animal
19.3.1.4.3. By Form
19.3.1.4.4. By Sales Channel
19.3.1.5. Chile (Market Share Analysis 2016, 2021)
19.3.1.5.1. By Source
19.3.1.5.2. By Animal
19.3.1.5.3. By Form
19.3.1.5.4. By Sales Channel
19.3.1.6. Rest of Latin America (Market Share Analysis 2016, 2021)
19.3.1.6.1. By Source
19.3.1.6.2. By Animal
19.3.1.6.3. By Form
19.3.1.6.4. By Sales Channel
19.3.2. By Source
19.3.3. By Animal
19.3.4. By Form
19.3.5. By Sales Channel
19.4. Market Attractiveness Analysis
19.4.1. By Source
19.4.2. By Animal
19.4.3. By Form
19.4.4. By Sales Channel
19.5. Market Trends
19.6. Drivers and Restraints - Impact Analysis
20. Europe Animal Feed Probiotics Market Analysis 2016-2020 and Forecast 2021-2031
20.1. Introduction
20.2. Historical Market Size (US$ Mn) and Volume Trend Analysis By Market Taxonomy, 2016-2020
20.3. Market Size (US$ Mn) and Volume Forecast By Market Taxonomy, 2021-2031
20.3.1. By Country
20.3.1.1. EU-4(Market Share Analysis 2016, 2021)
20.3.1.1.1. By Source
20.3.1.1.2. By Animal
20.3.1.1.3. By Form
20.3.1.1.4. By Sales Channel
20.3.1.2. UK(Market Share Analysis 2016, 2021)
20.3.1.2.1. By Source
20.3.1.2.2. By Animal
20.3.1.2.3. By Form
20.3.1.2.4. By Sales Channel
20.3.1.3. BENELUX(Market Share Analysis 2016, 2021)
20.3.1.3.1. By Source
20.3.1.3.2. By Animal
20.3.1.3.3. By Form
20.3.1.3.4. By Sales Channel
20.3.1.4. Nordic(Market Share Analysis 2016, 2021)
20.3.1.4.1. By Source
20.3.1.4.2. By Animal
20.3.1.4.3. By Form
20.3.1.4.4. By Sales Channel
20.3.1.5. Eastern Europe(Market Share Analysis 2016, 2021)
20.3.1.5.1. By Source
20.3.1.5.2. By Animal
20.3.1.5.3. By Form
20.3.1.5.4. By Sales Channel
20.3.1.6. Rest of Europe
20.3.1.6.1. By Source
20.3.1.6.2. By Animal
20.3.1.6.3. By Form
20.3.1.6.4. By Sales Channel
20.3.2. By Source
20.3.3. By Animal
20.3.4. By Form
20.3.5. By Sales Channel
20.4. Market Attractiveness Analysis
20.4.1. By Source
20.4.2. By Animal
20.4.3. By Form
20.4.4. By Sales Channel
20.5. Market Trends
20.6. Drivers and Restraints - Impact Analysis
21. CIS & Russia Animal Feed Probiotics Market Analysis 2016-2020 and Forecast 2021-2031
21.1. Introduction
21.2. Historical Market Size (US$ Mn) and Volume Trend Analysis By Market Taxonomy, 2016-2020
21.3. Market Size (US$ Mn) and Volume Forecast By Market Taxonomy, 2021-2031
21.3.1. By Source
21.3.2. By Animal
21.3.3. By Form
21.3.4. By Sales Channel
21.4. Market Attractiveness Analysis
21.4.1. By Source
21.4.2. By Animal
21.4.3. By Form
21.4.4. By Sales Channel
21.5. Market Trends
21.6. Drivers and Restraints - Impact Analysis
22. APEJ Animal Feed Probiotics Market Analysis 2016-2020 and Forecast 2021-2031
22.1. Introduction
22.2. Historical Market Size (US$ Mn) and Volume Trend Analysis By Market Taxonomy, 2016-2020
22.3. Market Size (US$ Mn) and Volume Forecast By Market Taxonomy, 2021-2031
22.3.1. By Country
22.3.1.1. Greater China(Market Share Analysis 2016, 2021)
22.3.1.1.1. By Source
22.3.1.1.2. By Animal
22.3.1.1.3. By Form
22.3.1.1.4. By Sales Channel
22.3.1.2. India(Market Share Analysis 2016, 2021)
22.3.1.2.1. By Source
22.3.1.2.2. By Animal
22.3.1.2.3. By Form
22.3.1.2.4. By Sales Channel
22.3.1.3. Australia& New Zealand(Market Share Analysis 2016, 2021)
22.3.1.3.1. By Source
22.3.1.3.2. By Animal
22.3.1.3.3. By Form
22.3.1.3.4. By Sales Channel
22.3.1.4. ASEAN(Market Share Analysis 2016, 2021)
22.3.1.4.1. By Source
22.3.1.4.2. By Animal
22.3.1.4.3. By Form
22.3.1.4.4. By Sales Channel
22.3.1.5. South Of Korea(Market Share Analysis 2016, 2021)
22.3.1.5.1. By Source
22.3.1.5.2. By Animal
22.3.1.5.3. By Form
22.3.1.5.4. By Sales Channel
22.3.1.6. Rest of APEJ
22.3.1.6.1. By Source
22.3.1.6.2. By Animal
22.3.1.6.3. By Form
22.3.1.6.4. By Sales Channel
22.3.2. By Source
22.3.3. By Animal
22.3.4. By Form
22.3.5. By Sales Channel
22.4. Market Attractiveness Analysis
22.4.1. By Source
22.4.2. By Animal
22.4.3. By Form
22.4.4. By Sales Channel
22.5. Market Trends
22.6. Drivers and Restraints - Impact Analysis
23. Japan Animal Feed Probiotics Market Analysis 2016-2020 and Forecast 2021-2031
23.1. Introduction
23.2. Historical Market Size (US$ Mn) and Volume Trend Analysis By Market Taxonomy, 2016-2020
23.3. Market Size (US$ Mn) and Volume Forecast By Market Taxonomy, 2021-2031
23.3.1. By Source
23.3.2. By Animal
23.3.3. By Form
23.3.4. By Sales Channel
23.4. Market Attractiveness Analysis
23.4.1. By Source
23.4.2. By Animal
23.4.3. By Form
23.4.4. By Sales Channel
23.5. Market Trends
23.6. Drivers and Restraints - Impact Analysis
24. Middle East and Africa Animal Feed Probiotics Market Analysis 2016-2020 and Forecast 2021-2031
24.1. Introduction
24.2. Historical Market Size (US$ Mn) and Volume Trend Analysis By Market Taxonomy, 2016-2020
24.3. Market Size (US$ Mn) and Volume Forecast By Market Taxonomy, 2021-2031
24.3.1. By Country
24.3.1.1. GCC Countries(Market Share Analysis 2016, 2021)
24.3.1.1.1. By Source
24.3.1.1.2. By Animal
24.3.1.1.3. By Form
24.3.1.1.4. By Sales Channel
24.3.1.2. South Africa(Market Share Analysis 2016, 2021)
24.3.1.2.1. By Source
24.3.1.2.2. By Animal
24.3.1.2.3. By Form
24.3.1.2.4. By Sales Channel
24.3.1.3. Turkey(Market Share Analysis 2016, 2021)
24.3.1.3.1. By Source
24.3.1.3.2. By Animal
24.3.1.3.3. By Form
24.3.1.3.4. By Sales Channel
24.3.1.4. Iran(Market Share Analysis 2016, 2021)
24.3.1.4.1. By Source
24.3.1.4.2. By Animal
24.3.1.4.3. By Form
24.3.1.4.4. By Sales Channel
24.3.1.5. Israel(Market Share Analysis 2016, 2021)
24.3.1.5.1. By Source
24.3.1.5.2. By Animal
24.3.1.5.3. By Form
24.3.1.5.4. By Sales Channel
24.3.1.6. Rest of Middle East and Africa
24.3.1.6.1. By Source
24.3.1.6.2. By Animal
24.3.1.6.3. By Form
24.3.1.6.4. By Sales Channel
24.3.2. By Source
24.3.3. By Animal
24.3.4. By Form
24.3.5. By Sales Channel
24.4. Market Attractiveness Analysis
24.4.1. By Source
24.4.2. By Animal
24.4.3. By Form
24.4.4. By Sales Channel
24.5. Market Trends
24.6. Drivers and Restraints - Impact Analysis
25. Philippines Animal Feed Probiotics Market Demand (Size in US$ Mn) Analysis 2016-2020 and Forecast, 2021-2031
25.1. Introduction
25.2. Historical Market Size (US$ Mn) and Volume Trend Analysis By Market Taxonomy, 2016-2020
25.3. Market Size (US$ Mn) and Volume Forecast By Market Taxonomy, 2021-2031
25.3.1. By Source
25.3.2. By Animal
25.3.3. By Form
25.3.4. By Sales Channel
25.4. Market Attractiveness Analysis
25.4.1. By Source
25.4.2. By Animal
25.4.3. By Form
25.4.4. By Sales Channel
25.5. Key Market Trends
26. Market Structure Analysis- Global Assessment
26.1. Company Dashboard
26.2. Industry Structure Analysis by Tier of Companies, 2021E
26.3. Company Share Analysis of Top Players, 2021E
26.3.1. Company Share By Source
26.3.2. Company Share By Region
26.4. Competition Benchmarking- Matrix
27. Competition Deep Dive
27.1.1. Alltech
27.1.1.1. Overview
27.1.1.2. Product Portfolio
27.1.1.3. Profitability by Market Segments (Product/Channel/Country)
27.1.1.4. Sales Footprint
27.1.1.5. Strategy Overview
27.1.1.5.1. Marketing Strategy
27.1.1.5.2. Product Strategy
27.1.2. Danisco Animal Nutrition (Dupont)
27.1.2.1. Overview
27.1.2.2. Product Portfolio
27.1.2.3. Profitability by Market Segments (Product/Channel/Country)
27.1.2.4. Sales Footprint
27.1.2.5. Strategy Overview
27.1.2.5.1. Marketing Strategy
27.1.2.5.2. Product Strategy
27.1.3. Chr. Hansen Holding A/S
27.1.3.1. Overview
27.1.3.2. Product Portfolio
27.1.3.3. Profitability by Market Segments (Product/Channel/Country)
27.1.3.4. Sales Footprint
27.1.3.5. Strategy Overview
27.1.3.5.1. Marketing Strategy
27.1.3.5.2. Product Strategy
27.1.4. Evonik Industries AG
27.1.4.1. Overview
27.1.4.2. Product Portfolio
27.1.4.3. Profitability by Market Segments (Product/Channel/Country)
27.1.4.4. Sales Footprint
27.1.4.5. Strategy Overview
27.1.4.5.1. Marketing Strategy
27.1.4.5.2. Product Strategy
27.1.5. Novus International, Inc.
27.1.5.1. Overview
27.1.5.2. Product Portfolio
27.1.5.3. Profitability by Market Segments (Product/Channel/Country)
27.1.5.4. Sales Footprint
27.1.5.5. Strategy Overview
27.1.5.5.1. Marketing Strategy
27.1.5.5.2. Product Strategy
27.1.6. Royal DSM
27.1.6.1. Overview
27.1.6.2. Product Portfolio
27.1.6.3. Profitability by Market Segments (Product/Channel/Country)
27.1.6.4. Sales Footprint
27.1.6.5. Strategy Overview
27.1.6.5.1. Marketing Strategy
27.1.6.5.2. Product Strategy
27.1.7. Lallemand
27.1.7.1. Overview
27.1.7.2. Product Portfolio
27.1.7.3. Profitability by Market Segments (Product/Channel/Country)
27.1.7.4. Sales Footprint
27.1.7.5. Strategy Overview
27.1.7.5.1. Marketing Strategy
27.1.7.5.2. Product Strategy
27.1.8. Pure Cultures LLC
27.1.8.1. Overview
27.1.8.2. Product Portfolio
27.1.8.3. Profitability by Market Segments (Product/Channel/Country)
27.1.8.4. Sales Footprint
27.1.8.5. Strategy Overview
27.1.8.5.1. Marketing Strategy
27.1.8.5.2. Product Strategy
27.1.9. Calpis Co., Ltd.
27.1.9.1. Overview
27.1.9.2. Product Portfolio
27.1.9.3. Profitability by Market Segments (Product/Channel/Country)
27.1.9.4. Sales Footprint
27.1.9.5. Strategy Overview
27.1.9.5.1. Marketing Strategy
27.1.9.5.2. Product Strategy
27.1.10. Adisseo
27.1.10.1. Overview
27.1.10.2. Product Portfolio
27.1.10.3. Profitability by Market Segments (Product/Channel/Country)
27.1.10.4. Sales Footprint
27.1.10.5. Strategy Overview
27.1.10.5.1. Marketing Strategy
27.1.10.5.2. Product Strategy
28. Assumptions and Acronyms Used
29. Research Methodology
Let us know your requirement to get
100% FREE customization
List of Tables
Table 1: Global Animal Feed ProbioticsMarket Value (US$ Mn) and Forecast by Region, 2016–2020
Table 2: Global Animal Feed ProbioticsMarket Value (US$ Mn) and Forecast by Region, 2021–2031
Table 3: Global Animal Feed ProbioticsMarket Volume (Metric Tons) and Forecast by Region, 2016–2020
Table 4: Global Animal Feed ProbioticsMarket Volume (Metric Tons) and Forecast by Region, 2021–2031
Table 5: Global Animal Feed ProbioticsMarket Value (US$ Mn) and Forecast by Source, 2016–2020
Table 6: Global Animal Feed ProbioticsMarket Value (US$ Mn) and Forecast by Source, 2021–2031
Table 7: Global Animal Feed ProbioticsMarket Volume (Metric Tons) and Forecast by Source, 2016–2020
Table 8: Global Animal Feed ProbioticsMarket Volume (Metric Tons) and Forecast by Source, 2021–2031
Table 9: Global Animal Feed ProbioticsMarket Value (US$ Mn) and Forecast by Distribution Channel, 2016–2020
Table 10: Global Animal Feed ProbioticsMarket Value (US$ Mn) and Forecast by Distribution Channel, 2021–2031
Table 11: Global Animal Feed ProbioticsMarket Volume (Metric Tons) and Forecast by Distribution Channel, 2016–2020
Table 12: Global Animal Feed ProbioticsMarket Volume (Metric Tons) and Forecast by Distribution Channel, 2021–2031
Table 13: Global Animal Feed ProbioticsMarket Value (US$ Mn) and Forecast by Form, 2016–2020
Table 14: Global Animal Feed ProbioticsMarket Value (US$ Mn) and Forecast by Form, 2021–2031
Table 15: Global Animal Feed ProbioticsMarket Volume (Metric Tons) and Forecast by Form, 2016–2020
Table 16: Global Animal Feed ProbioticsMarket Volume (Metric Tons) and Forecast by Form, 2021–2031
Table 17: Global Animal Feed ProbioticsMarket Value (US$ Mn) and Forecast by Application, 2016–2020
Table 18: Global Animal Feed ProbioticsMarket Value (US$ Mn) and Forecast by Application, 2021–2031
Table 19: Global Animal Feed ProbioticsMarket Volume (Metric Tons) and Forecast by Application, 2016–2020
Table 20: Global Animal Feed ProbioticsMarket Volume (Metric Tons) and Forecast by Application, 2021–2031
Table 21: North America Animal Feed ProbioticsMarket Value (US$ Mn) and Forecast by Country, 2016–2020
Table 22: North America Animal Feed ProbioticsMarket Value (US$ Mn) and Forecast by Country, 2021–2031
Table 23: North America Animal Feed ProbioticsMarket Volume (Metric Tons) and Forecast by Country, 2016–2020
Table 24: North America Animal Feed ProbioticsMarket Volume (Metric Tons) and Forecast by Country, 2021–2031
Table 25: North America Animal Feed ProbioticsMarket Value (US$ Mn) and Forecast by Source, 2016–2020
Table 26: North America Animal Feed ProbioticsMarket Value (US$ Mn) and Forecast by Source, 2021–2031
Table 27: North America Animal Feed ProbioticsMarket Volume (Metric Tons) and Forecast by Source, 2016–2020
Table 28: North America Animal Feed ProbioticsMarket Volume (Metric Tons) and Forecast by Source, 2021–2031
Table 29: North America Animal Feed ProbioticsMarket Value (US$ Mn) and Forecast by Distribution Channel, 2016–2020
Table 30: North America Animal Feed ProbioticsMarket Value (US$ Mn) and Forecast by Distribution Channel, 2021–2031
Table 31: North America Animal Feed ProbioticsMarket Volume (Metric Tons) and Forecast by Distribution Channel, 2016–2020
Table 32: North America Animal Feed ProbioticsMarket Volume (Metric Tons) and Forecast by Distribution Channel, 2021–2031
Table 33: North America Animal Feed ProbioticsMarket Value (US$ Mn) and Forecast by Form, 2016–2020
Table 34: North America Animal Feed ProbioticsMarket Value (US$ Mn) and Forecast by Form, 2021–2031
Table 35: North America Animal Feed ProbioticsMarket Volume (Metric Tons) and Forecast by Form, 2016–2020
Table 36: North America Animal Feed ProbioticsMarket Volume (Metric Tons) and Forecast by Form, 2021–2031
Table 37: North America Animal Feed ProbioticsMarket Value (US$ Mn) and Forecast by Application, 2016–2020
Table 38: North America Animal Feed ProbioticsMarket Value (US$ Mn) and Forecast by Application, 2021–2031
Table 39: North America Animal Feed ProbioticsMarket Volume (Metric Tons) and Forecast by Application, 2016–2020
Table 40: North America Animal Feed ProbioticsMarket Volume (Metric Tons) and Forecast by Application, 2021–2031
Table 41: Latin America Animal Feed ProbioticsMarket Value (US$ Mn) and Forecast by Country, 2016–2020
Table 42: Latin America Animal Feed ProbioticsMarket Value (US$ Mn) and Forecast by Country, 2021–2031
Table 43: Latin America Animal Feed ProbioticsMarket Volume (Metric Tons) and Forecast by Country, 2016–2020
Table 44: Latin America Animal Feed ProbioticsMarket Volume (Metric Tons) and Forecast by Country, 2021–2031
Table 45: Latin America Animal Feed ProbioticsMarket Value (US$ Mn) and Forecast by Source, 2016–2020
Table 46: Latin America Animal Feed ProbioticsMarket Value (US$ Mn) and Forecast by Source, 2021–2031
Table 47: Latin America Animal Feed ProbioticsMarket Volume (Metric Tons) and Forecast by Source, 2016–2020
Table 48: Latin America Animal Feed ProbioticsMarket Volume (Metric Tons) and Forecast by Source, 2021–2031
Table 49: Latin America Animal Feed ProbioticsMarket Value (US$ Mn) and Forecast by Distribution Channel, 2016–2020
Table 50: Latin America Animal Feed ProbioticsMarket Value (US$ Mn) and Forecast by Distribution Channel, 2021–2031
Table 51: Latin America Animal Feed ProbioticsMarket Volume (Metric Tons) and Forecast by Distribution Channel, 2016–2020
Table 52: Latin America Animal Feed ProbioticsMarket Volume (Metric Tons) and Forecast by Distribution Channel, 2021–2031
Table 53: Latin America Animal Feed ProbioticsMarket Value (US$ Mn) and Forecast by Form, 2016–2020
Table 54: Latin America Animal Feed ProbioticsMarket Value (US$ Mn) and Forecast by Form, 2021–2031
Table 55: Latin America Animal Feed ProbioticsMarket Volume (Metric Tons) and Forecast by Form, 2016–2020
Table 56: Latin America Animal Feed ProbioticsMarket Volume (Metric Tons) and Forecast by Form, 2021–2031
Table 57: Latin America Animal Feed ProbioticsMarket Value (US$ Mn) and Forecast by Application, 2016–2020
Table 58: Latin America Animal Feed ProbioticsMarket Value (US$ Mn) and Forecast by Application, 2021–2031
Table 59: Latin America Animal Feed ProbioticsMarket Volume (Metric Tons) and Forecast by Application, 2016–2020
Table 60: Latin America Animal Feed ProbioticsMarket Volume (Metric Tons) and Forecast by Application, 2021–2031
Table 61: Europe Animal Feed ProbioticsMarket Value (US$ Mn) and Forecast by Country, 2016–2020
Table 62: Europe Animal Feed ProbioticsMarket Value (US$ Mn) and Forecast by Country, 2021–2031
Table 63: Europe Animal Feed ProbioticsMarket Volume (Metric Tons) and Forecast by Country, 2016–2020
Table 64: Europe Animal Feed ProbioticsMarket Volume (Metric Tons) and Forecast by Country, 2021–2031
Table 65: Europe Animal Feed ProbioticsMarket Value (US$ Mn) and Forecast by Source, 2016–2020
Table 66: Europe Animal Feed ProbioticsMarket Value (US$ Mn) and Forecast by Source, 2021–2031
Table 67: Europe Animal Feed ProbioticsMarket Volume (Metric Tons) and Forecast by Source, 2016–2020
Table 68: Europe Animal Feed ProbioticsMarket Volume (Metric Tons) and Forecast by Source, 2021–2031
Table 69: Europe Animal Feed ProbioticsMarket Value (US$ Mn) and Forecast by Distribution Channel, 2016–2020
Table 70: Europe Animal Feed ProbioticsMarket Value (US$ Mn) and Forecast by Distribution Channel, 2021–2031
Table 71: Europe Animal Feed ProbioticsMarket Volume (Metric Tons) and Forecast by Distribution Channel, 2016–2020
Table 72: Europe Animal Feed ProbioticsMarket Volume (Metric Tons) and Forecast by Distribution Channel, 2021–2031
Table 73: Europe Animal Feed ProbioticsMarket Value (US$ Mn) and Forecast by Form, 2016–2020
Table 74: Europe Animal Feed ProbioticsMarket Value (US$ Mn) and Forecast by Form, 2021–2031
Table 75: Europe Animal Feed ProbioticsMarket Volume (Metric Tons) and Forecast by Form, 2016–2020
Table 76: Europe Animal Feed ProbioticsMarket Volume (Metric Tons) and Forecast by Form, 2021–2031
Table 77: Europe Animal Feed ProbioticsMarket Value (US$ Mn) and Forecast by Application, 2016–2020
Table 78: Europe Animal Feed ProbioticsMarket Value (US$ Mn) and Forecast by Application, 2021–2031
Table 79: Europe Animal Feed ProbioticsMarket Volume (Metric Tons) and Forecast by Application, 2016–2020
Table 80: Europe Animal Feed ProbioticsMarket Volume (Metric Tons) and Forecast by Application, 2021–2031
Table 81: CIS & Russia Animal Feed ProbioticsMarket Value (US$ Mn) and Forecast by Source, 2016–2020
Table 82: CIS & Russia Animal Feed ProbioticsMarket Value (US$ Mn) and Forecast by Source, 2021–2031
Table 83: CIS & Russia Animal Feed ProbioticsMarket Volume (Metric Tons) and Forecast by Source, 2016–2020
Table 84: CIS & Russia Animal Feed ProbioticsMarket Volume (Metric Tons) and Forecast by Source, 2021–2031
Table 85: CIS & Russia Animal Feed ProbioticsMarket Value (US$ Mn) and Forecast by Distribution Channel, 2016–2020
Table 86: CIS & Russia Animal Feed ProbioticsMarket Value (US$ Mn) and Forecast by Distribution Channel, 2021–2031
Table 87: CIS & Russia Animal Feed ProbioticsMarket Volume (Metric Tons) and Forecast by Distribution Channel, 2016–2020
Table 88: CIS & Russia Animal Feed ProbioticsMarket Volume (Metric Tons) and Forecast by Distribution Channel, 2021–2031
Table 89: CIS & Russia Animal Feed ProbioticsMarket Value (US$ Mn) and Forecast by Form, 2016–2020
Table 90: CIS & Russia Animal Feed ProbioticsMarket Value (US$ Mn) and Forecast by Form, 2021–2031
Table 91: CIS & Russia Animal Feed ProbioticsMarket Volume (Metric Tons) and Forecast by Form, 2016–2020
Table 92: CIS & Russia Animal Feed ProbioticsMarket Volume (Metric Tons) and Forecast by Form, 2021–2031
Table 93: CIS & Russia Animal Feed ProbioticsMarket Value (US$ Mn) and Forecast by Application, 2016–2020
Table 94: CIS & Russia Animal Feed ProbioticsMarket Value (US$ Mn) and Forecast by Application, 2021–2031
Table 95: CIS & Russia Animal Feed ProbioticsMarket Volume (Metric Tons) and Forecast by Application, 2016–2020
Table 96: APEJ Animal Feed ProbioticsMarket Value (US$ Mn) and Forecast by Country, 2016–2020
Table 97: APEJ Animal Feed ProbioticsMarket Value (US$ Mn) and Forecast by Country, 2021–2031
Table 98: APEJ Animal Feed ProbioticsMarket Volume (Metric Tons) and Forecast by Country, 2016–2020
Table 99: APEJ Animal Feed ProbioticsMarket Volume (Metric Tons) and Forecast by Country, 2021–2031
Table 100: APEJ Animal Feed ProbioticsMarket Value (US$ Mn) and Forecast by Source, 2016–2020
Table 101: APEJ Animal Feed ProbioticsMarket Value (US$ Mn) and Forecast by Source, 2021–2031
Table 102: APEJ Animal Feed ProbioticsMarket Volume (Metric Tons) and Forecast by Source, 2016–2020
Table 103: APEJ Animal Feed ProbioticsMarket Volume (Metric Tons) and Forecast by Source, 2021–2031
Table 104: APEJ Animal Feed ProbioticsMarket Value (US$ Mn) and Forecast by Distribution Channel, 2016–2020
Table 105: APEJ Animal Feed ProbioticsMarket Value (US$ Mn) and Forecast by Distribution Channel, 2021–2031
Table 106: APEJ Animal Feed ProbioticsMarket Volume (Metric Tons) and Forecast by Distribution Channel, 2016–2020
Table 107: APEJ Animal Feed ProbioticsMarket Volume (Metric Tons) and Forecast by Distribution Channel, 2021–2031
Table 108: APEJ Animal Feed ProbioticsMarket Value (US$ Mn) and Forecast by Form, 2016–2020
Table 109: APEJ Animal Feed ProbioticsMarket Value (US$ Mn) and Forecast by Form, 2021–2031
Table 110: APEJ Animal Feed ProbioticsMarket Volume (Metric Tons) and Forecast by Form, 2016–2020
Table 111: APEJ Animal Feed ProbioticsMarket Volume (Metric Tons) and Forecast by Form, 2021–2031
Table 112: APEJ Animal Feed ProbioticsMarket Value (US$ Mn) and Forecast by Application, 2016–2020
Table 113: APEJ Animal Feed ProbioticsMarket Value (US$ Mn) and Forecast by Application, 2021–2031
Table 114: APEJ Animal Feed ProbioticsMarket Volume (Metric Tons) and Forecast by Application, 2016–2020
Table 115: APEJ Animal Feed ProbioticsMarket Volume (Metric Tons) and Forecast by Application, 2021–2031
Table 116: Japan Animal Feed ProbioticsMarket Value (US$ Mn) and Forecast by Source, 2016–2020
Table 117: Japan Animal Feed ProbioticsMarket Value (US$ Mn) and Forecast by Source, 2021–2031
Table 118: Japan Animal Feed ProbioticsMarket Volume (Metric Tons) and Forecast by Source, 2016–2020
Table 119: Japan Animal Feed ProbioticsMarket Volume (Metric Tons) and Forecast by Source, 2021–2031
Table 120: Japan Animal Feed ProbioticsMarket Value (US$ Mn) and Forecast by Distribution Channel, 2016–2020
Table 121: Japan Animal Feed ProbioticsMarket Value (US$ Mn) and Forecast by Distribution Channel, 2021–2031
Table 122: Japan Animal Feed ProbioticsMarket Volume (Metric Tons) and Forecast by Distribution Channel, 2016–2020
Table 123: Japan Animal Feed ProbioticsMarket Volume (Metric Tons) and Forecast by Distribution Channel, 2021–2031
Table 124: Japan Animal Feed ProbioticsMarket Value (US$ Mn) and Forecast by Form, 2016–2020
Table 125: Japan Animal Feed ProbioticsMarket Value (US$ Mn) and Forecast by Form, 2021–2031
Table 126: Japan Animal Feed ProbioticsMarket Volume (Metric Tons) and Forecast by Form, 2016–2020
Table 127: Japan Animal Feed ProbioticsMarket Volume (Metric Tons) and Forecast by Form, 2021–2031
Table 128: Japan Animal Feed ProbioticsMarket Value (US$ Mn) and Forecast by Application, 2016–2020
Table 129: Japan Animal Feed ProbioticsMarket Value (US$ Mn) and Forecast by Application, 2021–2031
Table 130: Japan Animal Feed ProbioticsMarket Volume (Metric Tons) and Forecast by Application, 2016–2020
Table 131: Japan Animal Feed ProbioticsMarket Volume (Metric Tons) and Forecast by Application, 2021–2031
Table 132: MEA Animal Feed ProbioticsMarket Value (US$ Mn) and Forecast by Country, 2016–2020
Table 133: MEA Animal Feed ProbioticsMarket Value (US$ Mn) and Forecast by Country, 2021–2031
Table 134: MEA Animal Feed ProbioticsMarket Volume (Metric Tons) and Forecast by Country, 2016–2020
Table 135: MEA Animal Feed ProbioticsMarket Volume (Metric Tons) and Forecast by Country, 2021–2031
Table 136: MEA Animal Feed ProbioticsMarket Value (US$ Mn) and Forecast by Source, 2016–2020
Table 137: MEA Animal Feed ProbioticsMarket Value (US$ Mn) and Forecast by Source, 2021–2031
Table 138: MEA Animal Feed ProbioticsMarket Volume (Metric Tons) and Forecast by Source, 2016–2020
Table 139: MEA Animal Feed ProbioticsMarket Volume (Metric Tons) and Forecast by Source, 2021–2031
Table 140: MEA Animal Feed ProbioticsMarket Value (US$ Mn) and Forecast by Distribution Channel, 2016–2020
Table 141: MEA Animal Feed ProbioticsMarket Value (US$ Mn) and Forecast by Distribution Channel, 2021–2031
Table 142: MEA Animal Feed ProbioticsMarket Volume (Metric Tons) and Forecast by Distribution Channel, 2016–2020
Table 143: MEA Animal Feed ProbioticsMarket Volume (Metric Tons) and Forecast by Distribution Channel, 2021–2031
Table 144: MEA Animal Feed ProbioticsMarket Value (US$ Mn) and Forecast by Form, 2016–2020
Table 145: MEA Animal Feed ProbioticsMarket Value (US$ Mn) and Forecast by Form, 2021–2031
Table 146: MEA Animal Feed ProbioticsMarket Volume (Metric Tons) and Forecast by Form, 2016–2020
Table 147: MEA Animal Feed ProbioticsMarket Volume (Metric Tons) and Forecast by Form, 2021–2031
Table 148: MEA Animal Feed ProbioticsMarket Value (US$ Mn) and Forecast by Application, 2016–2020
Table 149: MEA Animal Feed ProbioticsMarket Value (US$ Mn) and Forecast by Application, 2021–2031
Table 150: MEA Animal Feed ProbioticsMarket Volume (Metric Tons) and Forecast by Application, 2016–2020
Table 151: MEA Animal Feed ProbioticsMarket Volume (Metric Tons) and Forecast by Application, 2021–2031
Table 152: Phillippines Animal Feed ProbioticsMarket Value (US$ Mn) and Forecast by Source, 2016–2020
Table 153: Phillippines Animal Feed ProbioticsMarket Value (US$ Mn) and Forecast by Source, 2021–2031
Table 154: Phillippines Animal Feed ProbioticsMarket Volume (Metric Tons) and Forecast by Source, 2016–2020
Table 155: Phillippines Animal Feed ProbioticsMarket Volume (Metric Tons) and Forecast by Source, 2021–2031
Table 156: Phillippines Animal Feed ProbioticsMarket Value (US$ Mn) and Forecast by Distribution Channel, 2016–2020
Table 157: Phillippines Animal Feed ProbioticsMarket Value (US$ Mn) and Forecast by Distribution Channel, 2021–2031
Table 158: Phillippines Animal Feed ProbioticsMarket Volume (Metric Tons) and Forecast by Distribution Channel, 2016–2020
Table 159: Phillippines Animal Feed ProbioticsMarket Volume (Metric Tons) and Forecast by Distribution Channel, 2021–2031
Table 160: Phillippines Animal Feed ProbioticsMarket Value (US$ Mn) and Forecast by Form, 2016–2020
Table 161: Phillippines Animal Feed ProbioticsMarket Value (US$ Mn) and Forecast by Form, 2021–2031
Table 162: Phillippines Animal Feed ProbioticsMarket Volume (Metric Tons) and Forecast by Form, 2016–2020
Table 163: Phillippines Animal Feed ProbioticsMarket Volume (Metric Tons) and Forecast by Form, 2021–2031
Table 164: Phillippines Animal Feed ProbioticsMarket Value (US$ Mn) and Forecast by Application, 2016–2020
Table 165: Phillippines Animal Feed ProbioticsMarket Value (US$ Mn) and Forecast by Application, 2021–2031
Table 166: Phillippines Animal Feed ProbioticsMarket Volume (Metric Tons) and Forecast by Application, 2016–2020
Table 167: Phillippines Animal Feed ProbioticsMarket Volume (Metric Tons) and Forecast by Application, 2021–2031
Find your sweet spots for generating winning opportunities in this market.
Talk to AnalystList of Charts
Figure 1: Global Animal Feed Probiotics Market Value (US$ Mn) Scenario Forecast, 2021 & 2031
Figure 2: Global Animal Feed Probiotics Market Size (US$ Mn), Volume (MT), and Incremental $ Opportunity (US$ Mn), 2016-2031
Figure 3: Global Animal Feed Probiotics Market Share and BPS Analysis by Source, 2021 & 2031
Figure 4: Global Animal Feed Probiotics Market Attractiveness Analysis by Source, 2021-2031
Figure 5: Global Animal Feed Probiotics Market Share and BPS Analysis by Bacteria, 2021 & 2031
Figure 6: Global Animal Feed Probiotics Market Attractiveness Analysis by Bacteria, 2021-2031
Figure 7: Global Animal Feed Probiotics Market Share and BPS Analysis by Non Bacteria , 2021 & 2031
Figure 8: Global Animal Feed Probiotics Market Attractiveness Analysis by Non Bacteria , 2021-2031
Figure 9: Global Animal Feed Probiotics Market Share and BPS Analysis by Animals, 2021 & 2031
Figure 10: Global Animal Feed Probiotics Market Attractiveness Analysis by Animals, 2021-2031
Figure 11: Global Animal Feed Probiotics Market Share and BPS Analysis by Livestock, 2021 & 2031
Figure 12: Global Animal Feed Probiotics Market Attractiveness Analysis by Livestock, 2021-2031
Figure 13: Global Animal Feed Probiotics Market Share and BPS Analysis by Poultry , 2021 & 2031
Figure 14: Global Animal Feed Probiotics Market Attractiveness Analysis by Poultry, 2021-2031
Figure 15: Global Animal Feed Probiotics Market Share and BPS Analysis by Form , 2021 & 2031
Figure 16: Global Animal Feed Probiotics Market Attractiveness Analysis by Form, 2021-2031
Figure 17: Global Animal Feed Probiotics Market Share and BPS Analysis by Distribution Channel, 2021 & 2031
Figure 18: Global Animal Feed Probiotics Market Attractiveness Analysis by Distribution Channel, 2021-2031
Figure 19: Global Animal Feed Probiotics Market Share and BPS Analysis by Region, 2021 & 2031
Figure 20: Global Animal Feed Probiotics Market Attractiveness Analysis by Region, 2021-2031
Figure 21: North America Animal Feed Probiotics Absolute $ Opportunity Analysis, 2021-2031
Figure 22: Latin America Animal Feed Probiotics Absolute $ Opportunity Analysis, 2021-2031
Figure 23: Europe Animal Feed Probiotics Absolute $ Opportunity Analysis, 2021-2031
Figure 24: CIS & Russia Animal Feed Probiotics Absolute $ Opportunity Analysis, 2021-2031
Figure 25: APEJ Animal Feed Probiotics Absolute $ Opportunity Analysis, 2021-2031
Figure 26: Japan Animal Feed Probiotics Absolute $ Opportunity Analysis, 2021-2031
Figure 27: MEA Animal Feed Probiotics Absolute $ Opportunity Analysis, 2021-2031
Figure 28: Philippines Animal Feed Probiotics Absolute $ Opportunity Analysis, 2021-2031
Figure 29: Figure 29:Global Animal Feed Probiotics Market Attractiveness Analysis by Region, 2021-2031
Figure 30: North America Animal Feed Probiotics Market Value (US$ Mn), Volume (MT) Forecast and Analysis, 2021-2031
Figure 31: North America Animal Feed Probiotics Market Share and BPS Analysis by Country – 2021 & 2031
Figure 32: North America Animal Feed Probiotics Market Attractiveness Analysis by Country, 2021-2031
Figure 33: U.S. Animal Feed Probiotics Market Incremental $ Opportunity, 2021-2031
Figure 34: Canada Animal Feed Probiotics Market Incremental $ Opportunity, 2021-2031
Figure 35: North America Animal Feed Probiotics Market Share and BPS Analysis by Source , 2021 & 2031
Figure 36: North America Animal Feed Probiotics Market Attractiveness Analysis by Source, 2021-2031
Figure 37: North America Animal Feed Probiotics Market Share and BPS Analysis by Animal , 2021 & 2031
Figure 38: North America Animal Feed Probiotics Market Attractiveness Analysis by Animals, 2021-2031
Figure 39: North America Animal Feed Probiotics Market Share and BPS Analysis by Form , 2021 & 2031
Figure 40: North America Animal Feed Probiotics Market Attractiveness Analysis by Form, 2021-2031
Figure 41: North America Animal Feed Probiotics Market Share and BPS Analysis by Distribution Channel, 2021 & 2031
Figure 42: North America Animal Feed Probiotics Market Attractiveness Analysis by Distribution Channel, 2021-2031
Figure 43: Latin America Animal Feed Probiotics Market Value (US$ Mn), Volume (MT) Forecast and Analysis, 2021-2031
Figure 44: Latin America Animal Feed Probiotics Market Share and BPS Analysis by Country – 2021 & 2031
Figure 45: Latin America Animal Feed Probiotics Market Attractiveness Analysis by Country, 2021-2031
Figure 46: Brazil Animal Feed Probiotics Market Incremental $ Opportunity, 2021-2031
Figure 47: Mexico Animal Feed Probiotics Market Incremental $ Opportunity, 2021-2031
Figure 48: Argentina Animal Feed Probiotics Market Incremental $ Opportunity, 2021-2031
Figure 49: Chilli Animal Feed Probiotics Market Incremental $ Opportunity, 2021-2031
Figure 50: Peru Animal Feed Probiotics Market Incremental $ Opportunity, 2021-2031
Figure 51: Rest of LATAM Animal Feed Probiotics Market Incremental $ Opportunity, 2021-2031
Figure 52: Latin America Animal Feed Probiotics Market Share and BPS Analysis by Source , 2021 & 2031
Figure 53: Latin America Animal Feed Probiotics Market Attractiveness Analysis by Source, 2021-2031
Figure 54: Latin America Animal Feed Probiotics Market Share and BPS Analysis by Animal , 2021 & 2031
Figure 55: Latin America Animal Feed Probiotics Market Attractiveness Analysis by Animals, 2021-2031
Figure 56: Latin America Animal Feed Probiotics Market Share and BPS Analysis by Form , 2021 & 2031
Figure 57: Latin America Animal Feed Probiotics Market Attractiveness Analysis by Form, 2021-2031
Figure 58: Latin America Animal Feed Probiotics Market Share and BPS Analysis by Distribution Channel, 2021 & 2031
Figure 59: Latin America Animal Feed Probiotics Market Attractiveness Analysis by Distribution Channel, 2021-2031
Figure 60: Europe Animal Feed Probiotics Market Value (US$ Mn), Volume (MT) Forecast and Analysis, 2021-2031
Figure 61: Europe Animal Feed Probiotics Market Share and BPS Analysis by Country – 2021 & 2031
Figure 62: Europe Animal Feed Probiotics Market Attractiveness Analysis by Country, 2021-2031
Figure 63: EU-4 Animal Feed Probiotics Market Incremental $ Opportunity, 2021-2031
Figure 64: UK Animal Feed Probiotics Market Incremental $ Opportunity, 2021-2031
Figure 65: BENELUX Animal Feed Probiotics Market Incremental $ Opportunity, 2021-2031
Figure 66: Nordic Animal Feed Probiotics Market Incremental $ Opportunity, 2021-2031
Figure 67: Eastern Europe Animal Feed Probiotics Market Incremental $ Opportunity, 2021-2031
Figure 68: Rest of Europe Animal Feed Probiotics Market Incremental $ Opportunity, 2021-2031
Figure 69: Europe Animal Feed Probiotics Market Share and BPS Analysis by Source , 2021 & 2031
Figure 70: Europe Animal Feed Probiotics Market Attractiveness Analysis by Source, 2021-2031
Figure 71: Europe Animal Feed Probiotics Market Share and BPS Analysis by Animal , 2021 & 2031
Figure 72: Europe Animal Feed Probiotics Market Attractiveness Analysis by Animals, 2021-2031
Figure 73: Europe Animal Feed Probiotics Market Share and BPS Analysis by Form , 2021 & 2031
Figure 74: Europe Animal Feed Probiotics Market Attractiveness Analysis by Form, 2021-2031
Figure 75: Europe Animal Feed Probiotics Market Share and BPS Analysis by Distribution Channel, 2021 & 2031
Figure 76: Europe Animal Feed Probiotics Market Attractiveness Analysis by Distribution Channel, 2021-2031
Figure 77: CIS & Russia Animal Feed Probiotics Market Value (US$ Mn), Volume (MT) Forecast and Analysis, 2021-2031
Figure 78: CIS & Russia Animal Feed Probiotics Market Share and BPS Analysis by Source , 2021 & 2031
Figure 79: CIS & Russia Animal Feed Probiotics Market Attractiveness Analysis by Source, 2021-2031
Figure 80: CIS & Russia Animal Feed Probiotics Market Share and BPS Analysis by Animal , 2021 & 2031
Figure 81: CIS & Russia Animal Feed Probiotics Market Attractiveness Analysis by Animals, 2021-2031
Figure 82: CIS & Russia Animal Feed Probiotics Market Share and BPS Analysis by Form , 2021 & 2031
Figure 83: CIS & Russia Animal Feed Probiotics Market Attractiveness Analysis by Form, 2021-2031
Figure 84: CIS & Russia Animal Feed Probiotics Market Share and BPS Analysis by Distribution Channel, 2021 & 2031
Figure 85: CIS & Russia Animal Feed Probiotics Market Attractiveness Analysis by Distribution Channel, 2021-2031
Figure 86: APEJ Animal Feed Probiotics Market Value (US$ Mn), Volume (MT) Forecast and Analysis, 2021-2031
Figure 87: APEJ Animal Feed Probiotics Market Share and BPS Analysis by Country – 2021 & 2031
Figure 88: APEJ Animal Feed Probiotics Market Attractiveness Analysis by Country, 2021-2031
Figure 89: Greater China Animal Feed Probiotics Market Incremental $ Opportunity, 2021-2031
Figure 90: India Animal Feed Probiotics Market Incremental $ Opportunity, 2021-2031
Figure 91: Australia & New Zealand Animal Feed Probiotics Market Incremental $ Opportunity, 2021-2031
Figure 92: ASEAN Animal Feed Probiotics Market Incremental $ Opportunity, 2021-2031
Figure 93: South Korea Animal Feed Probiotics Market Incremental $ Opportunity, 2021-2031
Figure 94: Rest of APEJ Animal Feed Probiotics Market Incremental $ Opportunity, 2021-2031
Figure 95: APEJ Animal Feed Probiotics Market Share and BPS Analysis by Source , 2021 & 2031
Figure 96: APEJ Animal Feed Probiotics Market Attractiveness Analysis by Source, 2021-2031
Figure 97: APEJ Animal Feed Probiotics Market Share and BPS Analysis by Animal , 2021 & 2031
Figure 98: APEJ Animal Feed Probiotics Market Attractiveness Analysis by Animals, 2021-2031
Figure 99: APEJ Animal Feed Probiotics Market Share and BPS Analysis by Form , 2021 & 2031
Figure 100: APEJ Animal Feed Probiotics Market Attractiveness Analysis by Form, 2021-2031
Figure 101: APEJ Animal Feed Probiotics Market Share and BPS Analysis by Distribution Channel, 2021 & 2031
Figure 102: APEJ Animal Feed Probiotics Market Attractiveness Analysis by Distribution Channel, 2021-2031
Figure 103: Japan Animal Feed Probiotics Market Value (US$ Mn), Volume (MT) Forecast and Analysis, 2021-2031
Figure 104: Japan Animal Feed Probiotics Market Share and BPS Analysis by Source , 2021 & 2031
Figure 105: Japan Animal Feed Probiotics Market Attractiveness Analysis by Source, 2021-2031
Figure 106: Japan Animal Feed Probiotics Market Share and BPS Analysis by Animal , 2021 & 2031
Figure 107: Japan Animal Feed Probiotics Market Attractiveness Analysis by Animals, 2021-2031
Figure 108: Japan Animal Feed Probiotics Market Share and BPS Analysis by Form , 2021 & 2031
Figure 109: Japan Animal Feed Probiotics Market Attractiveness Analysis by Form, 2021-2031
Figure 110: Japan Animal Feed Probiotics Market Share and BPS Analysis by Distribution Channel, 2021 & 2031
Figure 111: Japan Animal Feed Probiotics Market Attractiveness Analysis by Distribution Channel, 2021-2031
Figure 112: MEA Animal Feed Probiotics Market Value (US$ Mn), Volume (MT) Forecast and Analysis, 2021-2031
Figure 113: MEA Animal Feed Probiotics Market Share and BPS Analysis by Country – 2021 & 2031
Figure 114: MEA Animal Feed Probiotics Market Attractiveness Analysis by Country, 2021-2031
Figure 115: GCC Animal Feed Probiotics Market Incremental $ Opportunity, 2021-2031
Figure 116: South Africa Animal Feed Probiotics Market Incremental $ Opportunity, 2021-2031
Figure 117: Turkey Animal Feed Probiotics Market Incremental $ Opportunity, 2021-2031
Figure 118: Iran Animal Feed Probiotics Market Incremental $ Opportunity, 2021-2031
Figure 119: Isreal Animal Feed Probiotics Market Incremental $ Opportunity, 2021-2031
Figure 120: Rest of MEA Animal Feed Probiotics Market Incremental $ Opportunity, 2021-2031
Figure 121: MEA Animal Feed Probiotics Market Share and BPS Analysis by Source , 2021 & 2031
Figure 122: MEA Animal Feed Probiotics Market Attractiveness Analysis by Source, 2021-2031
Figure 123: MEA Animal Feed Probiotics Market Share and BPS Analysis by Animal , 2021 & 2031
Figure 124: MEA Animal Feed Probiotics Market Attractiveness Analysis by Animals, 2021-2031
Figure 125: MEA Animal Feed Probiotics Market Share and BPS Analysis by Form , 2021 & 2031
Figure 126: MEA Animal Feed Probiotics Market Attractiveness Analysis by Form, 2021-2031
Figure 127: MEA Animal Feed Probiotics Market Share and BPS Analysis by Distribution Channel, 2021 & 2031
Figure 128: MEA Animal Feed Probiotics Market Attractiveness Analysis by Distribution Channel, 2021-2031
Figure 129: Philippines Animal Feed Probiotics Market Value (US$ Mn), Volume (MT) Forecast and Analysis, 2021-2031
Figure 130: Philippines Animal Feed Probiotics Market Share and BPS Analysis by Source , 2021 & 2031
Figure 131: Philippines Animal Feed Probiotics Market Attractiveness Analysis by Source, 2021-2031
Figure 132: Philippines Animal Feed Probiotics Market Share and BPS Analysis by Animal , 2021 & 2031
Figure 133: Philippines Animal Feed Probiotics Market Attractiveness Analysis by Animals, 2021-2031
Figure 134: Philippines Animal Feed Probiotics Market Share and BPS Analysis by Form , 2021 & 2031
Figure 135: Philippines Animal Feed Probiotics Market Attractiveness Analysis by Form, 2021-2031
Figure 136: Philippines Animal Feed Probiotics Market Share and BPS Analysis by Distribution Channel, 2021 & 2031
Figure 137: Philippines Animal Feed Probiotics Market Attractiveness Analysis by Distribution Channel, 2021-2031
Need specific information?
Request CustomizationExplore Food and Beverage Insights
View Reports