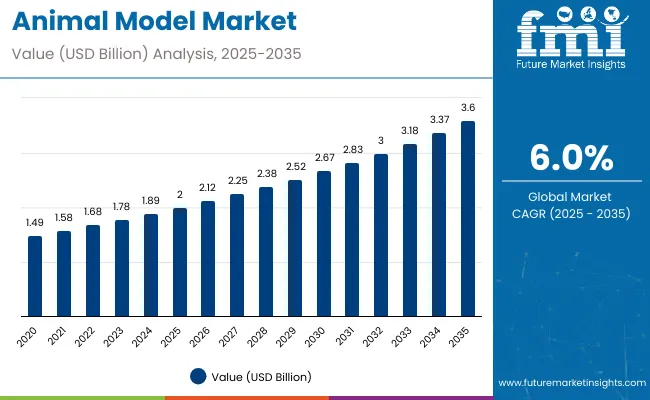
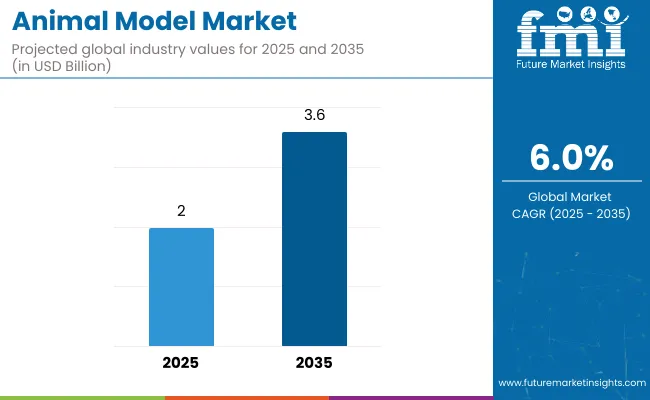
The animal model market is estimated to be valued at USD 2.0 billion in 2025. It is projected to reach USD 3.6 billion by 2035, registering a compound annual growth rate (CAGR) of 6.0% over the forecast period. The market is projected to add an absolute dollar opportunity of USD 1.6 billion over the forecast period. This reflects a 1.8 times growth at a compound annual growth rate of 6.0%.
| Metric | Value |
|---|---|
| Estimated Size (2025E) | USD 2.0 billion |
| Projected Value (2035F) | USD 3.6 billion |
| CAGR (2025 to 2035) | 6.0% |
The market's evolution is expected to be shaped by the rising demand for genetically engineered models, technological advancements in CRISPR gene editing, growing pharmaceutical R&D investments, and increasing preclinical research requirements in emerging markets, particularly where drug safety and efficacy testing are prioritized.
By 2030, the market is likely to reach USD 2.6 billion, accounting for USD 0.6 billion in incremental value over the first half of the decade. The remaining USD 0.8 billion is expected to be realized during the second half, suggesting a moderately accelerated growth pattern. Product innovation in transgenic models, genetically engineered mice (GEMs), and specialized disease models are gaining traction.
Companies such as Charles River Laboratories, and The Jackson Laboratory are advancing their competitive positions through investment in genetic engineering technologies, strategic partnerships, and global breeding facility expansion.
Rising pharmaceutical development needs, personalized medicine research, and improved regulatory frameworks are supporting expansion into oncology research, immunology studies, and toxicology testing. Market performance will remain anchored in genetic authenticity standards, animal welfare compliance, and research reproducibility benchmarks.
The market holds a significant share across its parent markets. Within the global preclinical research market, it accounts for 18.5% due to its critical role in drug development and safety testing. In the pharmaceutical R&D segment, it commands a 12.8% share, supported by increasing drug discovery investments and regulatory requirements.
It contributes nearly 22.3% to the laboratory animal services market and 15.7% to the biotechnology research tools segment. In genetic engineering services, animal models hold around 35.2% share, driven by CRISPR technology adoption and personalized medicine research. Across the contract research organization market, its share is close to 14.6%, owing to its position as essential infrastructure for preclinical studies.
The market is undergoing a strategic transformation driven by rising demand for genetically engineered models, advanced breeding technologies, and the integration of precision medicine research. Advanced genetic engineering techniques using CRISPR-Cas9, transgenic technologies, and humanized models have enhanced research accuracy, disease-modeling capabilities, and translational research potential, making modern animal models essential alternatives to traditional laboratory animals.
Manufacturers are introducing specialized models, including patient-derived xenografts and organ-specific disease models tailored for different therapeutic areas, expanding their role beyond basic research to comprehensive drug development platforms. Strategic collaborations between animal model providers and pharmaceutical companies have accelerated innovation in personalized medicine applications and market penetration.
The market is segmented by species, application, end user, and region. By species, the market is divided into mice, rats, guinea pigs, rabbits, monkeys, dogs, pigs, cats, and other species. Based on application, the market is bifurcated into basic and applied research and drug discovery/development.
In terms of end user, the market is categorized into academic & research institutions, pharmaceutical companies, biotechnology companies, contract research organizations (CROs), and other end users. Regionally, the market is classified into North America, Europe, Asia-Pacific, Latin America, and the Middle East & Africa.
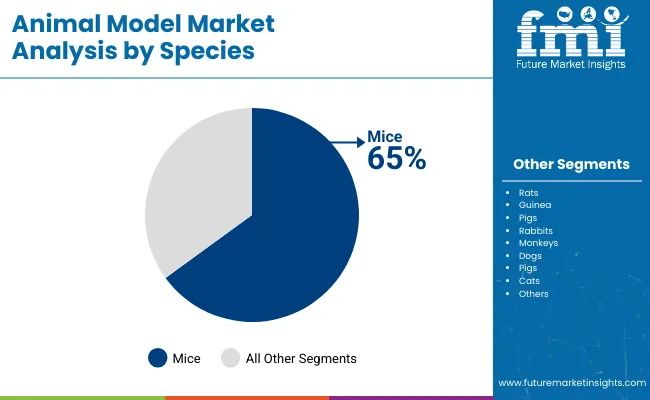
The mice segment is projected to hold a dominant position with 65% of the market share in the species category, owing to their genetic similarity to humans, shorter life cycles, and superior performance in disease-modeling across diverse research applications. Mice are widely used across pharmaceutical, academic, and biotechnology settings due to their genetic tractability, ability to develop transgenic and knockout models, and compatibility with various research protocols.
They enable researchers and companies to achieve optimal research outcomes while maintaining excellent reproducibility and cost-effectiveness in both basic research and drug development scenarios. As demand for genetically engineered models grows, the mice segment continues to maintain preference in modern research applications.
Manufacturers are investing in advanced mouse strains, improved genetic backgrounds, and enhanced breeding technologies to maintain market leadership, broaden application scope, and strengthen research reliability. The segment is positioned to remain dominant as global research markets prioritize genetic authenticity and research reproducibility.
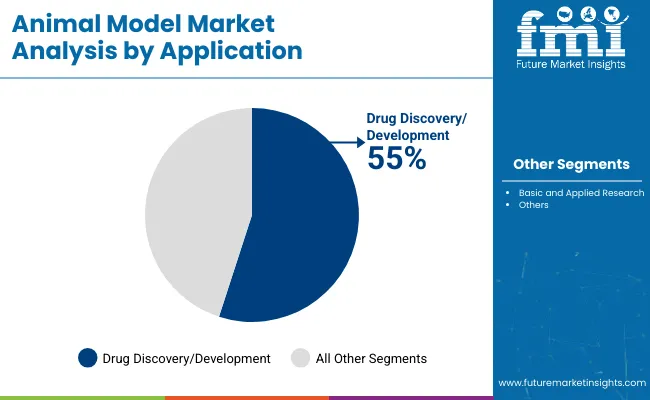
Drug discovery and development remains the core application segment with 55% of the market share in 2025, as it represents the largest consumer of animal model services across pharmaceutical companies, biotechnology firms, and contract research organizations. The segment’s dominance is driven by increasing pharmaceutical R&D investments, rising drug development costs, and growing regulatory requirements for preclinical safety testing in both developed and emerging markets.
Drug discovery applications also benefit from technological advancements in genetic engineering, personalized medicine research, and targeted therapy development, making animal models essential components in modern pharmaceutical development pipelines. This makes drug discovery indispensable in contemporary pharmaceutical research and biotechnology innovation.
Ongoing precision medicine trends and the growing emphasis on translational research are key trends driving the sustained relevance of drug discovery applications in the animal model market.
The animal model market’s steady growth is driven by increasing pharmaceutical R&D investments, the rising prevalence of chronic diseases, and growing demand for personalized medicine research. These factors make it an essential resource for pharmaceutical companies and research institutions seeking reliable preclinical testing solutions.
The growing adoption of genetically engineered models in drug discovery, improved regulatory frameworks for animal welfare, and the expanding biotechnology sector appeal to researchers and companies prioritizing research accuracy and translational potential.
A growing focus on precision medicine, oncology research, and studies of rare diseases is further propelling adoption, particularly in pharmaceutical development, academic research, and contract research organizations. Rising drug development costs, stringent regulatory requirements, and technological advancements in genetic engineering are also enhancing research capabilities and market penetration.
As personalized medicine and gene therapy research accelerate across pharmaceutical and biotechnology applications, the market outlook remains favorable. With researchers and companies prioritizing research reproducibility, genetic authenticity, and regulatory compliance, animal models are well-positioned to expand across various therapeutic areas and research applications.
In 2024, global animal model adoption grew by 8% year-on-year, with North America taking a 47% share. Applications include pharmaceutical research, academic studies, and biotechnology development. Manufacturers are introducing genetically engineered models and CRISPR technologies that deliver superior research accuracy and disease-modeling capabilities.
Transgenic formulations now support personalized medicine positioning. Regulatory frameworks and ethical guidelines support researchers’ confidence. Technology providers increasingly supply ready-to-use model systems with genetic authentication to reduce research complexity.
Genetic Engineering Innovation Accelerates Animal Model Market Demand
Pharmaceutical companies and research institutions are choosing genetically engineered models to achieve superior research accuracy, enhance translational potential, and meet growing demands for personalized medicine research solutions. In research applications, genetically modified models deliver up to 40% improvement in disease.
Modeling accuracy compared to traditional laboratory animals. Models equipped with human genes are able to maintain disease relevance throughout drug development cycles and therapeutic validation studies. In pharmaceutical research, integrated transgenic model systems help reduce development timelines while maintaining research standards by up to 30%.
Genetic engineering applications are now being deployed for oncology and rare disease segments, increasing adoption in sectors demanding precise disease modeling. These advantages help explain why genetically engineered model adoption rates in pharmaceutical applications rose 18% in 2024 across developed markets.
Cost Constraints, Ethical Concerns and Regulatory Complexity Limit Growth
Market expansion is constrained by higher genetically engineered model costs, animal welfare regulations, and specialized handling requirements. Genetically modified animal models can cost 60-80% more than conventional laboratory animals, depending on genetic complexity and breeding requirements, impacting adoption in cost-sensitive applications.
Regulatory compliance with animal welfare standards is expected to require facility upgrades, adding 3-6 months to research timelines. Specialized breeding facilities and genetic authentication extend research costs by 35-45% compared to conventional animal housing.
Limited availability of trained personnel for genetic model handling restricts scalable deployment, especially in emerging markets. These constraints make advanced model adoption challenging in budget-limited institutions despite growing research advantages and regulatory drivers.
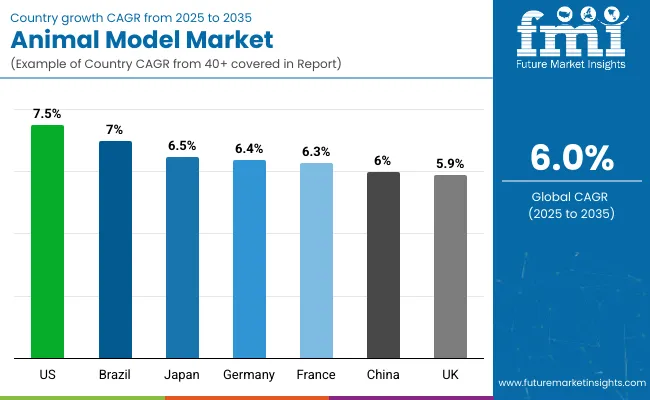
| Country | CAGR (2025 to 2035) |
|---|---|
| USA | 7.5% |
| Brazil | 7.0% |
| Japan | 6.5% |
| Germany | 6.4% |
| France | 6.3% |
| China | 6.0% |
| UK | 5.9% |
In the animal model market, the USA leads with the highest projected CAGR of 7.5% from 2025 to 2035, driven by extensive pharmaceutical R&D infrastructure, NIH funding, and biotechnology sector expansion. Brazil follows with a CAGR of 7.0%, supported by growing pharmaceutical manufacturing and government biotechnology initiatives. Japan shows strong growth at 6.5%, benefiting from aging population research and precision medicine development.
Germany demonstrates solid growth at 6.4%, supported by the pharmaceutical industry's strength and the EU regulatory frameworks. France and China show moderate growth at 6.3% and 6.0% respectively, driven by research excellence and market expansion. The UK, with a CAGR of 5.9%, experiences steady expansion supported by established research infrastructure, reflecting regional differences in pharmaceutical development and research market maturity.
The report covers an in-depth analysis of 40+ countries; seven top-performing OECD countries are highlighted below.
Revenue from animal models in the USA is projected to grow at a CAGR of 7.5% from 2025 to 2035, significantly exceeding the global average of 6.0%, fueled by extensive pharmaceutical R&D investments, NIH funding increases, and an expanding biotechnology sector across major research hubs, including Boston, San Francisco, and Research Triangle Park.
American pharmaceutical markets are increasingly adopting advanced genetic models as drug development standards improve and personalized medicine requirements strengthen. The country is expected to account for 45% of the North American market share, driven by both domestic research consumption and biotechnology innovation capabilities.
Key Statistics:
Sales of animal models in Brazil are projected to grow at a CAGR of 7.0% from 2025 to 2035, approaching regional leadership levels. Growth has been concentrated in pharmaceutical manufacturing expansion and academic research development in São Paulo, Rio de Janeiro, and Brasília regions.
Market adoption is shifting from basic research models toward genetically engineered systems and specialized disease models. Local breeding facilities and international technology partnerships are leading commercial deployment strategies. Government biotechnology policies and the growing pharmaceutical sector are primary drivers of demand.
Key Statistics:
The demand for animal models in Brazil is projected to expand at a CAGR of 7.0% from 2025 to 2035, driven by pharmaceutical sector growth and the development of academic research infrastructure. Growth is concentrated in urban research centers, including São Paulo, Rio de Janeiro, and Belo Horizonte, where pharmaceutical development and biotechnology research requirements are expanding. Healthcare research investments and tropical disease studies are gradually building comprehensive preclinical research requirements.
Key Statistics:
The animal model market in Japan is anticipated to expand at a CAGR of 6.5% from 2025 to 2035, reflecting advanced research infrastructure with a focus on aging population studies and precision medicine research. Growth is centered on pharmaceutical innovation and academic excellence in the Tokyo, Osaka, and Kyoto regions.
Advanced genetic model adoption and disease-specific research applications are projected to be deployed across pharmaceutical companies, universities, and research institutes. Regulatory frameworks and research quality standards support the development of practical models across diverse therapeutic areas.
Key Statistics:
The demand for animal models in Germany is expected to increase at a CAGR of 6.4% from 2025 to 2035, exceeding the European average. Demand is driven by advanced pharmaceutical infrastructure, robust regulatory frameworks, and comprehensive research standards in Berlin, Munich, and Frankfurt markets. Evidence-based research protocols and specialized genetic models are increasingly supported by advanced breeding technologies for optimal research performance.
Key Statistics:
Revenue from animal models in France is projected to rise at a CAGR of 6.3% from 2025 to 2035, supported by steady demand for pharmaceutical research and academic studies. Research institutions in Paris, Lyon, and Toulouse are experiencing expansion in genetic model technologies, regulatory compliance applications, and personalized medicine research practices. French research regulations and ethical guidelines are leveraging advanced model options to meet quality expectations for comprehensive preclinical research systems.
Key Statistics:
The animal model market in China is expected to grow at a CAGR of 6.0% from 2025 to 2035, aligning with the global average growth rate. Growth is driven by expanding pharmaceutical manufacturing, government biotechnology initiatives, and increasing research infrastructure in the Beijing, Shanghai, and Shenzhen regions.
Domestic breeding capabilities and international research partnerships are driving the adoption of advanced genetic models, while researchers incorporate quality-focused protocols into comprehensive drug development programs. Market maturity and established research infrastructure are influencing growth dynamics.
Key Statistics:
The animal model market in the UK is expected to grow at a CAGR of 5.9% from 2025 to 2035, reflecting steady mature market expansion. Growth is driven by research excellence standards and pharmaceutical applications in the London, Cambridge, and Oxford regions.
Integrated research systems and regulatory compliance frameworks are driving the expansion of technology adoption, while research institutions incorporate efficiency-focused protocols into comprehensive preclinical research programs. Brexit-related supply chain adjustments and concerns about research funding are influencing market dynamics.
Key Statistics:
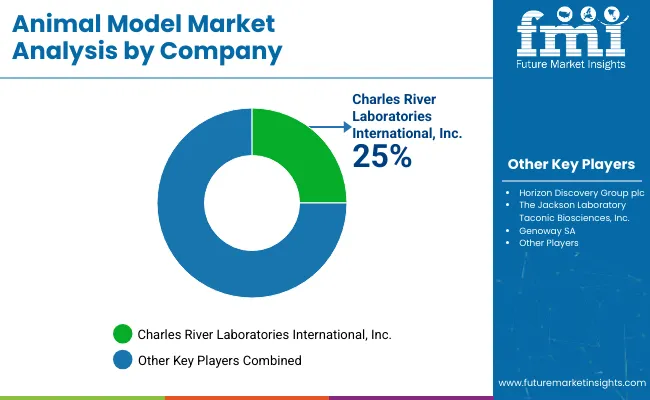
The market is moderately concentrated, featuring a mix of global laboratory service companies, specialized breeding organizations, and biotechnology suppliers with varying degrees of genetic engineering expertise, breeding capabilities, and research support proficiency. Charles River Laboratories leads the market with an estimated 25% share, primarily driven by its comprehensive service portfolio, global breeding facilities, and established relationships with major pharmaceutical companies.
The Jackson Laboratory, Taconic Biosciences, and Genoway SA differentiate through specialized genetic models, advanced breeding programs, and comprehensive technical support that cater to various pharmaceutical, academic, and biotechnology applications.
Regional specialists and tier-2 manufacturers focus on specific research segments, cost-effective breeding solutions, and local market development, addressing growing demand from emerging markets, academic institutions, and specialized research requirements.
Entry barriers are projected to remain moderate to high, driven by challenges in genetic engineering expertise, regulatory compliance, and breeding facility infrastructure across multiple research categories. Competitiveness increasingly depends on genetic innovation, breeding efficiency, and research support capabilities for diverse pharmaceutical and academic environments.
| Items | Value |
|---|---|
| Quantitative Units (2025) | USD 2.0 Billion |
| Species | Mice, Rats, Guinea Pigs, Rabbits, Monkeys, Dogs, Pigs, Cats, Other Species |
| Application | Basic and Applied Research, Drug Discovery/Development |
| End User | Academic & Research Institutions, Pharmaceutical Companies, Biotechnology Companies, Contract Research Organizations (CROs), Other End Users |
| Regions Covered | North America, Europe, Asia Pacific, Latin America, Middle East & Africa |
| Countries Covered | United States, Canada, United Kingdom, Germany, France, China, Japan, South Korea, Brazil, Australia, India, and 40+ Countries |
| Key Companies Profiled | Charles River Laboratories International Inc., The Jackson Laboratory, Taconic Biosciences Inc., Genoway SA, Eurofins Scientific SE, Crown Bioscience Inc. |
| Additional Attributes | Dollar sales by species, end-user and research application, regional breeding facility trends, competitive landscape, researcher preferences for standard versus custom models, integration with pharmaceutical development pipelines, innovations in CRISPR technology and genetic authentication for diverse research applications |
The global animal model market is estimated to be valued at USD 2.0 billion in 2025.
The market size for animal model is projected to reach USD 3.6 billion by 2035.
The animal model market is expected to grow at a 6.0% CAGR between 2025 and 2035.
Mice are projected to lead in the animal model market with 65% market share in 2025.
In terms of application, drug discovery & development segment is projected to command 55% share in the animal model market in 2025.


Full Research Suite comprises of:
Market outlook & trends analysis
Interviews & case studies
Strategic recommendations
Vendor profiles & capabilities analysis
5-year forecasts
8 regions and 60+ country-level data splits
Market segment data splits
12 months of continuous data updates
DELIVERED AS:
PDF EXCEL ONLINE
USA Animal Model Market Size and Share Forecast Outlook 2025 to 2035
Animal Healthcare Packaging Market Size and Share Forecast Outlook 2025 to 2035
Animal External Fixation Market Size and Share Forecast Outlook 2025 to 2035
Animal Antibiotics and Antimicrobials Market Size and Share Forecast Outlook 2025 to 2035
Animal Auto-Immune Disease Diagnostics Market Size and Share Forecast Outlook 2025 to 2035
Animal Disinfectants Market Size and Share Forecast Outlook 2025 to 2035
Animal Health Software Market Size and Share Forecast Outlook 2025 to 2035
Animal Antimicrobials and Antibiotics Market Size and Share Forecast Outlook 2025 to 2035
Animal Sedative Market Size and Share Forecast Outlook 2025 to 2035
Animal Genetics Market Size and Share Forecast Outlook 2025 to 2035
Animal Peptides Market Size and Share Forecast Outlook 2025 to 2035
Animal Immunoassay Kits Market Analysis - Size, Share, and Forecast Outlook 2025 to 2035
Animal Gastroesophageal Reflux Disease Market Size and Share Forecast Outlook 2025 to 2035
Animal Parasiticide Market Size and Share Forecast Outlook 2025 to 2035
Animal Feed Additives Market Analysis - Size, Share, & Forecast Outlook 2025 to 2035
Animal Feed Organic Trace Minerals Market Size and Share Forecast Outlook 2025 to 2035
Animal Nutrition Chemicals Market Analysis - Size, Share, and Forecast Outlook 2025 to 2035
Animal Artificial Insemination Market Report - Trends, Demand & Industry Forecast 2025 to 2035
Animal Wound Care Market Size and Share Forecast Outlook 2025 to 2035
Animal Parasiticides Market Size and Share Forecast Outlook 2025 to 2035

Thank you!
You will receive an email from our Business Development Manager. Please be sure to check your SPAM/JUNK folder too.
Chat With
MaRIA