Reports

- Global Locations -

Headquarters

Future Market Insights, Inc.

Christiana Corporate, 200
Continental Drive, Suite 401,
Newark, Delaware - 19713,
United States

T: +1-845-579-5705

Americas

Future Market Insights, Inc.

616 Corporate Way, Suite 2-9018,
Valley Cottage, NY 10989, United States

T: +1-347-918-3531

MEA

Future Market Insights

1602-6 Jumeirah Bay X2 Tower, Plot No: JLT-PH2-X2A,
Jumeirah Lakes Towers, Dubai,
United Arab Emirates

Europe

Future Market Insights

3rd Floor, 207 Regent Street,
W1B 3HH London
United Kingdom

T: + 44 (0) 20 8123 9659
D: +44 (0) 20 3287 4268

Asia Pacific

Future Market Insights

IndiaLand Global Tech Park, Unit UG-1, Behind Grand HighStreet, Phase 1, Hinjawadi, MH, Pune – 411057, India

Animal Feed Alternative Protein Market Snapshot (2023 to 2033)

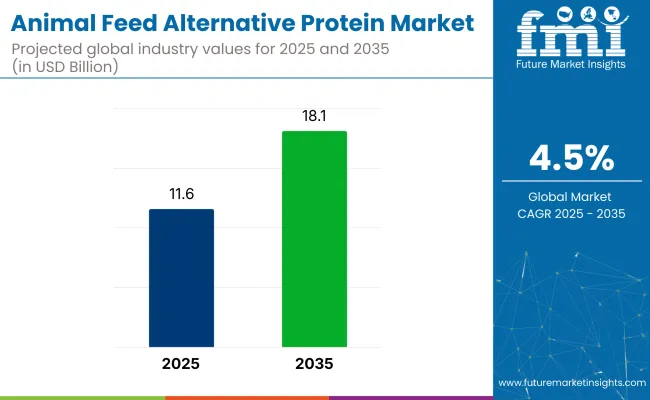
The global animal feed alternative protein market is expected to be valued at US$ 3.96 Billion in 2023 and will grow at a CAGR of 7.5%. Due to the increased number of cattle diseases, epidemics, and animal nutrition value, alternative protein consumption is becoming increasingly important, alternative protein consumption will increase to US$ 8.2 Billion by 2033, representing approximately 7.5% of the global market.

A vital role continues to be played by the poultry sector to improve the food security situation of consumers worldwide. It has been observed that poultry meat consumption has been on the rise in emerging nations. Additionally, urbanization and rising disposable income have changed dietary preferences, resulting in increased poultry consumption. Thus, there will be an increase in consumer demand for easy-to-digest, protein-rich diets free of antinutritive factors. However, stricter regulations regarding animal feed could hamper the growth of the alternative protein industry.

Substantial growth is expected in the global alternative protein market for animal feed in the coming years. During fermentation, antigens and oligosaccharides are removed, which contributes to the antinutritional quality of soybeans in the market. The above factors make fermented soy proteins a highly acceptable alternative to animal proteins in beginners' diets. A CAGR of nearly 8% is expected to be achieved in the Hamlet protein market by 2033.

Report Attribute Details
Expected Market Value (2023) US$ 3.96 Billion
Projected Forecast Value (2033) US$ 8.2 Billion
Global Growth Rate (2023 to 2033) 7.5% CAGR

Don't pay for what you don't need

Customize your report by selecting specific countries or regions and save 30%!

Animal Feed Alternative Protein Revenue Analysis 2018 to 2022 vs. Future Outlook 2023 to 2033

According to market research and competitive intelligence provider FMI, the animal feed alternative protein industry grew at a CAGR of 6.3% from 2018 to 2022. High demand for high-quality protein ingredients that are inexpensive yet nutritious is one of the main reasons why products are being increasingly adopted by consumers. A significant increase in the international insect protein market is being driven by the increasing government investment in the insect protein research market.

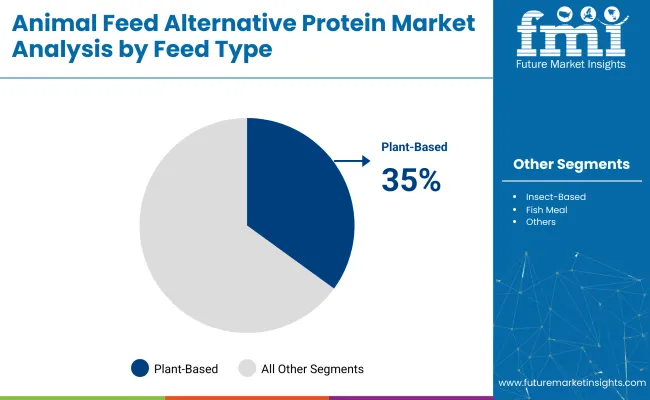
The livestock industry has always had a high demand for alternative proteins. As a result, food manufacturers are diversifying into alternative protein markets to satisfy consumer demands. The development of alternative proteins has been facilitated by technological advancement, ranging from microbial proteins to plant proteins. Therefore, plant-based proteins, such as pea protein, soy protein, and fermented soy protein, are becoming more popular due to this. Microbial protein is expected to be in high demand in the forecast period.

As a consequence of the outbreak of COVID-19, pet ownership has seen an increase in recent years. The growing sales of pet food likely contributed to the strong demand for alternative proteins since consumer awareness about soybean protein which is used in animal feed contains over 65% protein and met a wide range of nutritional requirements. Pet alternative protein food has seen an increase in demand.

What are the Key Factors Driving the Market for Alternative Proteins in Animal Feed?

The increase in the dairy products market and the growing demand for beef & beef products are the primary factors contributing to the growth of the animal feed alternative protein market. With the growing population and rise in economic standards that support a rise in dietary protein consumption, the animal feed alternative protein ingredients market share has seen a significant rise. Due to an increased awareness of the advantages of animal proteins, the production and consumption of animal proteins have increased significantly in recent years.

Protein demand among communities is fueled largely by the desire to boost immunity and gut health. A shift towards sustainable feed ingredients has increased the use of these alternative proteins in animal feed. As a result of the preference for ingredients that are resistant to heat treatment during processing, alternative protein sources will be added to wet pet food formulations to boost sales.

Growth in the edible insect farming industry, as well as environmental concerns about protein-rich meals, are driving the rapid growth of this segment. High demand for meat protein replacements, the availability of soy protein, and the many health benefits of soy protein will cause soy protein to grow rapidly in the market. Additionally, the demand for pea protein continues to increase throughout the projected period and is expected to expand at the fastest rate during the forecast period.

Stringent Regulatory Standards to drive the Animal Feed Alternative Protein market growth

An abundant variety of animal feed businesses and activities are regulated by legislation concerning animal feed sold in the market. Feed businesses must be approved or registered by the competent authority in order to use manufacture, or market feeds.

Regulations relating to feeding and storage, equipment maintenance, personnel training, and records are established. The regulatory system also establishes the specifications, labeling, and composition of animal feedstuffs, which includes provisions intended to protect the health of both animals and humans. In compliance with the legislation, the feed may be sold to livestock and used in feed production only if it is safe to use and does not adversely affect animal welfare or the environment.

Demand for FDA-approved alternative protein sources in the animal feed industry in response to consumer demand for pet health and concerns over protein sources to grow the market.

Nandini Roy Choudhury

Principal Consultant

Talk to Analyst

Find your sweet spots for generating winning opportunities in this market.

Why do Animal Feed Alternatives Market Growth Rates Seem to be Slowing?

According to forecasts, stock feed prices will decline as a result of stricter feed regulations and high feed prices. While there are many protein sources available on the market today, not all types of protein are suitable for use in the livestock industry, despite the fact that a wide range of proteins have been developed in the market. Therefore, a large number of research investments are made to find alternative proteins for a variety of animal species to achieve this purpose.

Furthermore, the business environment is likely to face major challenges in the short and medium-term, such as rigid trade restrictions, a lack of access to raw materials, and other factors that could negatively impact growth.

Country-wise Analysis

What Role Does North America Play in the Global Production of Alternative Proteins for Animal Feed?

Government Initiatives and Regulations Contribute to Growth in the Animal Feed Alternative Protein Market

According to the forecast, North American markets will lead in animal feed alternative proteins through the forecast period, accumulating a market share of 21%. As fast food outlets, hotels, and restaurants have expanded in North America, meat consumption has risen, resulting in a boom in the animal feed industry. Animal nutrition plays a pivotal role in propelling market growth by enhancing producers' attention to overall performance.

Approximately 60,000 pork producers in the USA grow more than 115 million hogs in the USA according to the National Pork Producers Council. Pork consumption in the USA has also increased from around 50 pounds in 2017 to approximately 51 pounds in 2019, with this consumption likely to rise further with the increased use of pork in restaurants and hotels. Pork consumption is expected to grow, which will boost the demand for pork feed. It is also predicted that producers will focus more on high-nutrition diets to improve performance as a result of the growing demand for healthy pig meat.

Regulatory changes to animal feed and pet food are expected to grow the market. A facility that rears insects using feedstock should be approved by American Feed Control Officials. Food waste generated by consumers can be used for the production of insect feedstocks if they are approved by the Canadian Food Inspection Agency. The application of insect meal as an ingredient for pet food has not received approval in the USA, but it is approved as an ingredient for poultry feed and salmonid feed in Canada. It has been approved for use as an ingredient for pet food but has not yet been approved for use in aqua feeds and poultry feeds.

What Makes Europe a Lucrative Market for Animal Feed Alternative Proteins?

A Growing Pet Adoption Rate and Demand for Pet Food are likely to Boost the Market's Growth in Europe

As of 2023, Europe is expected to retain its position as the leader in animal feed alternative proteins. According to the latest market share report, European animal feed alternative proteins account for 16.7% of global animal feed alternative proteins.

A high level of emphasis on improving the overall health and performance of livestock will encourage livestock farmers to use alternative proteins in feed formulations. As the practice of sustainable agriculture has grown in recent years, there has been an increased utilization of alternative proteins in poultry feeds to achieve the same economic target. This trend will therefore lead to the demand for alternative proteins in poultry feed. Due to the trends of pet adoption and the increasing ability to adopt pets, the pet food industry has experienced significant growth over the last decade.

Due to the high price of animal protein products in pet food, consumers may consider alternative protein supplements as an alternative to meat-based protein sources. With changing lifestyles, consumers are becoming more aware of pet health and the nutritional benefits of pet foods, which should lead to an increase in the market for alternative proteins in pet foods. All these factors will further increase market demand for animal feed alternative protein in the market.

What is the Impact of the Asia Pacific Region on the Animal Feed Alternative Protein Market?

Poultry Farming Demand will broaden Future Growth Prospects for the Animal Feed Alternative Proteins Market

With a revenue share of 12%, the animal feed alternative protein market dominates the Asia Pacific market. The production of this protein alternative feed is gaining popularity in countries, including China, and India, thus fueling the market for alternatives to animal feed proteins. Population growth increased meat, and dairy consumption, disposable incomes, and growing awareness about protein intake will facilitate market growth in the coming years.

A growing poultry farming industry and the demand for beef cattle are creating a market for animal feed alternative protein that will grow in the coming years. A continuous rise in the number of investments and initiatives from government agencies is expected to lead to further growth in the market for animal feed alternative proteins.

Get the data you need at a Fraction of the cost

Personalize your report by choosing insights you need
and save 40%!

Category-wise Insights

What is the Most Profitable Product Type Within the Animal Feed Alternative Protein Market?

Investing in Research and Development and Providing Sustainable Benefits Leads to High Revenue in the Animal Feed Insect Protein Market

Based on product type, the insect protein market is anticipated to grow over the next few years. The market for insect protein as an alternative protein for animal feed is projected to grow at a CAGR of 8.2% by 2033. Increasing sustainability makes insect protein one of the most attractive ingredients to add to conventional feed. Global meat production is expected to double by 2050, as the International Agriculture Organization estimates that the amount of food produced must increase by 70% around the world in order to feed everyone by 2050. Increasing protein demand has necessitated the development of sustainable protein alternatives, which will in turn contribute to the growth of the market for insect protein and alternative animal feed protein market.

Research and Development investments and increased demand for insect protein will continue to grow the market for animal feed alternative proteins. Insect protein, mainly used as an additive in feeds and pet foods, is predicted to reach half a million metric tons by 2030, and the market for insect protein is anticipated to grow from around 10,000 metric tons to 500,000 metric tons by 2060. Investments and partnerships are paving the way for the insect industry to expand. As technology improves, automation increases, genetics improves, and legislation changes, costs will also decrease. The industry will be able to expand supply more easily once it reaches half a million metric tons. Increasing production by twice or even quadrupling in volume will take less time.

How does Poultry dominate the Animal Feed Alternative Protein market?

Increased Demand for Poultry Meat will lead to an Increase in Sales of Animal Feed Alternative Proteins Market

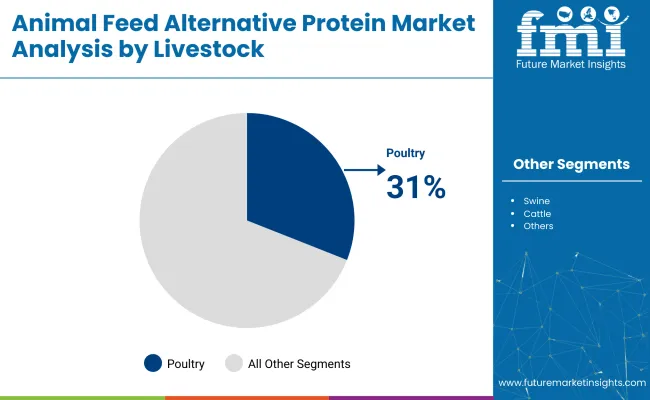
Among both emerging and developing nations, poultry is one of the most popular livestock commodities in the world. As new formulation software, new formulation methods, and new poultry storage facilities are developed, new advantages are being realized in alternative protein sources for poultry feed and the poultry nutrition markets. The promotion and use of feed additives such as premixes, protective materials, and microbial enzymes also contributed to enhancing the health benefits of the food. With the growth in the consumption of poultry meat, eggs, and dairy products, the market is expected to grow more rapidly in the future.

The availability of affordable, easy-to-process, and accessible alternative proteins is becoming increasingly apparent to poultry farmers as they become more aware of their benefits. Due to the rapid increase in the number of poultry products imported, poultry farmers are now deciding to look for alternative proteins to add to animal feed in order to meet consumer demands. These factors are all expected to contribute to the growth of the poultry feed protein market in the near future.

Start-up Scenario

How do New Entrants Contribute to the Animal Feed Alternative Protein Market?

Increasingly, startups are entering the market for animal feed alternative proteins in order to meet animal feed stock's alternative protein needs. These innovative backpack companies also offer reduced carbon footprints by using alternative proteins from the animal feed with additional features and long-lasting products. Startup companies are now developing innovative technologies and products for the market.

Some of the start-ups in the animal feed alternative protein market include-

  • The United Kingdom-based start-up Deep Branch aims to construct a carbon-to-protein conversion system that uses artificial intelligence. To generate proton, the company uses CO2 from industrial emissions and converts it into the desired form of energy. With its biological carbon recycling solution, the company provides a cost-effective solution that helps companies reduce their carbon footprints without negatively affecting operational costs.
  • USA-based start-up Calysta has established itself as one of the first producers of protein nutritional feeds marketed under the brand name FeedKind. This company produces fish, livestock, and pet food ingredients that are natural and traceable. A natural fermentation process is used to prepare its products from microbes that naturally occur in soil. A global joint marketing agreement has been signed between the company and Cargill and a plant has also been established as part of the agreement.
  • Unibio is an Odense-based start-up that uses fermentation technology to provide animal feed supplements. UniProtein is a highly concentrated protein product made from natural gas (methane) using the company's proprietary fermentation technology. Using this protein as a supplement to animal feed is then used as a direct means of providing this protein to animals. As a substitute for fishmeal, an increasingly scarce resource, it can replace fishmeal in feed.

Competitive Landscape

Strategic partnerships can help manufacturers increase revenue and increase market share by increasing production and meeting consumer demands. In addition to benefiting from new products and technologies, users will also benefit from the adoption of animal feed alternative Proteins. Production capabilities can be expanded through strategic partnerships.

Key players in the global animal feed alternative protein market include Hamlet Protein A/S, E.I. Du Pont De Nemours and Company, Archer Daniels Midland Company, Nordic Soy Oy, Deep Branch Biotechnology, CHS Inc., Agriprotein Gmbh., Darling Ingredients, Innovafeed, Ynsect, Angel Yeast, Calysta Inc., Lallemand, Inc., AB Mauri, Titan Biotech Limited Company, Sojaprotein, Crescent Biotech, The Scoular Company. Cargill Incorporated, Nutraferma LLC.

  • The National Power Company of Iceland has signed a memorandum of understanding with Deep Branch, a company that creates high-quality, sustainable food and feed ingredients, to explore the feasibility of constructing the company's first commercial-scale plant in Iceland. Designed for the animal feed industry, the facility will help Deep Branch scale up the production of Proton, a single-cell protein. With this deal, Deep Branch and Landsvirkjun are collaborating to do life cycle assessments (LCA) and techno-economic analyses (TEA). The agreement also reaffirms the commitment of the companies to collaborate and further investigate Iceland's eco-industrial cluster potential. By the end of 2022, it is expected that the results of the TEA and the LCA will be delivered to the project team.
  • Hamlet Protein sponsored the Global Feed Safety Summit 2022 in Berlin (Germany). A number of topics related to global feed safety and food safety, sustainable agriculture, and globalization were discussed during the conference. CEO Erik Visser of Hamlet Protein participated in a panel discussion addressing Challenges and Threats to Sufficient Food Supplies. The Hamlet Protein Company has worked with GMP+ for many years to achieve certification for the business. Both suppliers and customers are well aware of the quality standard, which ensures that quality is consistently maintained throughout the entire supply chain.

Report Scope

Report Attribute Details
Growth Rate (2023 to 2033) 7.5%
Expected Market Value (2023) US$ 3.96 Billion
Projected Forecast Value (2033) US$ 8.2 Billion
Base Year for Estimation 2022
Historical Data 2018 to 2022
Forecast Period 2023 to 2033
Quantitative Units Revenue in USD Million and CAGR from 2023 to 2033
Report Coverage Revenue Forecast, Volume Forecast, Company Ranking, Competitive Landscape, Growth Factors, Trends, and Pricing Analysis
Segments Covered
  • Product
  • Livestock
  • Region
Regions Covered
  • North America
  • Latin America
  • Europe
  • Asia Pacific
  • Middle East & Africa
Key Countries Profiled
  • USA
  • Canada
  • Brazil
  • Mexico
  • Germany
  • United Kingdom
  • France
  • Spain
  • Italy
  • China
  • Japan
  • South Korea
  • Singapore
  • Thailand
  • Indonesia
  • Australia
  • New Zealand
  • GCC Countries
  • South Africa
  • Israel
Key Companies Profiled
  • Hamlet Protein A/S
  • E.I. Du Pont De Nemours and Company
  • Archer Daniels Midland Company
  • Nordic Soy Oy
  • Deep Branch Biotechnology
  • CHS Inc.
  • Agriprotein Gmbh.
  • Darling Ingredients
  • Innovafeed
  • Ÿnsect
  • Angel Yeast
  • Calysta Inc.
  • Lallemand, Inc.
  • AB Mauri
  • Titan Biotech Limited Company
  • Sojaprotein
  • Crescent Biotech
  • The Scoular Company
  • Cargill Incorporated
  • Nutraferma LLC
  • Unibio
Customization Available Upon Request

Key Segments Covered in the Animal Feed Alternative Protein Market Industry Survey

Animal Feed Alternative Protein Market by Product:

  • Insect Protein
  • Soy Protein Isolates
  • Soy Protein Concentrate
  • Fermented Soy Protein
  • Duckweed
  • Single Cell Protein
    • Grain Protein
    • Fungal Protein
    • Yeast Protein
    • Algae Protein
    • Others
  • Hamlet Protein
  • Others

Animal Feed Alternative Protein Market by Livestock:

  • Poultry
    • Broiler
    • Layer
    • Turkey
    • Others
  • Swine
    • Starter
    • Grower
    • Swo
  • Cattle
    • Dairy
    • Calf
    • Others
  • Aquaculture
    • Salmon
    • Trout
    • Shrimps
    • Carp
    • Others
  • Pet Food
  • Equine

Animal Feed Alternative Protein Market by Region:

  • North America Animal Feed Alternative Protein Market
  • Latin America Animal Feed Alternative Protein Market
  • Europe Animal Feed Alternative Protein Market
  • Asia Pacific Animal Feed Alternative Protein Market
  • MEA Animal Feed Alternative Protein Market

Frequently Asked Questions

What is the expected valuation of the animal feed alternative protein market?

The global animal feed alternative protein market is likely to reach a valuation of US$ 3.96 Billion by the end of 2023.

Who are the key players in the animal feed alternative protein market?

Hamlet Protein A/S, E.I. Du Pont De Nemours and Company, Archer Daniels Midland Company, Nordic Soy Oy, Deep Branch Biotechnology, CHS Inc., Agriprotein Gmbh., Darling Ingredients, Innovafeed, Ynsect, Angel Yeast, Calysta Inc., Lallemand, Inc., AB Mauri, Titan Biotech Limited Company, Sojaprotein, Crescent Biotech, The Scoular Company. Cargill Incorporated, Nutraferma LLC.

What are the future prospects for animal feed alternative protein market sales?

Sales of the animal feed alternative protein market are likely to expand at 7.5% CAGR through 2033.

Which are the top 5 countries driving demand for the Animal Feed Alternative Protein market?

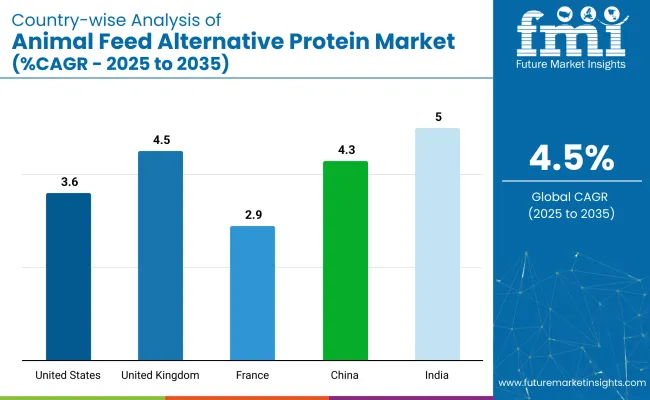
The USA, United Kingdom, Canada, China, and India are predicted to drive most of the animal feed alternative protein market demand.

What will be the global Animal Feed Alternative Protein market revenue total by 2033?

By the end of 2033, the global market for the Animal Feed Alternative Protein market is predicted to reach a valuation of US$ 8.2 Billion

Table of Content

1. Executive Summary | Animal Feed Alternative Protein Market

    1.1. Global Market Outlook

    1.2. Demand-side Trends

    1.3. Supply-side Trends

    1.4. Technology Roadmap Analysis

    1.5. Analysis and Recommendations

2. Market Overview

    2.1. Market Coverage / Taxonomy

    2.2. Market Definition / Scope / Limitations

3. Market Background

    3.1. Market Dynamics

        3.1.1. Drivers

        3.1.2. Restraints

        3.1.3. Opportunity

        3.1.4. Trends

    3.2. Scenario Forecast

        3.2.1. Demand in Optimistic Scenario

        3.2.2. Demand in Likely Scenario

        3.2.3. Demand in Conservative Scenario

    3.3. Opportunity Map Analysis

    3.4. Product Life Cycle Analysis

    3.5. Supply Chain Analysis

        3.5.1. Supply Side Participants and their Roles

            3.5.1.1. Producers

            3.5.1.2. Mid-Level Participants (Traders/ Agents/ Brokers)

            3.5.1.3. Wholesalers and Distributors

        3.5.2. Value Added and Value Created at Node in the Supply Chain

        3.5.3. List of Raw Material Suppliers

        3.5.4. List of Existing and Potential Buyers

    3.6. Investment Feasibility Matrix

    3.7. Value Chain Analysis

        3.7.1. Profit Margin Analysis

        3.7.2. Wholesalers and Distributors

        3.7.3. Retailers

    3.8. PESTLE and Porter’s Analysis

    3.9. Regulatory Landscape

        3.9.1. By Key Regions

        3.9.2. By Key Countries

    3.10. Regional Parent Market Outlook

    3.11. Production and Consumption Statistics

    3.12. Import and Export Statistics

4. Global Market Analysis 2018 to 2022 and Forecast, 2023 to 2033

    4.1. Historical Market Size Value (US$ Million) & Volume (Tons) Analysis, 2018 to 2022

    4.2. Current and Future Market Size Value (US$ Million) & Volume (Tons) Projections, 2023 to 2033

        4.2.1. Y-o-Y Growth Trend Analysis

        4.2.2. Absolute $ Opportunity Analysis

5. Global Market Analysis 2018 to 2022 and Forecast 2023 to 2033, By Product

    5.1. Introduction / Key Findings

    5.2. Historical Market Size Value (US$ Million) & Volume (Tons) Analysis By Product, 2018 to 2022

    5.3. Current and Future Market Size Value (US$ Million) & Volume (Tons) Analysis and Forecast By Product, 2023 to 2033

        5.3.1. Insect Protein

        5.3.2. Soy Protein Isolates

        5.3.3. Soy Protein Concentrate

        5.3.4. Fermented Soy Protein

        5.3.5. Duckweed

        5.3.6. Single Cell Protein

            5.3.6.1. Grain Protein

            5.3.6.2. Fungal Protein

            5.3.6.3. Yeast Protein

            5.3.6.4. Algae Protein

            5.3.6.5. Others

        5.3.7. Hamlet Protein

        5.3.8. Others

    5.4. Y-o-Y Growth Trend Analysis By Product, 2018 to 2022

    5.5. Absolute $ Opportunity Analysis By Product, 2023 to 2033

6. Global Market Analysis 2018 to 2022 and Forecast 2023 to 2033, By Livestock

    6.1. Introduction / Key Findings

    6.2. Historical Market Size Value (US$ Million) & Volume (Tons) Analysis By Livestock, 2018 to 2022

    6.3. Current and Future Market Size Value (US$ Million) & Volume (Tons) Analysis and Forecast By Livestock, 2023 to 2033

        6.3.1. Poultry

            6.3.1.1. Broiler

            6.3.1.2. Layer

            6.3.1.3. Turkey

            6.3.1.4. Others

        6.3.2. Swine

            6.3.2.1. Starter

            6.3.2.2. Grower

            6.3.2.3. Swo

        6.3.3. Cattle

            6.3.3.1. Dairy Animal

            6.3.3.2. Calf

            6.3.3.3. Others

        6.3.4. Aquaculture

            6.3.4.1. Salmon

            6.3.4.2. Trout

            6.3.4.3. Shrimp

            6.3.4.4. Carp

            6.3.4.5. Others

        6.3.5. Pet Food

        6.3.6. Equine

    6.4. Y-o-Y Growth Trend Analysis By Livestock, 2018 to 2022

    6.5. Absolute $ Opportunity Analysis By Livestock, 2023 to 2033

7. Global Market Analysis 2018 to 2022 and Forecast 2023 to 2033, By Region

    7.1. Introduction

    7.2. Historical Market Size Value (US$ Million) & Volume (Tons) Analysis By Region, 2018 to 2022

    7.3. Current Market Size Value (US$ Million) & Volume (Tons) Analysis and Forecast By Region, 2023 to 2033

        7.3.1. North America

        7.3.2. Latin America

        7.3.3. Europe

        7.3.4. Asia Pacific

        7.3.5. Middle East and Africa(MEA)

    7.4. Market Attractiveness Analysis By Region

8. North America Market Analysis 2018 to 2022 and Forecast 2023 to 2033, By Country

    8.1. Historical Market Size Value (US$ Million) & Volume (Tons) Trend Analysis By Market Taxonomy, 2018 to 2022

    8.2. Market Size Value (US$ Million) & Volume (Tons) Forecast By Market Taxonomy, 2023 to 2033

        8.2.1. By Country

            8.2.1.1. USA

            8.2.1.2. Canada

        8.2.2. By Product

        8.2.3. By Livestock

    8.3. Market Attractiveness Analysis

        8.3.1. By Country

        8.3.2. By Product

        8.3.3. By Livestock

    8.4. Key Takeaways

9. Latin America Market Analysis 2018 to 2022 and Forecast 2023 to 2033, By Country

    9.1. Historical Market Size Value (US$ Million) & Volume (Tons) Trend Analysis By Market Taxonomy, 2018 to 2022

    9.2. Market Size Value (US$ Million) & Volume (Tons) Forecast By Market Taxonomy, 2023 to 2033

        9.2.1. By Country

            9.2.1.1. Brazil

            9.2.1.2. Mexico

            9.2.1.3. Rest of Latin America

        9.2.2. By Product

        9.2.3. By Livestock

    9.3. Market Attractiveness Analysis

        9.3.1. By Country

        9.3.2. By Product

        9.3.3. By Livestock

    9.4. Key Takeaways

10. Europe Market Analysis 2018 to 2022 and Forecast 2023 to 2033, By Country

    10.1. Historical Market Size Value (US$ Million) & Volume (Tons) Trend Analysis By Market Taxonomy, 2018 to 2022

    10.2. Market Size Value (US$ Million) & Volume (Tons) Forecast By Market Taxonomy, 2023 to 2033

        10.2.1. By Country

            10.2.1.1. Germany

            10.2.1.2. United Kingdom

            10.2.1.3. France

            10.2.1.4. Spain

            10.2.1.5. Italy

            10.2.1.6. Rest of Europe

        10.2.2. By Product

        10.2.3. By Livestock

    10.3. Market Attractiveness Analysis

        10.3.1. By Country

        10.3.2. By Product

        10.3.3. By Livestock

    10.4. Key Takeaways

11. Asia Pacific Market Analysis 2018 to 2022 and Forecast 2023 to 2033, By Country

    11.1. Historical Market Size Value (US$ Million) & Volume (Tons) Trend Analysis By Market Taxonomy, 2018 to 2022

    11.2. Market Size Value (US$ Million) & Volume (Tons) Forecast By Market Taxonomy, 2023 to 2033

        11.2.1. By Country

            11.2.1.1. China

            11.2.1.2. Japan

            11.2.1.3. South Korea

            11.2.1.4. Singapore

            11.2.1.5. Thailand

            11.2.1.6. Indonesia

            11.2.1.7. Australia

            11.2.1.8. New Zealand

            11.2.1.9. Rest of Asia Pacific

        11.2.2. By Product

        11.2.3. By Livestock

    11.3. Market Attractiveness Analysis

        11.3.1. By Country

        11.3.2. By Product

        11.3.3. By Livestock

    11.4. Key Takeaways

12. MEA Market Analysis 2018 to 2022 and Forecast 2023 to 2033, By Country

    12.1. Historical Market Size Value (US$ Million) & Volume (Tons) Trend Analysis By Market Taxonomy, 2018 to 2022

    12.2. Market Size Value (US$ Million) & Volume (Tons) Forecast By Market Taxonomy, 2023 to 2033

        12.2.1. By Country

            12.2.1.1. GCC Countries

            12.2.1.2. South Africa

            12.2.1.3. Israel

            12.2.1.4. Rest of Middle East and Africa(MEA)

        12.2.2. By Product

        12.2.3. By Livestock

    12.3. Market Attractiveness Analysis

        12.3.1. By Country

        12.3.2. By Product

        12.3.3. By Livestock

    12.4. Key Takeaways

13. Key Countries Market Analysis

    13.1. USA

        13.1.1. Pricing Analysis

        13.1.2. Market Share Analysis, 2022

            13.1.2.1. By Product

            13.1.2.2. By Livestock

    13.2. Canada

        13.2.1. Pricing Analysis

        13.2.2. Market Share Analysis, 2022

            13.2.2.1. By Product

            13.2.2.2. By Livestock

    13.3. Brazil

        13.3.1. Pricing Analysis

        13.3.2. Market Share Analysis, 2022

            13.3.2.1. By Product

            13.3.2.2. By Livestock

    13.4. Mexico

        13.4.1. Pricing Analysis

        13.4.2. Market Share Analysis, 2022

            13.4.2.1. By Product

            13.4.2.2. By Livestock

    13.5. Germany

        13.5.1. Pricing Analysis

        13.5.2. Market Share Analysis, 2022

            13.5.2.1. By Product

            13.5.2.2. By Livestock

    13.6. United Kingdom

        13.6.1. Pricing Analysis

        13.6.2. Market Share Analysis, 2022

            13.6.2.1. By Product

            13.6.2.2. By Livestock

    13.7. France

        13.7.1. Pricing Analysis

        13.7.2. Market Share Analysis, 2022

            13.7.2.1. By Product

            13.7.2.2. By Livestock

    13.8. Spain

        13.8.1. Pricing Analysis

        13.8.2. Market Share Analysis, 2022

            13.8.2.1. By Product

            13.8.2.2. By Livestock

    13.9. Italy

        13.9.1. Pricing Analysis

        13.9.2. Market Share Analysis, 2022

            13.9.2.1. By Product

            13.9.2.2. By Livestock

    13.10. China

        13.10.1. Pricing Analysis

        13.10.2. Market Share Analysis, 2022

            13.10.2.1. By Product

            13.10.2.2. By Livestock

    13.11. Japan

        13.11.1. Pricing Analysis

        13.11.2. Market Share Analysis, 2022

            13.11.2.1. By Product

            13.11.2.2. By Livestock

    13.12. South Korea

        13.12.1. Pricing Analysis

        13.12.2. Market Share Analysis, 2022

            13.12.2.1. By Product

            13.12.2.2. By Livestock

    13.13. Singapore

        13.13.1. Pricing Analysis

        13.13.2. Market Share Analysis, 2022

            13.13.2.1. By Product

            13.13.2.2. By Livestock

    13.14. Thailand

        13.14.1. Pricing Analysis

        13.14.2. Market Share Analysis, 2022

            13.14.2.1. By Product

            13.14.2.2. By Livestock

    13.15. Indonesia

        13.15.1. Pricing Analysis

        13.15.2. Market Share Analysis, 2022

            13.15.2.1. By Product

            13.15.2.2. By Livestock

    13.16. Australia

        13.16.1. Pricing Analysis

        13.16.2. Market Share Analysis, 2022

            13.16.2.1. By Product

            13.16.2.2. By Livestock

    13.17. New Zealand

        13.17.1. Pricing Analysis

        13.17.2. Market Share Analysis, 2022

            13.17.2.1. By Product

            13.17.2.2. By Livestock

    13.18. GCC Countries

        13.18.1. Pricing Analysis

        13.18.2. Market Share Analysis, 2022

            13.18.2.1. By Product

            13.18.2.2. By Livestock

    13.19. South Africa

        13.19.1. Pricing Analysis

        13.19.2. Market Share Analysis, 2022

            13.19.2.1. By Product

            13.19.2.2. By Livestock

    13.20. Israel

        13.20.1. Pricing Analysis

        13.20.2. Market Share Analysis, 2022

            13.20.2.1. By Product

            13.20.2.2. By Livestock

14. Market Structure Analysis

    14.1. Competition Dashboard

    14.2. Competition Benchmarking

    14.3. Market Share Analysis of Top Players

        14.3.1. By Regional

        14.3.2. By Product

        14.3.3. By Livestock

15. Competition Analysis

    15.1. Competition Deep Dive

        15.1.1. Hamlet Protein A/S

            15.1.1.1. Overview

            15.1.1.2. Product Portfolio

            15.1.1.3. Profitability by Market Segments

            15.1.1.4. Sales Footprint

            15.1.1.5. Strategy Overview

                15.1.1.5.1. Marketing Strategy

                15.1.1.5.2. Product Strategy

                15.1.1.5.3. Channel Strategy

        15.1.2. E.I. Du Pont De Nemours And Company

            15.1.2.1. Overview

            15.1.2.2. Product Portfolio

            15.1.2.3. Profitability by Market Segments

            15.1.2.4. Sales Footprint

            15.1.2.5. Strategy Overview

                15.1.2.5.1. Marketing Strategy

                15.1.2.5.2. Product Strategy

                15.1.2.5.3. Channel Strategy

        15.1.3. Archer Daniels Midland Company

            15.1.3.1. Overview

            15.1.3.2. Product Portfolio

            15.1.3.3. Profitability by Market Segments

            15.1.3.4. Sales Footprint

            15.1.3.5. Strategy Overview

                15.1.3.5.1. Marketing Strategy

                15.1.3.5.2. Product Strategy

                15.1.3.5.3. Channel Strategy

        15.1.4. Nordic Soy Oy

            15.1.4.1. Overview

            15.1.4.2. Product Portfolio

            15.1.4.3. Profitability by Market Segments

            15.1.4.4. Sales Footprint

            15.1.4.5. Strategy Overview

                15.1.4.5.1. Marketing Strategy

                15.1.4.5.2. Product Strategy

                15.1.4.5.3. Channel Strategy

        15.1.5. Deep Branch Biotechnology

            15.1.5.1. Overview

            15.1.5.2. Product Portfolio

            15.1.5.3. Profitability by Market Segments

            15.1.5.4. Sales Footprint

            15.1.5.5. Strategy Overview

                15.1.5.5.1. Marketing Strategy

                15.1.5.5.2. Product Strategy

                15.1.5.5.3. Channel Strategy

        15.1.6. CHS Inc.

            15.1.6.1. Overview

            15.1.6.2. Product Portfolio

            15.1.6.3. Profitability by Market Segments

            15.1.6.4. Sales Footprint

            15.1.6.5. Strategy Overview

                15.1.6.5.1. Marketing Strategy

                15.1.6.5.2. Product Strategy

                15.1.6.5.3. Channel Strategy

        15.1.7. Agriprotein Gmbh.

            15.1.7.1. Overview

            15.1.7.2. Product Portfolio

            15.1.7.3. Profitability by Market Segments

            15.1.7.4. Sales Footprint

            15.1.7.5. Strategy Overview

                15.1.7.5.1. Marketing Strategy

                15.1.7.5.2. Product Strategy

                15.1.7.5.3. Channel Strategy

        15.1.8. Darling Ingredients

            15.1.8.1. Overview

            15.1.8.2. Product Portfolio

            15.1.8.3. Profitability by Market Segments

            15.1.8.4. Sales Footprint

            15.1.8.5. Strategy Overview

                15.1.8.5.1. Marketing Strategy

                15.1.8.5.2. Product Strategy

                15.1.8.5.3. Channel Strategy

        15.1.9. Innovafeed

            15.1.9.1. Overview

            15.1.9.2. Product Portfolio

            15.1.9.3. Profitability by Market Segments

            15.1.9.4. Sales Footprint

            15.1.9.5. Strategy Overview

                15.1.9.5.1. Marketing Strategy

                15.1.9.5.2. Product Strategy

                15.1.9.5.3. Channel Strategy

        15.1.10. Ÿnsect

            15.1.10.1. Overview

            15.1.10.2. Product Portfolio

            15.1.10.3. Profitability by Market Segments

            15.1.10.4. Sales Footprint

            15.1.10.5. Strategy Overview

                15.1.10.5.1. Marketing Strategy

                15.1.10.5.2. Product Strategy

                15.1.10.5.3. Channel Strategy

        15.1.11. Angel Yeast

            15.1.11.1. Overview

            15.1.11.2. Product Portfolio

            15.1.11.3. Profitability by Market Segments

            15.1.11.4. Sales Footprint

            15.1.11.5. Strategy Overview

                15.1.11.5.1. Marketing Strategy

                15.1.11.5.2. Product Strategy

                15.1.11.5.3. Channel Strategy

        15.1.12. Calysta Inc.

            15.1.12.1. Overview

            15.1.12.2. Product Portfolio

            15.1.12.3. Profitability by Market Segments

            15.1.12.4. Sales Footprint

            15.1.12.5. Strategy Overview

                15.1.12.5.1. Marketing Strategy

                15.1.12.5.2. Product Strategy

                15.1.12.5.3. Channel Strategy

        15.1.13. Lallemand, Inc.

            15.1.13.1. Overview

            15.1.13.2. Product Portfolio

            15.1.13.3. Profitability by Market Segments

            15.1.13.4. Sales Footprint

            15.1.13.5. Strategy Overview

                15.1.13.5.1. Marketing Strategy

                15.1.13.5.2. Product Strategy

                15.1.13.5.3. Channel Strategy

        15.1.14. AB Mauri

            15.1.14.1. Overview

            15.1.14.2. Product Portfolio

            15.1.14.3. Profitability by Market Segments

            15.1.14.4. Sales Footprint

            15.1.14.5. Strategy Overview

                15.1.14.5.1. Marketing Strategy

                15.1.14.5.2. Product Strategy

                15.1.14.5.3. Channel Strategy

        15.1.15. Titan Biotech Limited Company

            15.1.15.1. Overview

            15.1.15.2. Product Portfolio

            15.1.15.3. Profitability by Market Segments

            15.1.15.4. Sales Footprint

            15.1.15.5. Strategy Overview

                15.1.15.5.1. Marketing Strategy

                15.1.15.5.2. Product Strategy

                15.1.15.5.3. Channel Strategy

        15.1.16. Sojaprotein

            15.1.16.1. Overview

            15.1.16.2. Product Portfolio

            15.1.16.3. Profitability by Market Segments

            15.1.16.4. Sales Footprint

            15.1.16.5. Strategy Overview

                15.1.16.5.1. Marketing Strategy

                15.1.16.5.2. Product Strategy

                15.1.16.5.3. Channel Strategy

        15.1.17. Crescent Biotech

            15.1.17.1. Overview

            15.1.17.2. Product Portfolio

            15.1.17.3. Profitability by Market Segments

            15.1.17.4. Sales Footprint

            15.1.17.5. Strategy Overview

                15.1.17.5.1. Marketing Strategy

                15.1.17.5.2. Product Strategy

                15.1.17.5.3. Channel Strategy

        15.1.18. The Scoular Company

            15.1.18.1. Overview

            15.1.18.2. Product Portfolio

            15.1.18.3. Profitability by Market Segments

            15.1.18.4. Sales Footprint

            15.1.18.5. Strategy Overview

                15.1.18.5.1. Marketing Strategy

                15.1.18.5.2. Product Strategy

                15.1.18.5.3. Channel Strategy

        15.1.19. Cargill Incorporated

            15.1.19.1. Overview

            15.1.19.2. Product Portfolio

            15.1.19.3. Profitability by Market Segments

            15.1.19.4. Sales Footprint

            15.1.19.5. Strategy Overview

                15.1.19.5.1. Marketing Strategy

                15.1.19.5.2. Product Strategy

                15.1.19.5.3. Channel Strategy

        15.1.20. Nutraferma LLC

            15.1.20.1. Overview

            15.1.20.2. Product Portfolio

            15.1.20.3. Profitability by Market Segments

            15.1.20.4. Sales Footprint

            15.1.20.5. Strategy Overview

                15.1.20.5.1. Marketing Strategy

                15.1.20.5.2. Product Strategy

                15.1.20.5.3. Channel Strategy

        15.1.21. Unibio

            15.1.21.1. Overview

            15.1.21.2. Product Portfolio

            15.1.21.3. Profitability by Market Segments

            15.1.21.4. Sales Footprint

            15.1.21.5. Strategy Overview

                15.1.21.5.1. Marketing Strategy

                15.1.21.5.2. Product Strategy

                15.1.21.5.3. Channel Strategy

        15.1.22. Calysta

            15.1.22.1. Overview

            15.1.22.2. Product Portfolio

            15.1.22.3. Profitability by Market Segments

            15.1.22.4. Sales Footprint

            15.1.22.5. Strategy Overview

                15.1.22.5.1. Marketing Strategy

                15.1.22.5.2. Product Strategy

                15.1.22.5.3. Channel Strategy

16. Assumptions & Acronyms Used

17. Research Methodology

Don't pay for what you don't need

Customize your report by selecting specific countries or regions and save 30%!

List of Tables

Table 1: Global Market Value (US$ Million) Forecast by Region, 2018 to 2033

Table 2: Global Market Volume (Tons) Forecast by Region, 2018 to 2033

Table 3: Global Market Value (US$ Million) Forecast by Product, 2018 to 2033

Table 4: Global Market Volume (Tons) Forecast by Product, 2018 to 2033

Table 5: Global Market Value (US$ Million) Forecast by Livestock, 2018 to 2033

Table 6: Global Market Volume (Tons) Forecast by Livestock, 2018 to 2033

Table 7: North America Market Value (US$ Million) Forecast by Country, 2018 to 2033

Table 8: North America Market Volume (Tons) Forecast by Country, 2018 to 2033

Table 9: North America Market Value (US$ Million) Forecast by Product, 2018 to 2033

Table 10: North America Market Volume (Tons) Forecast by Product, 2018 to 2033

Table 11: North America Market Value (US$ Million) Forecast by Livestock, 2018 to 2033

Table 12: North America Market Volume (Tons) Forecast by Livestock, 2018 to 2033

Table 13: Latin America Market Value (US$ Million) Forecast by Country, 2018 to 2033

Table 14: Latin America Market Volume (Tons) Forecast by Country, 2018 to 2033

Table 15: Latin America Market Value (US$ Million) Forecast by Product, 2018 to 2033

Table 16: Latin America Market Volume (Tons) Forecast by Product, 2018 to 2033

Table 17: Latin America Market Value (US$ Million) Forecast by Livestock, 2018 to 2033

Table 18: Latin America Market Volume (Tons) Forecast by Livestock, 2018 to 2033

Table 19: Europe Market Value (US$ Million) Forecast by Country, 2018 to 2033

Table 20: Europe Market Volume (Tons) Forecast by Country, 2018 to 2033

Table 21: Europe Market Value (US$ Million) Forecast by Product, 2018 to 2033

Table 22: Europe Market Volume (Tons) Forecast by Product, 2018 to 2033

Table 23: Europe Market Value (US$ Million) Forecast by Livestock, 2018 to 2033

Table 24: Europe Market Volume (Tons) Forecast by Livestock, 2018 to 2033

Table 25: Asia Pacific Market Value (US$ Million) Forecast by Country, 2018 to 2033

Table 26: Asia Pacific Market Volume (Tons) Forecast by Country, 2018 to 2033

Table 27: Asia Pacific Market Value (US$ Million) Forecast by Product, 2018 to 2033

Table 28: Asia Pacific Market Volume (Tons) Forecast by Product, 2018 to 2033

Table 29: Asia Pacific Market Value (US$ Million) Forecast by Livestock, 2018 to 2033

Table 30: Asia Pacific Market Volume (Tons) Forecast by Livestock, 2018 to 2033

Table 31: MEA Market Value (US$ Million) Forecast by Country, 2018 to 2033

Table 32: MEA Market Volume (Tons) Forecast by Country, 2018 to 2033

Table 33: MEA Market Value (US$ Million) Forecast by Product, 2018 to 2033

Table 34: MEA Market Volume (Tons) Forecast by Product, 2018 to 2033

Table 35: MEA Market Value (US$ Million) Forecast by Livestock, 2018 to 2033

Table 36: MEA Market Volume (Tons) Forecast by Livestock, 2018 to 2033
Nandini Roy Choudhury

Principal Consultant

Talk to Analyst

Find your sweet spots for generating winning opportunities in this market.

List of Charts

Figure 1: Global Market Value (US$ Million) by Product, 2023 to 2033

Figure 2: Global Market Value (US$ Million) by Livestock, 2023 to 2033

Figure 3: Global Market Value (US$ Million) by Region, 2023 to 2033

Figure 4: Global Market Value (US$ Million) Analysis by Region, 2018 to 2033

Figure 5: Global Market Volume (Tons) Analysis by Region, 2018 to 2033

Figure 6: Global Market Value Share (%) and BPS Analysis by Region, 2023 to 2033

Figure 7: Global Market Y-o-Y Growth (%) Projections by Region, 2023 to 2033

Figure 8: Global Market Value (US$ Million) Analysis by Product, 2018 to 2033

Figure 9: Global Market Volume (Tons) Analysis by Product, 2018 to 2033

Figure 10: Global Market Value Share (%) and BPS Analysis by Product, 2023 to 2033

Figure 11: Global Market Y-o-Y Growth (%) Projections by Product, 2023 to 2033

Figure 12: Global Market Value (US$ Million) Analysis by Livestock, 2018 to 2033

Figure 13: Global Market Volume (Tons) Analysis by Livestock, 2018 to 2033

Figure 14: Global Market Value Share (%) and BPS Analysis by Livestock, 2023 to 2033

Figure 15: Global Market Y-o-Y Growth (%) Projections by Livestock, 2023 to 2033

Figure 16: Global Market Attractiveness by Product, 2023 to 2033

Figure 17: Global Market Attractiveness by Livestock, 2023 to 2033

Figure 18: Global Market Attractiveness by Region, 2023 to 2033

Figure 19: North America Market Value (US$ Million) by Product, 2023 to 2033

Figure 20: North America Market Value (US$ Million) by Livestock, 2023 to 2033

Figure 21: North America Market Value (US$ Million) by Country, 2023 to 2033

Figure 22: North America Market Value (US$ Million) Analysis by Country, 2018 to 2033

Figure 23: North America Market Volume (Tons) Analysis by Country, 2018 to 2033

Figure 24: North America Market Value Share (%) and BPS Analysis by Country, 2023 to 2033

Figure 25: North America Market Y-o-Y Growth (%) Projections by Country, 2023 to 2033

Figure 26: North America Market Value (US$ Million) Analysis by Product, 2018 to 2033

Figure 27: North America Market Volume (Tons) Analysis by Product, 2018 to 2033

Figure 28: North America Market Value Share (%) and BPS Analysis by Product, 2023 to 2033

Figure 29: North America Market Y-o-Y Growth (%) Projections by Product, 2023 to 2033

Figure 30: North America Market Value (US$ Million) Analysis by Livestock, 2018 to 2033

Figure 31: North America Market Volume (Tons) Analysis by Livestock, 2018 to 2033

Figure 32: North America Market Value Share (%) and BPS Analysis by Livestock, 2023 to 2033

Figure 33: North America Market Y-o-Y Growth (%) Projections by Livestock, 2023 to 2033

Figure 34: North America Market Attractiveness by Product, 2023 to 2033

Figure 35: North America Market Attractiveness by Livestock, 2023 to 2033

Figure 36: North America Market Attractiveness by Country, 2023 to 2033

Figure 37: Latin America Market Value (US$ Million) by Product, 2023 to 2033

Figure 38: Latin America Market Value (US$ Million) by Livestock, 2023 to 2033

Figure 39: Latin America Market Value (US$ Million) by Country, 2023 to 2033

Figure 40: Latin America Market Value (US$ Million) Analysis by Country, 2018 to 2033

Figure 41: Latin America Market Volume (Tons) Analysis by Country, 2018 to 2033

Figure 42: Latin America Market Value Share (%) and BPS Analysis by Country, 2023 to 2033

Figure 43: Latin America Market Y-o-Y Growth (%) Projections by Country, 2023 to 2033

Figure 44: Latin America Market Value (US$ Million) Analysis by Product, 2018 to 2033

Figure 45: Latin America Market Volume (Tons) Analysis by Product, 2018 to 2033

Figure 46: Latin America Market Value Share (%) and BPS Analysis by Product, 2023 to 2033

Figure 47: Latin America Market Y-o-Y Growth (%) Projections by Product, 2023 to 2033

Figure 48: Latin America Market Value (US$ Million) Analysis by Livestock, 2018 to 2033

Figure 49: Latin America Market Volume (Tons) Analysis by Livestock, 2018 to 2033

Figure 50: Latin America Market Value Share (%) and BPS Analysis by Livestock, 2023 to 2033

Figure 51: Latin America Market Y-o-Y Growth (%) Projections by Livestock, 2023 to 2033

Figure 52: Latin America Market Attractiveness by Product, 2023 to 2033

Figure 53: Latin America Market Attractiveness by Livestock, 2023 to 2033

Figure 54: Latin America Market Attractiveness by Country, 2023 to 2033

Figure 55: Europe Market Value (US$ Million) by Product, 2023 to 2033

Figure 56: Europe Market Value (US$ Million) by Livestock, 2023 to 2033

Figure 57: Europe Market Value (US$ Million) by Country, 2023 to 2033

Figure 58: Europe Market Value (US$ Million) Analysis by Country, 2018 to 2033

Figure 59: Europe Market Volume (Tons) Analysis by Country, 2018 to 2033

Figure 60: Europe Market Value Share (%) and BPS Analysis by Country, 2023 to 2033

Figure 61: Europe Market Y-o-Y Growth (%) Projections by Country, 2023 to 2033

Figure 62: Europe Market Value (US$ Million) Analysis by Product, 2018 to 2033

Figure 63: Europe Market Volume (Tons) Analysis by Product, 2018 to 2033

Figure 64: Europe Market Value Share (%) and BPS Analysis by Product, 2023 to 2033

Figure 65: Europe Market Y-o-Y Growth (%) Projections by Product, 2023 to 2033

Figure 66: Europe Market Value (US$ Million) Analysis by Livestock, 2018 to 2033

Figure 67: Europe Market Volume (Tons) Analysis by Livestock, 2018 to 2033

Figure 68: Europe Market Value Share (%) and BPS Analysis by Livestock, 2023 to 2033

Figure 69: Europe Market Y-o-Y Growth (%) Projections by Livestock, 2023 to 2033

Figure 70: Europe Market Attractiveness by Product, 2023 to 2033

Figure 71: Europe Market Attractiveness by Livestock, 2023 to 2033

Figure 72: Europe Market Attractiveness by Country, 2023 to 2033

Figure 73: Asia Pacific Market Value (US$ Million) by Product, 2023 to 2033

Figure 74: Asia Pacific Market Value (US$ Million) by Livestock, 2023 to 2033

Figure 75: Asia Pacific Market Value (US$ Million) by Country, 2023 to 2033

Figure 76: Asia Pacific Market Value (US$ Million) Analysis by Country, 2018 to 2033

Figure 77: Asia Pacific Market Volume (Tons) Analysis by Country, 2018 to 2033

Figure 78: Asia Pacific Market Value Share (%) and BPS Analysis by Country, 2023 to 2033

Figure 79: Asia Pacific Market Y-o-Y Growth (%) Projections by Country, 2023 to 2033

Figure 80: Asia Pacific Market Value (US$ Million) Analysis by Product, 2018 to 2033

Figure 81: Asia Pacific Market Volume (Tons) Analysis by Product, 2018 to 2033

Figure 82: Asia Pacific Market Value Share (%) and BPS Analysis by Product, 2023 to 2033

Figure 83: Asia Pacific Market Y-o-Y Growth (%) Projections by Product, 2023 to 2033

Figure 84: Asia Pacific Market Value (US$ Million) Analysis by Livestock, 2018 to 2033

Figure 85: Asia Pacific Market Volume (Tons) Analysis by Livestock, 2018 to 2033

Figure 86: Asia Pacific Market Value Share (%) and BPS Analysis by Livestock, 2023 to 2033

Figure 87: Asia Pacific Market Y-o-Y Growth (%) Projections by Livestock, 2023 to 2033

Figure 88: Asia Pacific Market Attractiveness by Product, 2023 to 2033

Figure 89: Asia Pacific Market Attractiveness by Livestock, 2023 to 2033

Figure 90: Asia Pacific Market Attractiveness by Country, 2023 to 2033

Figure 91: MEA Market Value (US$ Million) by Product, 2023 to 2033

Figure 92: MEA Market Value (US$ Million) by Livestock, 2023 to 2033

Figure 93: MEA Market Value (US$ Million) by Country, 2023 to 2033

Figure 94: MEA Market Value (US$ Million) Analysis by Country, 2018 to 2033

Figure 95: MEA Market Volume (Tons) Analysis by Country, 2018 to 2033

Figure 96: MEA Market Value Share (%) and BPS Analysis by Country, 2023 to 2033

Figure 97: MEA Market Y-o-Y Growth (%) Projections by Country, 2023 to 2033

Figure 98: MEA Market Value (US$ Million) Analysis by Product, 2018 to 2033

Figure 99: MEA Market Volume (Tons) Analysis by Product, 2018 to 2033

Figure 100: MEA Market Value Share (%) and BPS Analysis by Product, 2023 to 2033

Figure 101: MEA Market Y-o-Y Growth (%) Projections by Product, 2023 to 2033

Figure 102: MEA Market Value (US$ Million) Analysis by Livestock, 2018 to 2033

Figure 103: MEA Market Volume (Tons) Analysis by Livestock, 2018 to 2033

Figure 104: MEA Market Value Share (%) and BPS Analysis by Livestock, 2023 to 2033

Figure 105: MEA Market Y-o-Y Growth (%) Projections by Livestock, 2023 to 2033

Figure 106: MEA Market Attractiveness by Product, 2023 to 2033

Figure 107: MEA Market Attractiveness by Livestock, 2023 to 2033

Figure 108: MEA Market Attractiveness by Country, 2023 to 2033

Recommendations

Food and Beverage

Animal Feed Additive Market

Published : January 2024

Food and Beverage

Animal Feed Probiotic Market

Published : January 2024

Food and Beverage

Animal Feed Ingredients Market

Published : June 2023

Explore Food and Beverage Insights

View Reports

Animal Feed Alternative Protein Market