Reports

- Global Locations -

Headquarters

Future Market Insights, Inc.

Christiana Corporate, 200
Continental Drive, Suite 401,
Newark, Delaware - 19713,
United States

T: +1-845-579-5705

Americas

Future Market Insights, Inc.

616 Corporate Way, Suite 2-9018,
Valley Cottage, NY 10989, United States

T: +1-347-918-3531

MEA

Future Market Insights

1602-6 Jumeirah Bay X2 Tower, Plot No: JLT-PH2-X2A,
Jumeirah Lakes Towers, Dubai,
United Arab Emirates

Europe

Future Market Insights

3rd Floor, 207 Regent Street,
W1B 3HH London
United Kingdom

T: + 44 (0) 20 8123 9659
D: +44 (0) 20 3287 4268

Asia Pacific

Future Market Insights

IndiaLand Global Tech Park, Unit UG-1, Behind Grand HighStreet, Phase 1, Hinjawadi, MH, Pune – 411057, India

Animal Wound Care Market Outlook (2022 to 2032)

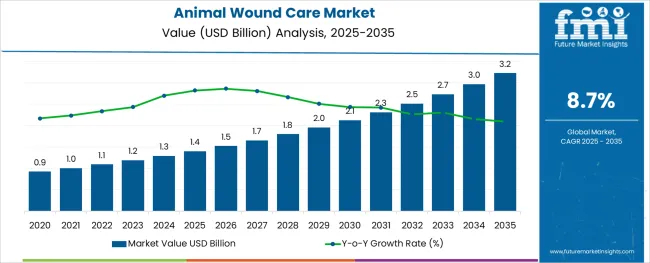
A newly released Animal Wound Care Market analysis report by Future Market Insights shows that global sales of in 2021 were held at US$ 1 billion. With 8.7%, the projected market growth from 2022 to 2032 is expected to be significantly higher than the historical growth. Surgical Wound Care Products is expected to be the highest revenue-generating grade category, projected to register an opportunity of 10.4% CAGR from 2022 to 2032.

Attributes Details
Global Animal Wound Care Market Size (2022) US$ 1.1 billion
Global Animal Wound Care Market Size (2032) US$ 2.6 billion
Global Animal Wound Care Market CAGR (2022 to 2032) 8.7%
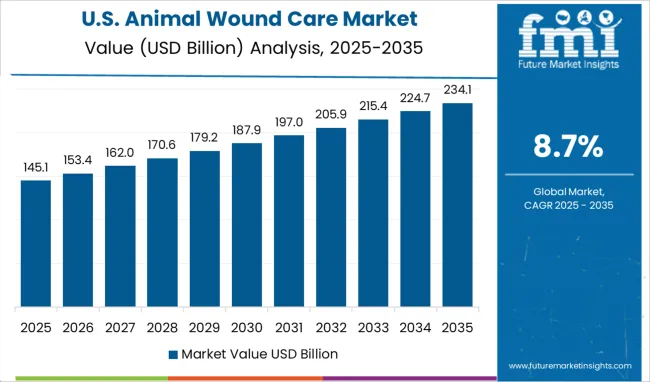
USA Animal Wound Care Market CAGR (2022 to 2032) 14.7%
Key Companies Covered
  • Elanco Animal Health
  • Medtronic PLC
  • B. Braun Melsungen AG
  • Virbac
  • Jorgen Kruuse A/S
  • Dechra Pharmaceuticals
  • Neogen Corporation
  • Ethicon, Inc.
  • Sonoma Pharmaceuticals Inc.
  • Jazz Medical LLC
  • Prima-Vet Inc.

Don't pay for what you don't need

Customize your report by selecting specific countries or regions and save 30%!

Revenue of Animal Wound Care Market from 2017 to 2021 Compared to Demand Outlook for 2022 to 2032

As per the Animal Wound Care Market research by Future Market Insights - a market research and competitive intelligence provider, historically, from 2017 to 2021, the market value of the market increased at around 7.3% CAGR.

The key factors driving the market of the animal wound care market are increased government and animal welfare association initiatives, as well as enhanced animal adoption and animal healthcare spending. Also, businesses are creating new companion animal products, which are anticipated to boost the market. For example, PetCare created a combo kit offering for pet health in March 2021. For pet health and wellness, this package contains Conditioning Tea Tree Oil Shampoo, Hot Spot Relief cream, and Skin and Coat Health Chews.

Which Factors are Propelling Animal Wound Care Market Demand?

The demand for effective and early wound care products is expected to rise during the forecast period due to the high prevalence of diseases that cause wounds in animals. Increasing authorization and product launches of new animal wound care products are expected to be prominent drivers for the animal wound care market. The market is being propelled by the increased adoption of companion animals and rising demand for veterinary surgeries. Furthermore, the rising number of veterinary visits is fuelling market expansion. The market is expanding due to the rising consumption of animal protein and advancements in wound care products.

Sabyasachi Ghosh
Sabyasachi Ghosh

Principal Consultant

Talk to Analyst

Find your sweet spots for generating winning opportunities in this market.

Region-wise Analysis

Which Region is projected to Offer the Largest Opportunity for the Animal Wound Care Market?

North America held the largest animal wound care market, accounting for 32% of the global market in 2021. The increased efforts made by key players to promote their product portfolio and ensure standards are anticipated to fuel the regional market for wound care products. Elanco Animal Health will launch a new flea-preventative ointment in June 2020 to expand its product portfolio.

The demand for animal wound care in the Asia Pacific is expected to grow rapidly over the projected timeline. Since most nations rely on agricultural producers and exporters, the availability of domesticated animals is widespread and expected to grow significantly. Furthermore, raising awareness about livestock diseases fuels regional market growth. High disposable income increases the likelihood of growing adoption of domestic pets, which broadens future growth prospects. Furthermore, it is expected that regular updates to healthcare infrastructure will provide the marketplace with potential growth opportunities over the forthcoming years.

Country-wise Analysis

The USA Animal Wound Care Market Analysis

The United States is expected to account for the largest market share of US$ 693.7 million by the end of 2032. According to the Animal Cancer Foundation, canine and cat cancer is widespread in the United States, and the number is expected to grow by approximately six million cases annually. The country houses more than 65 million dogs and 35 million cats.
Furthermore, stringent government regulation pertaining to pet well-being is propelling revenue. For example, it is illegal under Canadian law to wilfully overlook, wound, injure, or maim an animal. Laws governing the treatment and care of farm animals are also in place in provinces and territories, which aids growth. European federal legislation has mandated the use of post-operative care in animals.

The United Kingdom Animal Wound Care Market Analysis

There were nearly 13 million dogs, 12 million cats, 1.6 million indoor birds, and 1.4 million domestic fowl in the United Kingdom in 2021. Owing to these figures, the market for animal wound care in the country is projected to reach a valuation of US$ 133.5 million by 2032. The market in the country is expected to garner an absolute dollar opportunity of US$ 79.7 million from 2022 to 2032.

Japan Animal Wound Care Market Analysis

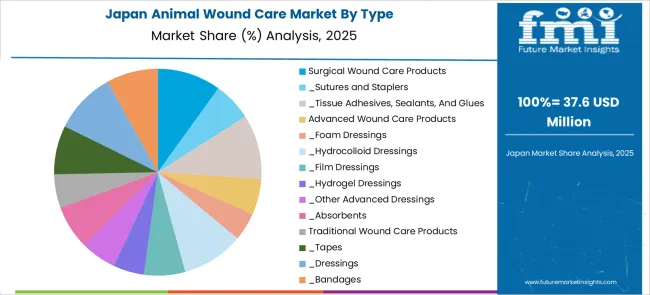
Pet fondness in Japan can be estimated from the fact that it is the only country globally where pets outnumber children. According to the Japan Pet Food Association, the country is populated with 17 million children under 16 years of age, whereas it constitutes nearly 20 million cats and dogs. With these statistics, the market for animal wound care in Japan is expected to reach a valuation of US$ 147 million by 2032, growing at a CAGR of 10.9% from 2022 to 2032.

Get the data you need at a Fraction of the cost

Personalize your report by choosing insights you need
and save 40%!

Category-wise Insights

Why do Surgical Wound Care Products Dominate the Animal Wound Care Market?

The Surgical Wound Care Products is expected to account for the highest CAGR of 10.4% by the end of 2032. Sutures, staplers, and tissue adhesives are examples of surgical wound care products. Skin staplers have grown in popularity due to benefits such as ease of use, reduced surgical procedure time, and ease of removal. Depending on the application, absorbable or non-absorbable sutures can be used. Surgeries sutures and suture cassettes are used to provide temporary assistance for wound healing in a variety of veterinary surgeries, including orthopedic, cardiovascular, and neurological procedures.

Why Animal Wound Care Market through Companion Animals is projected to Witness the Fastest Growth?

In 2021, the market through companion animals held the largest market for animal wound care, with a revenue share of more than 64%. The segment captured the lion's share as pet healthcare spending increased, particularly in developed regions. One of the key growth drivers for animal wound care is the growing demand for non-invasive surgeries. Modern surgeries have numerous advantages, such as relatively small surgical wounds and fewer stitches, giving pet parents confidence to choose advanced minimally invasive surgical operations.
Competitive Analysis

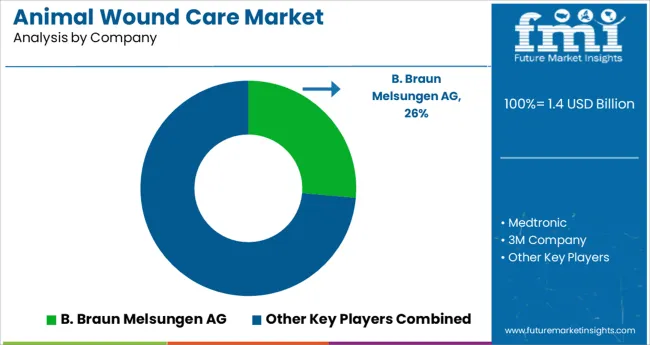
To gain a competitive advantage in the animal wound care market, key players are planning to invest in strategies such as growth plans, product launches, mergers, and partnerships. Some of the key players operating in the market include Elanco Animal Health, Medtronic PLC, B. Braun Melsungen AG, Virbac, Jorgen Kruuse A/S, Dechra Pharmaceuticals, Neogen Corporation, Ethicon, Inc., Sonoma Pharmaceuticals Inc., Jazz Medical LLC, and Prima-Vet Inc.

Some of the recent developments in the Animal Wound Care Market are:

  • In April 2022, Neogen Corporation announced the introduction of new products to its dependable Prozap insect control line, featuring Prozap Protectus Pour-On Insecticide IGR. This triple-acting formula kills chewing and sucking lice, horn flies, stable flies, horse and deer flies, and other insects on beef cattle and calves.

The active ingredients of the product include an insect growth regulator (IGR), an adulticide, and a synergist that provides protection from infestations, kills louse eggs before hatching, and results in season-long lice control in one application.

  • In February 2020, Elanco Animal Health Inc. announced a joint research contract with Purdue University and the Purdue Research Foundation. The parties are collaborating on a five-year project aimed at encouraging the development of teams capable of providing creative solutions to animal health problems.

Elanco will collaborate with Purdue's life science researchers, who specialize in animal science, systems biology, protein evolution, and engineering, microbiome discovery, and clinical veterinary medicine. As part of the agreement, Elanco and Purdue's Life Sciences would therefore work on a broad array of research projects in Purdue's laboratories.

  • In June 2019, B. Braun Melsungen announced the acquisition of STAVMED LLC in Russia to expand the company's foothold there and add six dialysis centers to its service lineup.

Similarly, more recent developments related to companies in Animal Wound Care Market services have been tracked by the team at Future Market Insights, which are available in the full report.

Market Segments Covered in Animal Wound Care Market Analysis

By Type:

  • Surgical Wound Care Products
    • Sutures and Staplers
    • Tissue Adhesives, Sealants, And Glues
  • Advanced Wound Care Products
    • Foam Dressings
    • Hydrocolloid Dressings
    • Film Dressings
    • Hydrogel Dressings
    • Other Advanced Dressings
    • Absorbents
  • Traditional Wound Care Products
    • Tapes
    • Dressings
    • Bandages
    • Absorbents
    • Other Traditional Wound Care Products
  • Therapy Devices

By Animal Type:

  • Companion Animal
  • Livestock animal

By End-user:

  • Veterinary hospitals & clinics
  • Homecare
  • Research Institutes

By Distribution Channel:

  • Retail
  • E-commerce
  • Veterinary hospitals & clinics

By Region:

  • North America
  • Europe
  • Asia Pacific
  • Middle East and Africa
  • Latin America

Frequently Asked Questions

How much is the current worth of the Animal Wound Care Market?

The Global Animal Wound Care Market is worth US$ 1.1 billion at present.

What is the sales forecast for the Animal Wound Care Market?

The market value is projected to increase at a CAGR of around 8.7% from 2022 to 2032.

What was the last 5 year’s market CAGR?

The value of the Animal Wound Care Market increased at a CAGR of around 7.3% from 2017 to 2021.

At what percentage is the sales of the Animal Wound Care Market going to register growth in the USA?

The market in the USA is projected to expand at a CAGR of around 14.7% from 2022 to 2032.

Table of Content

1. Executive Summary | Animal Wound Care Market

    1.1. Global Market Outlook

    1.2. Demand-side Trends

    1.3. Supply-side Trends

    1.4. Technology Roadmap Analysis

    1.5. Analysis and Recommendations

2. Market Overview

    2.1. Market Coverage / Taxonomy

    2.2. Market Definition / Scope / Limitations

3. Market Background

    3.1. Market Dynamics

        3.1.1. Drivers

        3.1.2. Restraints

        3.1.3. Opportunity

        3.1.4. Trends

    3.2. Scenario Forecast

        3.2.1. Demand in Optimistic Scenario

        3.2.2. Demand in Likely Scenario

        3.2.3. Demand in Conservative Scenario

    3.3. Opportunity Map Analysis

    3.4. Product Life Cycle Analysis

    3.5. Supply Chain Analysis

    3.6. Investment Feasibility Matrix

    3.7. PESTLE and Porter’s Analysis

    3.8. Regulatory Landscape

        3.8.1. By Key Regions

        3.8.2. By Key Countries

4. Global Market Analysis 2017 to 2021 and Forecast, 2022 to 2032

    4.1. Historical Market Size Value (US$ million) Analysis, 2017 to 2021

    4.2. Current and Future Market Size Value (US$ million) Projections, 2022 to 2032

        4.2.1. Y-o-Y Growth Trend Analysis

        4.2.2. Absolute $ Opportunity Analysis

5. Global Market Analysis 2017 to 2021 and Forecast 2022 to 2032, By Product Type

    5.1. Introduction / Key Findings

    5.2. Historical Market Size Value (US$ million) Analysis By Product Type, 2017 to 2021

    5.3. Current and Future Market Size Value (US$ million) Analysis and Forecast By Product Type, 2022 to 2032

        5.3.1. Surgical Wound Care Products

            5.3.1.1. Sutures and Staplers

            5.3.1.2. Tissue Adhesives, Sealants, And Glues

        5.3.2. Advanced Wound Care Products

            5.3.2.1. Foam Dressings

            5.3.2.2. Hydrocolloid Dressings

            5.3.2.3. Film Dressings

            5.3.2.4. Hydrogel Dressings

            5.3.2.5. Absorbents

            5.3.2.6. Other Advanced Dressings

        5.3.3. Traditional Wound Care Products

            5.3.3.1. Tapes

            5.3.3.2. Dressings

            5.3.3.3. Bandages

            5.3.3.4. Absorbents

            5.3.3.5. Other Traditional Wound Care Products

        5.3.4. Therapy Devices

    5.4. Y-o-Y Growth Trend Analysis By Product Type, 2017 to 2021

    5.5. Absolute $ Opportunity Analysis By Product Type, 2022 to 2032

6. Global Market Analysis 2017 to 2021 and Forecast 2022 to 2032, By Animal Type

    6.1. Introduction / Key Findings

    6.2. Historical Market Size Value (US$ million) Analysis By Animal Type, 2017 to 2021

    6.3. Current and Future Market Size Value (US$ million) Analysis and Forecast By Animal Type, 2022 to 2032

        6.3.1. Companion Animal

        6.3.2. Livestock Animal

    6.4. Y-o-Y Growth Trend Analysis By Animal Type, 2017 to 2021

    6.5. Absolute $ Opportunity Analysis By Animal Type, 2022 to 2032

7. Global Market Analysis 2017 to 2021 and Forecast 2022 to 2032, By End User

    7.1. Introduction / Key Findings

    7.2. Historical Market Size Value (US$ million) Analysis By End User, 2017 to 2021

    7.3. Current and Future Market Size Value (US$ million) Analysis and Forecast By End User, 2022 to 2032

        7.3.1. Veterinary hospitals & clinics

        7.3.2. Homecare

        7.3.3. Research Institutes

    7.4. Y-o-Y Growth Trend Analysis By End User, 2017 to 2021

    7.5. Absolute $ Opportunity Analysis By End User, 2022 to 2032

8. Global Market Analysis 2017 to 2021 and Forecast 2022 to 2032, By Distribution Channel

    8.1. Introduction / Key Findings

    8.2. Historical Market Size Value (US$ million) Analysis By Distribution Channel, 2017 to 2021

    8.3. Current and Future Market Size Value (US$ million) Analysis and Forecast By Distribution Channel, 2022 to 2032

        8.3.1. Retail

        8.3.2. E-commerce

        8.3.3. Veterinary hospitals & clinics

    8.4. Y-o-Y Growth Trend Analysis By Distribution Channel, 2017 to 2021

    8.5. Absolute $ Opportunity Analysis By Distribution Channel, 2022 to 2032

9. Global Market Analysis 2017 to 2021 and Forecast 2022 to 2032, By Region

    9.1. Introduction

    9.2. Historical Market Size Value (US$ million) Analysis By Region, 2017 to 2021

    9.3. Current Market Size Value (US$ million) Analysis and Forecast By Region, 2022 to 2032

        9.3.1. North America

        9.3.2. Latin America

        9.3.3. Europe

        9.3.4. East Asia

        9.3.5. South Asia

        9.3.6. Oceania

        9.3.7. Middle East and Africa (MEA)

    9.4. Market Attractiveness Analysis By Region

10. North America Market Analysis 2017 to 2021 and Forecast 2022 to 2032, By Country

    10.1. Historical Market Size Value (US$ million) Trend Analysis By Market Taxonomy, 2017 to 2021

    10.2. Market Size Value (US$ million) Forecast By Market Taxonomy, 2022 to 2032

        10.2.1. By Country

            10.2.1.1. The USA

            10.2.1.2. Canada

        10.2.2. By Product Type

        10.2.3. By Animal Type

        10.2.4. By End User

        10.2.5. By Distribution Channel

    10.3. Market Attractiveness Analysis

        10.3.1. By Country

        10.3.2. By Product Type

        10.3.3. By Animal Type

        10.3.4. By End User

        10.3.5. By Distribution Channel

    10.4. Key Takeaways

11. Latin America Market Analysis 2017 to 2021 and Forecast 2022 to 2032, By Country

    11.1. Historical Market Size Value (US$ million) Trend Analysis By Market Taxonomy, 2017 to 2021

    11.2. Market Size Value (US$ million) Forecast By Market Taxonomy, 2022 to 2032

        11.2.1. By Country

            11.2.1.1. Brazil

            11.2.1.2. Mexico

            11.2.1.3. Argentina

            11.2.1.4. Rest of Latin America

        11.2.2. By Product Type

        11.2.3. By Animal Type

        11.2.4. By End User

        11.2.5. By Distribution Channel

    11.3. Market Attractiveness Analysis

        11.3.1. By Country

        11.3.2. By Product Type

        11.3.3. By Animal Type

        11.3.4. By End User

        11.3.5. By Distribution Channel

    11.4. Key Takeaways

12. Europe Market Analysis 2017 to 2021 and Forecast 2022 to 2032, By Country

    12.1. Historical Market Size Value (US$ million) Trend Analysis By Market Taxonomy, 2017 to 2021

    12.2. Market Size Value (US$ million) Forecast By Market Taxonomy, 2022 to 2032

        12.2.1. By Country

            12.2.1.1. Germany

            12.2.1.2. Italy

            12.2.1.3. France

            12.2.1.4. The United Kingdom

            12.2.1.5. Spain

            12.2.1.6. Russia

            12.2.1.7. BENELUX

            12.2.1.8. Rest of Europe

        12.2.2. By Product Type

        12.2.3. By Animal Type

        12.2.4. By End User

        12.2.5. By Distribution Channel

    12.3. Market Attractiveness Analysis

        12.3.1. By Country

        12.3.2. By Product Type

        12.3.3. By Animal Type

        12.3.4. By End User

        12.3.5. By Distribution Channel

    12.4. Key Takeaways

13. East Asia Market Analysis 2017 to 2021 and Forecast 2022 to 2032, By Country

    13.1. Historical Market Size Value (US$ million) Trend Analysis By Market Taxonomy, 2017 to 2021

    13.2. Market Size Value (US$ million) Forecast By Market Taxonomy, 2022 to 2032

        13.2.1. By Country

            13.2.1.1. China

            13.2.1.2. Japan

            13.2.1.3. South Korea

        13.2.2. By Product Type

        13.2.3. By Animal Type

        13.2.4. By End User

        13.2.5. By Distribution Channel

    13.3. Market Attractiveness Analysis

        13.3.1. By Country

        13.3.2. By Product Type

        13.3.3. By Animal Type

        13.3.4. By End User

        13.3.5. By Distribution Channel

    13.4. Key Takeaways

14. South Asia Market Analysis 2017 to 2021 and Forecast 2022 to 2032, By Country

    14.1. Historical Market Size Value (US$ million) Trend Analysis By Market Taxonomy, 2017 to 2021

    14.2. Market Size Value (US$ million) Forecast By Market Taxonomy, 2022 to 2032

        14.2.1. By Country

            14.2.1.1. India

            14.2.1.2. Thailand

            14.2.1.3. Malaysia

            14.2.1.4. Indonesia

            14.2.1.5. Rest of South Asia

        14.2.2. By Product Type

        14.2.3. By Animal Type

        14.2.4. By End User

        14.2.5. By Distribution Channel

    14.3. Market Attractiveness Analysis

        14.3.1. By Country

        14.3.2. By Product Type

        14.3.3. By Animal Type

        14.3.4. By End User

        14.3.5. By Distribution Channel

    14.4. Key Takeaways

15. Oceania Market Analysis 2017 to 2021 and Forecast 2022 to 2032, By Country

    15.1. Historical Market Size Value (US$ million) Trend Analysis By Market Taxonomy, 2017 to 2021

    15.2. Market Size Value (US$ million) Forecast By Market Taxonomy, 2022 to 2032

        15.2.1. By Country

            15.2.1.1. Australia

            15.2.1.2. New Zealand

        15.2.2. By Product Type

        15.2.3. By Animal Type

        15.2.4. By End User

        15.2.5. By Distribution Channel

    15.3. Market Attractiveness Analysis

        15.3.1. By Country

        15.3.2. By Product Type

        15.3.3. By Animal Type

        15.3.4. By End User

        15.3.5. By Distribution Channel

    15.4. Key Takeaways

16. MEA Market Analysis 2017 to 2021 and Forecast 2022 to 2032, By Country

    16.1. Historical Market Size Value (US$ million) Trend Analysis By Market Taxonomy, 2017 to 2021

    16.2. Market Size Value (US$ million) Forecast By Market Taxonomy, 2022 to 2032

        16.2.1. By Country

            16.2.1.1. GCC

            16.2.1.2. Rest of MEA

        16.2.2. By Product Type

        16.2.3. By Animal Type

        16.2.4. By End User

        16.2.5. By Distribution Channel

    16.3. Market Attractiveness Analysis

        16.3.1. By Country

        16.3.2. By Product Type

        16.3.3. By Animal Type

        16.3.4. By End User

        16.3.5. By Distribution Channel

    16.4. Key Takeaways

17. Key Countries Market Analysis

    17.1. The USA

        17.1.1. Pricing Analysis

        17.1.2. Market Share Analysis, 2021

            17.1.2.1. By Product Type

            17.1.2.2. By Animal Type

            17.1.2.3. By End User

            17.1.2.4. By Distribution Channel

    17.2. Canada

        17.2.1. Pricing Analysis

        17.2.2. Market Share Analysis, 2021

            17.2.2.1. By Product Type

            17.2.2.2. By Animal Type

            17.2.2.3. By End User

            17.2.2.4. By Distribution Channel

    17.3. Brazil

        17.3.1. Pricing Analysis

        17.3.2. Market Share Analysis, 2021

            17.3.2.1. By Product Type

            17.3.2.2. By Animal Type

            17.3.2.3. By End User

            17.3.2.4. By Distribution Channel

    17.4. Mexico

        17.4.1. Pricing Analysis

        17.4.2. Market Share Analysis, 2021

            17.4.2.1. By Product Type

            17.4.2.2. By Animal Type

            17.4.2.3. By End User

            17.4.2.4. By Distribution Channel

    17.5. Argentina

        17.5.1. Pricing Analysis

        17.5.2. Market Share Analysis, 2021

            17.5.2.1. By Product Type

            17.5.2.2. By Animal Type

            17.5.2.3. By End User

            17.5.2.4. By Distribution Channel

    17.6. Germany

        17.6.1. Pricing Analysis

        17.6.2. Market Share Analysis, 2021

            17.6.2.1. By Product Type

            17.6.2.2. By Animal Type

            17.6.2.3. By End User

            17.6.2.4. By Distribution Channel

    17.7. Italy

        17.7.1. Pricing Analysis

        17.7.2. Market Share Analysis, 2021

            17.7.2.1. By Product Type

            17.7.2.2. By Animal Type

            17.7.2.3. By End User

            17.7.2.4. By Distribution Channel

    17.8. France

        17.8.1. Pricing Analysis

        17.8.2. Market Share Analysis, 2021

            17.8.2.1. By Product Type

            17.8.2.2. By Animal Type

            17.8.2.3. By End User

            17.8.2.4. By Distribution Channel

    17.9. The United Kingdom

        17.9.1. Pricing Analysis

        17.9.2. Market Share Analysis, 2021

            17.9.2.1. By Product Type

            17.9.2.2. By Animal Type

            17.9.2.3. By End User

            17.9.2.4. By Distribution Channel

    17.10. Spain

        17.10.1. Pricing Analysis

        17.10.2. Market Share Analysis, 2021

            17.10.2.1. By Product Type

            17.10.2.2. By Animal Type

            17.10.2.3. By End User

            17.10.2.4. By Distribution Channel

    17.11. Russia

        17.11.1. Pricing Analysis

        17.11.2. Market Share Analysis, 2021

            17.11.2.1. By Product Type

            17.11.2.2. By Animal Type

            17.11.2.3. By End User

            17.11.2.4. By Distribution Channel

    17.12. BENELUX

        17.12.1. Pricing Analysis

        17.12.2. Market Share Analysis, 2021

            17.12.2.1. By Product Type

            17.12.2.2. By Animal Type

            17.12.2.3. By End User

            17.12.2.4. By Distribution Channel

    17.13. China

        17.13.1. Pricing Analysis

        17.13.2. Market Share Analysis, 2021

            17.13.2.1. By Product Type

            17.13.2.2. By Animal Type

            17.13.2.3. By End User

            17.13.2.4. By Distribution Channel

    17.14. Japan

        17.14.1. Pricing Analysis

        17.14.2. Market Share Analysis, 2021

            17.14.2.1. By Product Type

            17.14.2.2. By Animal Type

            17.14.2.3. By End User

            17.14.2.4. By Distribution Channel

    17.15. South Korea

        17.15.1. Pricing Analysis

        17.15.2. Market Share Analysis, 2021

            17.15.2.1. By Product Type

            17.15.2.2. By Animal Type

            17.15.2.3. By End User

            17.15.2.4. By Distribution Channel

    17.16. India

        17.16.1. Pricing Analysis

        17.16.2. Market Share Analysis, 2021

            17.16.2.1. By Product Type

            17.16.2.2. By Animal Type

            17.16.2.3. By End User

            17.16.2.4. By Distribution Channel

    17.17. Thailand

        17.17.1. Pricing Analysis

        17.17.2. Market Share Analysis, 2021

            17.17.2.1. By Product Type

            17.17.2.2. By Animal Type

            17.17.2.3. By End User

            17.17.2.4. By Distribution Channel

    17.18. Malaysia

        17.18.1. Pricing Analysis

        17.18.2. Market Share Analysis, 2021

            17.18.2.1. By Product Type

            17.18.2.2. By Animal Type

            17.18.2.3. By End User

            17.18.2.4. By Distribution Channel

    17.19. Indonesia

        17.19.1. Pricing Analysis

        17.19.2. Market Share Analysis, 2021

            17.19.2.1. By Product Type

            17.19.2.2. By Animal Type

            17.19.2.3. By End User

            17.19.2.4. By Distribution Channel

    17.20. Australia

        17.20.1. Pricing Analysis

        17.20.2. Market Share Analysis, 2021

            17.20.2.1. By Product Type

            17.20.2.2. By Animal Type

            17.20.2.3. By End User

            17.20.2.4. By Distribution Channel

    17.21. New Zealand

        17.21.1. Pricing Analysis

        17.21.2. Market Share Analysis, 2021

            17.21.2.1. By Product Type

            17.21.2.2. By Animal Type

            17.21.2.3. By End User

            17.21.2.4. By Distribution Channel

    17.22. GCC Countries

        17.22.1. Pricing Analysis

        17.22.2. Market Share Analysis, 2021

            17.22.2.1. By Product Type

            17.22.2.2. By Animal Type

            17.22.2.3. By End User

            17.22.2.4. By Distribution Channel

18. Market Structure Analysis

    18.1. Competition Dashboard

    18.2. Competition Benchmarking

    18.3. Market Share Analysis of Top Players

        18.3.1. By Regional

        18.3.2. By Product Type

        18.3.3. By Animal Type

        18.3.4. By End User

        18.3.5. By Distribution Channel

19. Competition Analysis

    19.1. Competition Deep Dive

        19.1.1. B. Braun Melsungen AG

            19.1.1.1. Overview

            19.1.1.2. Product Portfolio

            19.1.1.3. Profitability by Market Segments (Product/Age /Sales Channel/Region)

            19.1.1.4. Sales Footprint

            19.1.1.5. Strategy Overview

                19.1.1.5.1. Marketing Strategy

                19.1.1.5.2. Product Strategy

                19.1.1.5.3. Channel Strategy

        19.1.2. Medtronic

            19.1.2.1. Overview

            19.1.2.2. Product Portfolio

            19.1.2.3. Profitability by Market Segments (Product/Age /Sales Channel/Region)

            19.1.2.4. Sales Footprint

            19.1.2.5. Strategy Overview

                19.1.2.5.1. Marketing Strategy

                19.1.2.5.2. Product Strategy

                19.1.2.5.3. Channel Strategy

        19.1.3. 3M Company

            19.1.3.1. Overview

            19.1.3.2. Product Portfolio

            19.1.3.3. Profitability by Market Segments (Product/Age /Sales Channel/Region)

            19.1.3.4. Sales Footprint

            19.1.3.5. Strategy Overview

                19.1.3.5.1. Marketing Strategy

                19.1.3.5.2. Product Strategy

                19.1.3.5.3. Channel Strategy

        19.1.4. Johnson & Johnson (Ethicon)

            19.1.4.1. Overview

            19.1.4.2. Product Portfolio

            19.1.4.3. Profitability by Market Segments (Product/Age /Sales Channel/Region)

            19.1.4.4. Sales Footprint

            19.1.4.5. Strategy Overview

                19.1.4.5.1. Marketing Strategy

                19.1.4.5.2. Product Strategy

                19.1.4.5.3. Channel Strategy

        19.1.5. Virbac

            19.1.5.1. Overview

            19.1.5.2. Product Portfolio

            19.1.5.3. Profitability by Market Segments (Product/Age /Sales Channel/Region)

            19.1.5.4. Sales Footprint

            19.1.5.5. Strategy Overview

                19.1.5.5.1. Marketing Strategy

                19.1.5.5.2. Product Strategy

                19.1.5.5.3. Channel Strategy

        19.1.6. Advancis Veterinary Ltd

            19.1.6.1. Overview

            19.1.6.2. Product Portfolio

            19.1.6.3. Profitability by Market Segments (Product/Age /Sales Channel/Region)

            19.1.6.4. Sales Footprint

            19.1.6.5. Strategy Overview

                19.1.6.5.1. Marketing Strategy

                19.1.6.5.2. Product Strategy

                19.1.6.5.3. Channel Strategy

        19.1.7. Innovacyn, Inc.

            19.1.7.1. Overview

            19.1.7.2. Product Portfolio

            19.1.7.3. Profitability by Market Segments (Product/Age /Sales Channel/Region)

            19.1.7.4. Sales Footprint

            19.1.7.5. Strategy Overview

                19.1.7.5.1. Marketing Strategy

                19.1.7.5.2. Product Strategy

                19.1.7.5.3. Channel Strategy

        19.1.8. Robinson Healthcare

            19.1.8.1. Overview

            19.1.8.2. Product Portfolio

            19.1.8.3. Profitability by Market Segments (Product/Age /Sales Channel/Region)

            19.1.8.4. Sales Footprint

            19.1.8.5. Strategy Overview

                19.1.8.5.1. Marketing Strategy

                19.1.8.5.2. Product Strategy

                19.1.8.5.3. Channel Strategy

        19.1.9. NEOGEN Corporation

            19.1.9.1. Overview

            19.1.9.2. Product Portfolio

            19.1.9.3. Profitability by Market Segments (Product/Age /Sales Channel/Region)

            19.1.9.4. Sales Footprint

            19.1.9.5. Strategy Overview

                19.1.9.5.1. Marketing Strategy

                19.1.9.5.2. Product Strategy

                19.1.9.5.3. Channel Strategy

        19.1.10. KeriCure, Inc.

            19.1.10.1. Overview

            19.1.10.2. Product Portfolio

            19.1.10.3. Profitability by Market Segments (Product/Age /Sales Channel/Region)

            19.1.10.4. Sales Footprint

            19.1.10.5. Strategy Overview

                19.1.10.5.1. Marketing Strategy

                19.1.10.5.2. Product Strategy

                19.1.10.5.3. Channel Strategy

        19.1.11. Sonoma Pharmaceuticals, Inc.

            19.1.11.1. Overview

            19.1.11.2. Product Portfolio

            19.1.11.3. Profitability by Market Segments (Product/Age /Sales Channel/Region)

            19.1.11.4. Sales Footprint

            19.1.11.5. Strategy Overview

                19.1.11.5.1. Marketing Strategy

                19.1.11.5.2. Product Strategy

                19.1.11.5.3. Channel Strategy

20. Assumptions & Acronyms Used

21. Research Methodology

Don't pay for what you don't need

Customize your report by selecting specific countries or regions and save 30%!

List of Tables

Table 1: Global Market Value (US$ million) Forecast by Region, 2017 to 2032

Table 2: Global Market Value (US$ million) Forecast by Product Type, 2017 to 2032

Table 3: Global Market Value (US$ million) Forecast by Animal Type, 2017 to 2032

Table 4: Global Market Value (US$ million) Forecast by End User, 2017 to 2032

Table 5: Global Market Value (US$ million) Forecast by Distribution Channel, 2017 to 2032

Table 6: North America Market Value (US$ million) Forecast by Country, 2017 to 2032

Table 7: North America Market Value (US$ million) Forecast by Product Type, 2017 to 2032

Table 8: North America Market Value (US$ million) Forecast by Animal Type, 2017 to 2032

Table 9: North America Market Value (US$ million) Forecast by End User, 2017 to 2032

Table 10: North America Market Value (US$ million) Forecast by Distribution Channel, 2017 to 2032

Table 11: Latin America Market Value (US$ million) Forecast by Country, 2017 to 2032

Table 12: Latin America Market Value (US$ million) Forecast by Product Type, 2017 to 2032

Table 13: Latin America Market Value (US$ million) Forecast by Animal Type, 2017 to 2032

Table 14: Latin America Market Value (US$ million) Forecast by End User, 2017 to 2032

Table 15: Latin America Market Value (US$ million) Forecast by Distribution Channel, 2017 to 2032

Table 16: Europe Market Value (US$ million) Forecast by Country, 2017 to 2032

Table 17: Europe Market Value (US$ million) Forecast by Product Type, 2017 to 2032

Table 18: Europe Market Value (US$ million) Forecast by Animal Type, 2017 to 2032

Table 19: Europe Market Value (US$ million) Forecast by End User, 2017 to 2032

Table 20: Europe Market Value (US$ million) Forecast by Distribution Channel, 2017 to 2032

Table 21: East Asia Market Value (US$ million) Forecast by Country, 2017 to 2032

Table 22: East Asia Market Value (US$ million) Forecast by Product Type, 2017 to 2032

Table 23: East Asia Market Value (US$ million) Forecast by Animal Type, 2017 to 2032

Table 24: East Asia Market Value (US$ million) Forecast by End User, 2017 to 2032

Table 25: East Asia Market Value (US$ million) Forecast by Distribution Channel, 2017 to 2032

Table 26: South Asia Market Value (US$ million) Forecast by Country, 2017 to 2032

Table 27: South Asia Market Value (US$ million) Forecast by Product Type, 2017 to 2032

Table 28: South Asia Market Value (US$ million) Forecast by Animal Type, 2017 to 2032

Table 29: South Asia Market Value (US$ million) Forecast by End User, 2017 to 2032

Table 30: South Asia Market Value (US$ million) Forecast by Distribution Channel, 2017 to 2032

Table 31: Oceania Market Value (US$ million) Forecast by Country, 2017 to 2032

Table 32: Oceania Market Value (US$ million) Forecast by Product Type, 2017 to 2032

Table 33: Oceania Market Value (US$ million) Forecast by Animal Type, 2017 to 2032

Table 34: Oceania Market Value (US$ million) Forecast by End User, 2017 to 2032

Table 35: Oceania Market Value (US$ million) Forecast by Distribution Channel, 2017 to 2032

Table 36: MEA Market Value (US$ million) Forecast by Country, 2017 to 2032

Table 37: MEA Market Value (US$ million) Forecast by Product Type, 2017 to 2032

Table 38: MEA Market Value (US$ million) Forecast by Animal Type, 2017 to 2032

Table 39: MEA Market Value (US$ million) Forecast by End User, 2017 to 2032

Table 40: MEA Market Value (US$ million) Forecast by Distribution Channel, 2017 to 2032
Sabyasachi Ghosh
Sabyasachi Ghosh

Principal Consultant

Talk to Analyst

Find your sweet spots for generating winning opportunities in this market.

List of Charts

Figure 1: Global Market Value (US$ million) by Product Type, 2022 to 2032

Figure 2: Global Market Value (US$ million) by Animal Type, 2022 to 2032

Figure 3: Global Market Value (US$ million) by End User, 2022 to 2032

Figure 4: Global Market Value (US$ million) by Distribution Channel, 2022 to 2032

Figure 5: Global Market Value (US$ million) by Region, 2022 to 2032

Figure 6: Global Market Value (US$ million) Analysis by Region, 2017 to 2032

Figure 7: Global Market Value Share (%) and BPS Analysis by Region, 2022 to 2032

Figure 8: Global Market Y-o-Y Growth (%) Projections by Region, 2022 to 2032

Figure 9: Global Market Value (US$ million) Analysis by Product Type, 2017 to 2032

Figure 10: Global Market Value Share (%) and BPS Analysis by Product Type, 2022 to 2032

Figure 11: Global Market Y-o-Y Growth (%) Projections by Product Type, 2022 to 2032

Figure 12: Global Market Value (US$ million) Analysis by Animal Type, 2017 to 2032

Figure 13: Global Market Value Share (%) and BPS Analysis by Animal Type, 2022 to 2032

Figure 14: Global Market Y-o-Y Growth (%) Projections by Animal Type, 2022 to 2032

Figure 15: Global Market Value (US$ million) Analysis by End User, 2017 to 2032

Figure 16: Global Market Value Share (%) and BPS Analysis by End User, 2022 to 2032

Figure 17: Global Market Y-o-Y Growth (%) Projections by End User, 2022 to 2032

Figure 18: Global Market Value (US$ million) Analysis by Distribution Channel, 2017 to 2032

Figure 19: Global Market Value Share (%) and BPS Analysis by Distribution Channel, 2022 to 2032

Figure 20: Global Market Y-o-Y Growth (%) Projections by Distribution Channel, 2022 to 2032

Figure 21: Global Market Attractiveness by Product Type, 2022 to 2032

Figure 22: Global Market Attractiveness by Animal Type, 2022 to 2032

Figure 23: Global Market Attractiveness by End User, 2022 to 2032

Figure 24: Global Market Attractiveness by Distribution Channel, 2022 to 2032

Figure 25: Global Market Attractiveness by Region, 2022 to 2032

Figure 26: North America Market Value (US$ million) by Product Type, 2022 to 2032

Figure 27: North America Market Value (US$ million) by Animal Type, 2022 to 2032

Figure 28: North America Market Value (US$ million) by End User, 2022 to 2032

Figure 29: North America Market Value (US$ million) by Distribution Channel, 2022 to 2032

Figure 30: North America Market Value (US$ million) by Country, 2022 to 2032

Figure 31: North America Market Value (US$ million) Analysis by Country, 2017 to 2032

Figure 32: North America Market Value Share (%) and BPS Analysis by Country, 2022 to 2032

Figure 33: North America Market Y-o-Y Growth (%) Projections by Country, 2022 to 2032

Figure 34: North America Market Value (US$ million) Analysis by Product Type, 2017 to 2032

Figure 35: North America Market Value Share (%) and BPS Analysis by Product Type, 2022 to 2032

Figure 36: North America Market Y-o-Y Growth (%) Projections by Product Type, 2022 to 2032

Figure 37: North America Market Value (US$ million) Analysis by Animal Type, 2017 to 2032

Figure 38: North America Market Value Share (%) and BPS Analysis by Animal Type, 2022 to 2032

Figure 39: North America Market Y-o-Y Growth (%) Projections by Animal Type, 2022 to 2032

Figure 40: North America Market Value (US$ million) Analysis by End User, 2017 to 2032

Figure 41: North America Market Value Share (%) and BPS Analysis by End User, 2022 to 2032

Figure 42: North America Market Y-o-Y Growth (%) Projections by End User, 2022 to 2032

Figure 43: North America Market Value (US$ million) Analysis by Distribution Channel, 2017 to 2032

Figure 44: North America Market Value Share (%) and BPS Analysis by Distribution Channel, 2022 to 2032

Figure 45: North America Market Y-o-Y Growth (%) Projections by Distribution Channel, 2022 to 2032

Figure 46: North America Market Attractiveness by Product Type, 2022 to 2032

Figure 47: North America Market Attractiveness by Animal Type, 2022 to 2032

Figure 48: North America Market Attractiveness by End User, 2022 to 2032

Figure 49: North America Market Attractiveness by Distribution Channel, 2022 to 2032

Figure 50: North America Market Attractiveness by Country, 2022 to 2032

Figure 51: Latin America Market Value (US$ million) by Product Type, 2022 to 2032

Figure 52: Latin America Market Value (US$ million) by Animal Type, 2022 to 2032

Figure 53: Latin America Market Value (US$ million) by End User, 2022 to 2032

Figure 54: Latin America Market Value (US$ million) by Distribution Channel, 2022 to 2032

Figure 55: Latin America Market Value (US$ million) by Country, 2022 to 2032

Figure 56: Latin America Market Value (US$ million) Analysis by Country, 2017 to 2032

Figure 57: Latin America Market Value Share (%) and BPS Analysis by Country, 2022 to 2032

Figure 58: Latin America Market Y-o-Y Growth (%) Projections by Country, 2022 to 2032

Figure 59: Latin America Market Value (US$ million) Analysis by Product Type, 2017 to 2032

Figure 60: Latin America Market Value Share (%) and BPS Analysis by Product Type, 2022 to 2032

Figure 61: Latin America Market Y-o-Y Growth (%) Projections by Product Type, 2022 to 2032

Figure 62: Latin America Market Value (US$ million) Analysis by Animal Type, 2017 to 2032

Figure 63: Latin America Market Value Share (%) and BPS Analysis by Animal Type, 2022 to 2032

Figure 64: Latin America Market Y-o-Y Growth (%) Projections by Animal Type, 2022 to 2032

Figure 65: Latin America Market Value (US$ million) Analysis by End User, 2017 to 2032

Figure 66: Latin America Market Value Share (%) and BPS Analysis by End User, 2022 to 2032

Figure 67: Latin America Market Y-o-Y Growth (%) Projections by End User, 2022 to 2032

Figure 68: Latin America Market Value (US$ million) Analysis by Distribution Channel, 2017 to 2032

Figure 69: Latin America Market Value Share (%) and BPS Analysis by Distribution Channel, 2022 to 2032

Figure 70: Latin America Market Y-o-Y Growth (%) Projections by Distribution Channel, 2022 to 2032

Figure 71: Latin America Market Attractiveness by Product Type, 2022 to 2032

Figure 72: Latin America Market Attractiveness by Animal Type, 2022 to 2032

Figure 73: Latin America Market Attractiveness by End User, 2022 to 2032

Figure 74: Latin America Market Attractiveness by Distribution Channel, 2022 to 2032

Figure 75: Latin America Market Attractiveness by Country, 2022 to 2032

Figure 76: Europe Market Value (US$ million) by Product Type, 2022 to 2032

Figure 77: Europe Market Value (US$ million) by Animal Type, 2022 to 2032

Figure 78: Europe Market Value (US$ million) by End User, 2022 to 2032

Figure 79: Europe Market Value (US$ million) by Distribution Channel, 2022 to 2032

Figure 80: Europe Market Value (US$ million) by Country, 2022 to 2032

Figure 81: Europe Market Value (US$ million) Analysis by Country, 2017 to 2032

Figure 82: Europe Market Value Share (%) and BPS Analysis by Country, 2022 to 2032

Figure 83: Europe Market Y-o-Y Growth (%) Projections by Country, 2022 to 2032

Figure 84: Europe Market Value (US$ million) Analysis by Product Type, 2017 to 2032

Figure 85: Europe Market Value Share (%) and BPS Analysis by Product Type, 2022 to 2032

Figure 86: Europe Market Y-o-Y Growth (%) Projections by Product Type, 2022 to 2032

Figure 87: Europe Market Value (US$ million) Analysis by Animal Type, 2017 to 2032

Figure 88: Europe Market Value Share (%) and BPS Analysis by Animal Type, 2022 to 2032

Figure 89: Europe Market Y-o-Y Growth (%) Projections by Animal Type, 2022 to 2032

Figure 90: Europe Market Value (US$ million) Analysis by End User, 2017 to 2032

Figure 91: Europe Market Value Share (%) and BPS Analysis by End User, 2022 to 2032

Figure 92: Europe Market Y-o-Y Growth (%) Projections by End User, 2022 to 2032

Figure 93: Europe Market Value (US$ million) Analysis by Distribution Channel, 2017 to 2032

Figure 94: Europe Market Value Share (%) and BPS Analysis by Distribution Channel, 2022 to 2032

Figure 95: Europe Market Y-o-Y Growth (%) Projections by Distribution Channel, 2022 to 2032

Figure 96: Europe Market Attractiveness by Product Type, 2022 to 2032

Figure 97: Europe Market Attractiveness by Animal Type, 2022 to 2032

Figure 98: Europe Market Attractiveness by End User, 2022 to 2032

Figure 99: Europe Market Attractiveness by Distribution Channel, 2022 to 2032

Figure 100: Europe Market Attractiveness by Country, 2022 to 2032

Figure 101: East Asia Market Value (US$ million) by Product Type, 2022 to 2032

Figure 102: East Asia Market Value (US$ million) by Animal Type, 2022 to 2032

Figure 103: East Asia Market Value (US$ million) by End User, 2022 to 2032

Figure 104: East Asia Market Value (US$ million) by Distribution Channel, 2022 to 2032

Figure 105: East Asia Market Value (US$ million) by Country, 2022 to 2032

Figure 106: East Asia Market Value (US$ million) Analysis by Country, 2017 to 2032

Figure 107: East Asia Market Value Share (%) and BPS Analysis by Country, 2022 to 2032

Figure 108: East Asia Market Y-o-Y Growth (%) Projections by Country, 2022 to 2032

Figure 109: East Asia Market Value (US$ million) Analysis by Product Type, 2017 to 2032

Figure 110: East Asia Market Value Share (%) and BPS Analysis by Product Type, 2022 to 2032

Figure 111: East Asia Market Y-o-Y Growth (%) Projections by Product Type, 2022 to 2032

Figure 112: East Asia Market Value (US$ million) Analysis by Animal Type, 2017 to 2032

Figure 113: East Asia Market Value Share (%) and BPS Analysis by Animal Type, 2022 to 2032

Figure 114: East Asia Market Y-o-Y Growth (%) Projections by Animal Type, 2022 to 2032

Figure 115: East Asia Market Value (US$ million) Analysis by End User, 2017 to 2032

Figure 116: East Asia Market Value Share (%) and BPS Analysis by End User, 2022 to 2032

Figure 117: East Asia Market Y-o-Y Growth (%) Projections by End User, 2022 to 2032

Figure 118: East Asia Market Value (US$ million) Analysis by Distribution Channel, 2017 to 2032

Figure 119: East Asia Market Value Share (%) and BPS Analysis by Distribution Channel, 2022 to 2032

Figure 120: East Asia Market Y-o-Y Growth (%) Projections by Distribution Channel, 2022 to 2032

Figure 121: East Asia Market Attractiveness by Product Type, 2022 to 2032

Figure 122: East Asia Market Attractiveness by Animal Type, 2022 to 2032

Figure 123: East Asia Market Attractiveness by End User, 2022 to 2032

Figure 124: East Asia Market Attractiveness by Distribution Channel, 2022 to 2032

Figure 125: East Asia Market Attractiveness by Country, 2022 to 2032

Figure 126: South Asia Market Value (US$ million) by Product Type, 2022 to 2032

Figure 127: South Asia Market Value (US$ million) by Animal Type, 2022 to 2032

Figure 128: South Asia Market Value (US$ million) by End User, 2022 to 2032

Figure 129: South Asia Market Value (US$ million) by Distribution Channel, 2022 to 2032

Figure 130: South Asia Market Value (US$ million) by Country, 2022 to 2032

Figure 131: South Asia Market Value (US$ million) Analysis by Country, 2017 to 2032

Figure 132: South Asia Market Value Share (%) and BPS Analysis by Country, 2022 to 2032

Figure 133: South Asia Market Y-o-Y Growth (%) Projections by Country, 2022 to 2032

Figure 134: South Asia Market Value (US$ million) Analysis by Product Type, 2017 to 2032

Figure 135: South Asia Market Value Share (%) and BPS Analysis by Product Type, 2022 to 2032

Figure 136: South Asia Market Y-o-Y Growth (%) Projections by Product Type, 2022 to 2032

Figure 137: South Asia Market Value (US$ million) Analysis by Animal Type, 2017 to 2032

Figure 138: South Asia Market Value Share (%) and BPS Analysis by Animal Type, 2022 to 2032

Figure 139: South Asia Market Y-o-Y Growth (%) Projections by Animal Type, 2022 to 2032

Figure 140: South Asia Market Value (US$ million) Analysis by End User, 2017 to 2032

Figure 141: South Asia Market Value Share (%) and BPS Analysis by End User, 2022 to 2032

Figure 142: South Asia Market Y-o-Y Growth (%) Projections by End User, 2022 to 2032

Figure 143: South Asia Market Value (US$ million) Analysis by Distribution Channel, 2017 to 2032

Figure 144: South Asia Market Value Share (%) and BPS Analysis by Distribution Channel, 2022 to 2032

Figure 145: South Asia Market Y-o-Y Growth (%) Projections by Distribution Channel, 2022 to 2032

Figure 146: South Asia Market Attractiveness by Product Type, 2022 to 2032

Figure 147: South Asia Market Attractiveness by Animal Type, 2022 to 2032

Figure 148: South Asia Market Attractiveness by End User, 2022 to 2032

Figure 149: South Asia Market Attractiveness by Distribution Channel, 2022 to 2032

Figure 150: South Asia Market Attractiveness by Country, 2022 to 2032

Figure 151: Oceania Market Value (US$ million) by Product Type, 2022 to 2032

Figure 152: Oceania Market Value (US$ million) by Animal Type, 2022 to 2032

Figure 153: Oceania Market Value (US$ million) by End User, 2022 to 2032

Figure 154: Oceania Market Value (US$ million) by Distribution Channel, 2022 to 2032

Figure 155: Oceania Market Value (US$ million) by Country, 2022 to 2032

Figure 156: Oceania Market Value (US$ million) Analysis by Country, 2017 to 2032

Figure 157: Oceania Market Value Share (%) and BPS Analysis by Country, 2022 to 2032

Figure 158: Oceania Market Y-o-Y Growth (%) Projections by Country, 2022 to 2032

Figure 159: Oceania Market Value (US$ million) Analysis by Product Type, 2017 to 2032

Figure 160: Oceania Market Value Share (%) and BPS Analysis by Product Type, 2022 to 2032

Figure 161: Oceania Market Y-o-Y Growth (%) Projections by Product Type, 2022 to 2032

Figure 162: Oceania Market Value (US$ million) Analysis by Animal Type, 2017 to 2032

Figure 163: Oceania Market Value Share (%) and BPS Analysis by Animal Type, 2022 to 2032

Figure 164: Oceania Market Y-o-Y Growth (%) Projections by Animal Type, 2022 to 2032

Figure 165: Oceania Market Value (US$ million) Analysis by End User, 2017 to 2032

Figure 166: Oceania Market Value Share (%) and BPS Analysis by End User, 2022 to 2032

Figure 167: Oceania Market Y-o-Y Growth (%) Projections by End User, 2022 to 2032

Figure 168: Oceania Market Value (US$ million) Analysis by Distribution Channel, 2017 to 2032

Figure 169: Oceania Market Value Share (%) and BPS Analysis by Distribution Channel, 2022 to 2032

Figure 170: Oceania Market Y-o-Y Growth (%) Projections by Distribution Channel, 2022 to 2032

Figure 171: Oceania Market Attractiveness by Product Type, 2022 to 2032

Figure 172: Oceania Market Attractiveness by Animal Type, 2022 to 2032

Figure 173: Oceania Market Attractiveness by End User, 2022 to 2032

Figure 174: Oceania Market Attractiveness by Distribution Channel, 2022 to 2032

Figure 175: Oceania Market Attractiveness by Country, 2022 to 2032

Figure 176: MEA Market Value (US$ million) by Product Type, 2022 to 2032

Figure 177: MEA Market Value (US$ million) by Animal Type, 2022 to 2032

Figure 178: MEA Market Value (US$ million) by End User, 2022 to 2032

Figure 179: MEA Market Value (US$ million) by Distribution Channel, 2022 to 2032

Figure 180: MEA Market Value (US$ million) by Country, 2022 to 2032

Figure 181: MEA Market Value (US$ million) Analysis by Country, 2017 to 2032

Figure 182: MEA Market Value Share (%) and BPS Analysis by Country, 2022 to 2032

Figure 183: MEA Market Y-o-Y Growth (%) Projections by Country, 2022 to 2032

Figure 184: MEA Market Value (US$ million) Analysis by Product Type, 2017 to 2032

Figure 185: MEA Market Value Share (%) and BPS Analysis by Product Type, 2022 to 2032

Figure 186: MEA Market Y-o-Y Growth (%) Projections by Product Type, 2022 to 2032

Figure 187: MEA Market Value (US$ million) Analysis by Animal Type, 2017 to 2032

Figure 188: MEA Market Value Share (%) and BPS Analysis by Animal Type, 2022 to 2032

Figure 189: MEA Market Y-o-Y Growth (%) Projections by Animal Type, 2022 to 2032

Figure 190: MEA Market Value (US$ million) Analysis by End User, 2017 to 2032

Figure 191: MEA Market Value Share (%) and BPS Analysis by End User, 2022 to 2032

Figure 192: MEA Market Y-o-Y Growth (%) Projections by End User, 2022 to 2032

Figure 193: MEA Market Value (US$ million) Analysis by Distribution Channel, 2017 to 2032

Figure 194: MEA Market Value Share (%) and BPS Analysis by Distribution Channel, 2022 to 2032

Figure 195: MEA Market Y-o-Y Growth (%) Projections by Distribution Channel, 2022 to 2032

Figure 196: MEA Market Attractiveness by Product Type, 2022 to 2032

Figure 197: MEA Market Attractiveness by Animal Type, 2022 to 2032

Figure 198: MEA Market Attractiveness by End User, 2022 to 2032

Figure 199: MEA Market Attractiveness by Distribution Channel, 2022 to 2032

Figure 200: MEA Market Attractiveness by Country, 2022 to 2032

Explore Healthcare Insights

View Reports