Animal Feed Minerals Market Size and Share Forecast Outlook 2025 to 2035

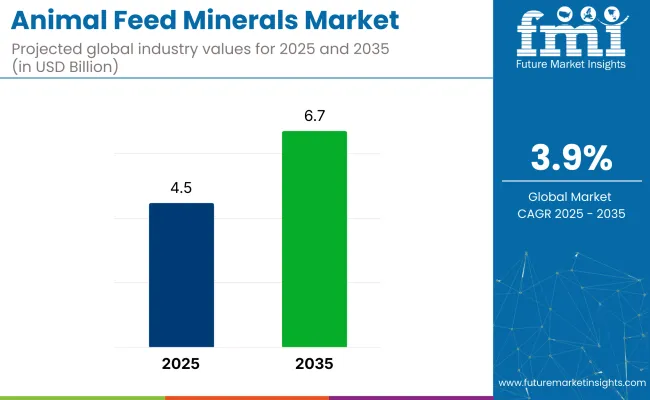
The global animal feed minerals market is valued at USD 4.5 billion in 2025 and is expected to reach USD 6.7 billion by 2035, reflecting a CAGR of 3.9%.

Quick Stats for Animal Feed Minerals Market

Market Value (2025): USD 4.5 billion
Forecast Value (2035): USD 6.7 billion
Forecast CAGR: 3.9%
Mineral Leader in 2025: Zinc Minerals (34.5% market share)
Top Form Segment: Dry Form (73.5% market share)
Key Growth Region: Asia Pacific (fastest-growing market in Japan with 8.1% CAGR)
Animal Feed Minerals Market

Metric Value
Estimated Size (2025E) USD 4.5 billion
Projected Value (2035F) USD 6.7 billion
CAGR (2025 to 2035) 3.9%

This growth is being driven by increasing demand for high-quality meat, dairy, and egg products, particularly in developing economies with rising disposable incomes and changing dietary preferences. The market is also benefiting from greater awareness among livestock producers regarding mineral deficiencies and their impact on animal health and productivity.

The USA is expected to maintain the largest market share, growing at a CAGR of 4.6%. Meanwhile, Japan and Germany are expected to register significant growth with CAGRs of 8.1% and 5.2% respectively. Zinc minerals are likely to remain the top segment,accounting for a market share of 34.5% in 2025, while dry form feed minerals are projected to continue dominating with 73.5% market share.

The animal feed minerals market accounts for approximately 6-8% of the overall animal feed market, reflecting its essential but smaller share relative to bulk feed ingredients like grains and proteins. Within the animal nutrition market, it holds an estimated 12-15% share, given its role as a core micronutrient segment supporting animal health and productivity.

In the livestock feed additives market, feed minerals constitute around 25-30%, as this category includes vitamins, amino acids, enzymes, and probiotics alongside minerals. Its share within the broader feed ingredients market remains under 5%, highlighting its specialized, value-added position in global livestock production systems.

Animal Feed Minerals Market Analysis by Top Investment Segments

The animal feed minerals market is segmented by mineral type, animal type, form, sales channel, and region. By mineral type, it is segmented into magnesium, calcium, phosphorus, iron, zinc, and others (copper, potassium, etc.). By animal, it includes poultry, swine, ruminants, aquaculture, equine, and other animals (pets, small animals).

By form,it is segmented into dry and liquid. By sales channel, it is segmented into direct sales, indirect sales, modern trade, animal feed stores, veterinary clinics, and online retailers.By region,it covers North America, Latin America, Western Europe, Eastern Europe, East Asia, South Asia,the Pacific, the Middle East and Africa.

By Mineral Type, Zinc Accounts for 34.5% of the Market Share

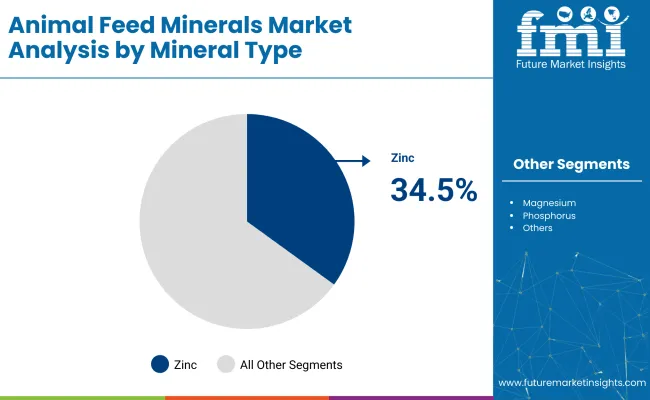
Zinc is expected to remain the most lucrative mineral type segment, accounting for a 34.5% share in 2025. Its dominance is attributed to its crucial role in enhancing immunity, reproduction, hoof integrity, and milk production in dairy and poultry animals. Magnesium and calcium are also gaining traction due to their benefits for bone development and muscular functions.
  • Supports reproductive health and immunity
  • Drives productivity in dairy and poultry segments
  • Rising inclusion in specialized feed formulations

Animal Feed Minerals Market By Mineral Type

By Animal, Poultry Animals Account for 35.5% of the Market Share

Among animal types, poultry is anticipated to lead consumption with a 35.5% market share in 2025. This dominance is driven by the sector’s rapid growth, short production cycles, and high demand for balanced mineral supplementation to support meat and egg productivity. Swine and ruminants follow closely due to their significant feed volume requirements and commercial farming expansion. Calcium and phosphorus are critical for milk production

  • Swine segment growing with commercial pork demand
  • Aquaculture adoption is increasing in the Asia Pacific
  • Ruminants require balanced minerals for productivity and health

By Form, Dry Feed Minerals Account for 73.5% of the Market Share

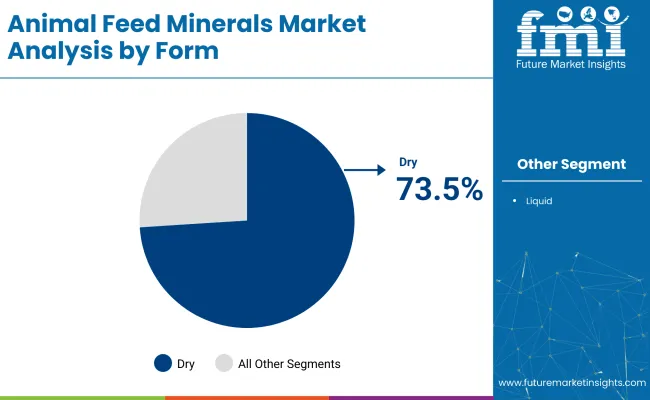
The dry form of feed minerals is set to dominate the market with a 73.5% share in 2025. This is due to ease of handling, longer shelf life, and cost-effectiveness compared to liquid forms. Dry powders are preferred by manufacturers and distributors for their stable formulation and reduced moisture content, which enhances storage efficiency. Liquid forms, although efficient for quick absorption, incur higher storage and transport costs.
  • Easy storage and transportation benefits
  • Longer shelf life compared to liquid feed minerals
  • Preferred for mass livestock feed formulations

Animal Feed Minerals Market By Form

By Sales Channel, Direct Sales Accounts for 45% of the Market Share

Direct sales are anticipated to remain the leading sales channel, accounting for an estimated 45% market share in 2025. This dominance is supported by large-scale procurement by integrated farms and cooperatives that prefer direct sourcing for bulk mineral feed purchases. Feed stores and online retailers are gaining momentum due to accessibility and diversified product ranges targeting small and medium-scale farmers.

  • Online retailers are growing with digital adoption
  • Veterinary clinics supporting specialized feed sales
  • Feed stores are essential for small-scale farmers’ access

Top Animal Feed Minerals Market Dynamics

Recent Trendsin Animal Feed Minerals Market

  • Rising adoption of organic and bioavailable trace minerals to enhance nutrient absorption in livestock.
  • Increasing incorporation of mineral chelates and nano-minerals for improved feed efficiency.
  • Growing focus on sustainable and eco-friendly mineral sourcing by major feed manufacturers.
  • Expansion of direct-to-farm distribution channels to ensure a timely supply of mineral-enriched feeds.

Challengesin the Animal Feed Minerals Market
  • Fluctuating raw material prices are impacting the cost-effectiveness of mineral feed formulations.
  • Limited awareness among small-scale farmers regarding balanced mineral supplementation.
  • Regulatory complexities associated with mineral additives and their residue limits in animal products.
  • Competition from alternative nutritional solutions such as fortified compound feeds and probiotics.

Analyzing Top Countries Formulating, Distributing, and Supplying Animal Feed Minerals

Country Wise Analysis Of Animal Feed Minerals Market

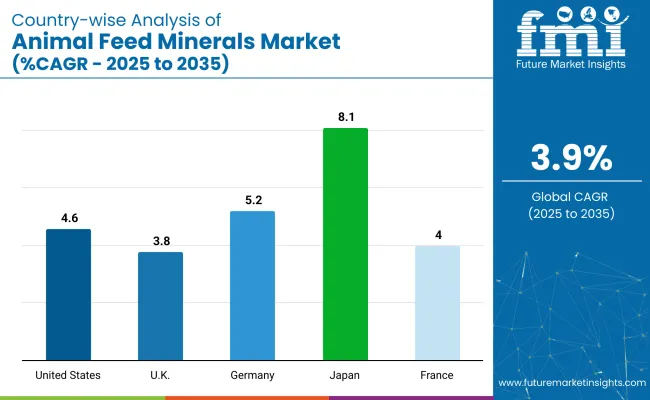
Among the top five countries, Japan is projected to record the fastest growth with a CAGR of 8.1% from 2025 to 2035, driven by rising meat and dairy consumption and advanced feed processing technologies. Germany follows with a CAGR of 5.2%, supported by innovation in mineral chelation and sustainability-focused formulations.

The USA market is expected to grow steadily at 4.6% CAGR, underpinned by stringent food safety regulations and high dairy demand. France is projected to expand at a CAGR of 4.0%, while the UK records the slowest growth at 3.8% CAGR, driven by structured livestock practices and eco-friendly feed solutions.

The report covers an in-depth analysis of 40+ countries; five top-performing OECD countries are highlighted below.

United States Feed Minerals Market Analysis

The animal feed minerals revenue in the USA is projected to grow at a CAGR of 4.6% from 2025 to 2035. Growth is being driven by rising demand for high-quality dairy, meat, and egg products, coupled with stringent regulations ensuring animal health and food safety.

The dominance of zinc and calcium minerals continues, with major manufacturers prioritizing innovation in chelated and organic mineral blends to meet nutritional standards and support the expanding livestock sector’s sustainability goals.

  • Rising focus on optimized feed formulations for dairy and poultry.
  • Stringent regulations supporting mineral feed safety and quality.
  • High penetration of direct sales and veterinary-recommended formulations.

Feed Minerals Demand Analysis in the UK

The sales of animal feed minerals in the UK arepredicted to rise at a CAGR of 3.8% from 2025 to 2035. Growth is being supported by increasing investments in sustainable livestock farming and the adoption of bioavailable mineral blends for ruminants and poultry. There is rising awareness regarding mineral deficiencies affecting animal productivity, which drives demand for balanced formulations.

  • Rising adoption of organic mineral feed additives.
  • Strong regulatory framework ensuring livestock welfare and safety.
  • The dairy sector remains the primary consumer of feed minerals.

Germany Feed Minerals Sales Analysis

The animal feed minerals industry in Germany is projected to expand at a CAGR of 5.2% from 2025 to 2035. Demand is being driven by a focus on enhancing feed efficiency and improving gut health in livestock, particularly dairy cattle and swine.

  • Strong emphasis on feed efficiency optimization.
  • Innovation in mineral chelates to improve absorption rates.
  • Rising sustainability-driven feed formulation practices.

Feed Minerals Demand Analysis in France

The revenue from animal feed minerals in France is anticipated to flourish at a CAGR of 4.0% from 2025 to 2035. Growth is supported by increasing consumer demand for premium-quality dairy and meat products, pushing farmers to adopt balanced mineral supplementation to enhance productivity.

  • Growing preference for bioavailable and organic minerals.
  • The dairy sector drives the majority of mineral feed consumption.
  • Compliance with stringent EU feed safety regulations.

Japan Feed Minerals Market Analysis

The animal feed minerals market in Japan is estimated to grow at a CAGR of 8.1% from 2025 to 2035. Market growth is driven by rising consumption of meat and dairy products, leading to increased mineral supplementation in feed formulations.

  • Rising demand for high-quality meat and dairy products.
  • Adoption of advanced mineral feed technologies.
  • Strong presence of specialized regional feed mineral suppliers.

Leading Animal Feed Minerals Suppliers

The market is moderately consolidated, with a few global leaders holding a significant share. Tier-one companies such as Cargill Inc., Royal DSM NV, Phibro Animal Health, Yara International, and Archer Daniels Midland Co. are competing based on product innovation, specialized mineral blends, and expanded distribution networks to strengthen their market presence globally.

These companies focus on developing bioavailable and chelated mineral formulations, investing in sustainable sourcing, and expanding their presence in emerging markets through strategic acquisitions and partnerships.

Company strategies revolve around pricing competitiveness, formulation innovations to enhance mineral absorption, and partnerships with regional feed manufacturers to tailor solutions for local livestock nutrition needs.

Recent Animal Feed Minerals Industry News

Phibro Animal Health completed the acquisition of Zoetis’ medicated feed additive (MFA) product portfolio and certain water-soluble products in October 2024, significantly expanding its product lineup and global reach.

In March 2024, Novus International acquired BioResource International Inc., a USA-based enzyme firm to bolster its innovation pipeline.

Animal Feed Minerals Market Report Scope

Report Attributes Details
Current Total Market Size (2025) USD 4.5 billion
Projected Market Size (2035) USD 6.7 billion
CAGR (2025 to 2035) 3.9%
Base Year for Estimation 2024
Historical Period 2020 to 2024
Projections Period 2025 to 2035
Market Analysis Parameters Revenue in USD billions/Volume in kilotons
By Mineral Type Magnesium, Calcium, Phosphorus, Iron, Zinc, Others (Copper, Potassium, etc.)
By Animal Poultry, Swine, Ruminants, Aquaculture, Equine, Others (pets, small animals)
By Form Dry, Liquid
By Sales Channel Direct Sales, Indirect Sales, Modern Trade, Animal Feed Stores, Veterinary Clinics, Online Retailers
Regions Covered North America, Latin America, Western Europe, Eastern Europe, East Asia, South Asia, Pacific, Middle East and Africa
Countries Covered United States, Canada, United Kingdom, Germany, France, China, Japan, South Korea, Brazil, Australia
Key Players Yara International (Bolifor ®), Phibro Animal Health, Zinpro Corp., Royal DSM NV, Pancosma SA, Nutrco NV, Novus International Inc., Mercer Milling Co. Inc., Cargill Inc., Tanke International Group, Biochem, Archer Daniels Midland Co., Alltech Inc., Kemin Industries Inc.
Additional Attributes Dollar sales by value, market share analysis by region, and country-wise analysis

Key Segments

By Mineral Type:

By Size, the segment has been categorized into Magnesium, Calcium, Phosphorus, Iron, Zinc, and Others (Copper, Potassium, etc.)

By Animal:

Different Animal types Dairy Animals (Goat, Buffalo, Cow, etc.), Poultry, and Swine, Aquaculture, Equine and Others (pets, small animals)

By Form:

Different Forms included Dry and Liquid

By Sales Channel:

Different sales channels which included Direct Sales, Indirect Sales, Modern Trade, Animal Feed Stores, Veterinary Clinics, and Online Retailers

By Region:

Industry analysis has been carried out in key countries of North America, Latin America, Europe, East Asia, South Asia, Oceania, and the Middle East & Africa

Table of Content

  1. Executive Summary
    • Global Market Outlook
    • Demand-side Trends
    • Supply-side Trends
    • Technology Roadmap Analysis
    • Analysis and Recommendations
  2. Market Overview
    • Market Coverage / Taxonomy
    • Market Definition / Scope / Limitations
  3. Market Background
    • Market Dynamics
      • Drivers
      • Restraints
      • Opportunity
      • Trends
    • Scenario Forecast
      • Demand in Optimistic Scenario
      • Demand in Likely Scenario
      • Demand in Conservative Scenario
    • Opportunity Map Analysis
    • Product Life Cycle Analysis
    • Supply Chain Analysis
      • Supply Side Participants and their Roles
        • Producers
        • Mid-Level Participants (Traders/ Agents/ Brokers)
        • Wholesalers and Distributors
      • Value Added and Value Created at Node in the Supply Chain
      • List of Raw Material Suppliers
      • List of Existing and Potential Buyer’s
    • Investment Feasibility Matrix
    • Value Chain Analysis
      • Profit Margin Analysis
      • Wholesalers and Distributors
      • Retailers
    • PESTLE and Porter’s Analysis
    • Regulatory Landscape
      • By Key Regions
      • By Key Countries
    • Regional Parent Market Outlook
    • Production and Consumption Statistics
    • Import and Export Statistics
  4. Global Market Analysis 2020 to 2024 and Forecast, 2025 to 2035
    • Historical Market Size Value (USD Billion) & Volume (kilotons) Analysis, 2020 to 2024
    • Current and Future Market Size Value (USD Billion) & Volume (kilotons) Projections, 2025 to 2035
      • Y-o-Y Growth Trend Analysis
      • Absolute $ Opportunity Analysis
  5. Global Market Pricing Analysis 2020 to 2024 and Forecast 2025 to 2035
  6. Global Market Analysis 2020 to 2024 and Forecast 2025 to 2035, By Mineral Type
    • Introduction / Key Findings
    • Historical Market Size Value (USD Billion) & Volume (kilotons) Analysis By Mineral Type, 2020 to 2024
    • Current and Future Market Size Value (USD Billion) & Volume (kilotons) Analysis and Forecast By Mineral Type, 2025 to 2035
      • Magnesium
      • Calcium
      • Phosphorus
      • Iron
      • Zinc
      • Others (Copper, Potassium, etc.)
    • Y-o-Y Growth Trend Analysis By Mineral Type, 2020 to 2024
    • Absolute $ Opportunity Analysis By Mineral Type, 2025 to 2035
  7. Global Market Analysis 2020 to 2024 and Forecast 2025 to 2035, By Animal
    • Introduction / Key Findings
    • Historical Market Size Value (USD Billion) & Volume (kilotons) Analysis By Animal, 2020 to 2024
    • Current and Future Market Size Value (USD Billion) & Volume (kilotons) Analysis and Forecast By Animal, 2025 to 2035
      • Poultry
      • Swine
      • Ruminants
      • Aquaculture
      • Equine
      • Others (pets, small animals)
    • Y-o-Y Growth Trend Analysis By Animal, 2020 to 2024
    • Absolute $ Opportunity Analysis By Animal, 2025 to 2035
  8. Global Market Analysis 2020 to 2024 and Forecast 2025 to 2035, By Form
    • Introduction / Key Findings
    • Historical Market Size Value (USD Billion) & Volume (kilotons) Analysis By Form, 2020 to 2024
    • Current and Future Market Size Value (USD Billion) & Volume (kilotons) Analysis and Forecast By Form, 2025 to 2035
      • Dry
      • Liquid
    • Y-o-Y Growth Trend Analysis By Form, 2020 to 2024
    • Absolute $ Opportunity Analysis By Form, 2025 to 2035
  9. Global Market Analysis 2020 to 2024 and Forecast 2025 to 2035, By Sales Channel
    • Introduction / Key Findings
    • Historical Market Size Value (USD Billion) & Volume (kilotons) Analysis By Sales Channel, 2020 to 2024
    • Current and Future Market Size Value (USD Billion) & Volume (kilotons) Analysis and Forecast By Sales Channel, 2025 to 2035
      • Direct Sales
      • Indirect Sales
      • Modern Trade
      • Animal Feed Stores
      • Veterinary Clinics
      • Online Retailers
    • Y-o-Y Growth Trend Analysis By Sales Channel, 2020 to 2024
    • Absolute $ Opportunity Analysis By Sales Channel, 2025 to 2035
  10. Global Market Analysis 2020 to 2024 and Forecast 2025 to 2035, By Region
    • Introduction
    • Historical Market Size Value (USD Billion) & Volume (kilotons) Analysis By Region, 2020 to 2024
    • Current Market Size Value (USD Billion) & Volume (kilotons) Analysis and Forecast By Region, 2025 to 2035
      • North America
      • Latin America
      • Western Europe
      • Eastern Europe
      • East Asia
      • South Asia & Pacific
      • Middle East and Africa
    • Market Attractiveness Analysis By Region
  11. North America Market Analysis 2020 to 2024 and Forecast 2025 to 2035, By Country
    • Historical Market Size Value (USD Billion) & Volume (kilotons) Trend Analysis By Market Taxonomy, 2020 to 2024
    • Market Size Value (USD Billion) & Volume (kilotons) Forecast By Market Taxonomy, 2025 to 2035
      • By Country
        • USA
        • Canada
        • Mexico
      • By Mineral Type
      • By Animal
      • By Form
      • By Sales Channel
    • Market Attractiveness Analysis
      • By Country
      • By Mineral Type
      • By Animal
      • By Form
      • By Sales Channel
    • Key Takeaways
  12. Latin America Market Analysis 2020 to 2024 and Forecast 2025 to 2035, By Country
    • Historical Market Size Value (USD Billion) & Volume (kilotons) Trend Analysis By Market Taxonomy, 2020 to 2024
    • Market Size Value (USD Billion) & Volume (kilotons) Forecast By Market Taxonomy, 2025 to 2035
      • By Country
        • Brazil
        • Argentina
        • Rest of LATAM
      • By Mineral Type
      • By Animal
      • By Form
      • By Sales Channel
    • Market Attractiveness Analysis
      • By Country
      • By Mineral Type
      • By Animal
      • By Form
      • By Sales Channel
    • Key Takeaways
  13. Western Europe Market Analysis 2020 to 2024 and Forecast 2025 to 2035, By Country
    • Historical Market Size Value (USD Billion) & Volume (kilotons) Trend Analysis By Market Taxonomy, 2020 to 2024
    • Market Size Value (USD Billion) & Volume (kilotons) Forecast By Market Taxonomy, 2025 to 2035
      • By Country
        • Germany
        • Italy
        • France
        • UK
        • Spain
        • BENELUX
        • Nordic
        • Rest of W.Europe
      • By Mineral Type
      • By Animal
      • By Form
      • By Sales Channel
    • Market Attractiveness Analysis
      • By Country
      • By Mineral Type
      • By Animal
      • By Form
      • By Sales Channel
    • Key Takeaways
  14. Eastern Europe Market Analysis 2020 to 2024 and Forecast 2025 to 2035, By Country
    • Historical Market Size Value (USD Billion) & Volume (kilotons) Trend Analysis By Market Taxonomy, 2020 to 2024
    • Market Size Value (USD Billion) & Volume (kilotons) Forecast By Market Taxonomy, 2025 to 2035
      • By Country
        • Russia
        • Hungary
        • Poland
        • Balkan & Baltics
        • Rest of E. Europe
      • By Mineral Type
      • By Animal
      • By Form
      • By Sales Channel
    • Market Attractiveness Analysis
      • By Country
      • By Mineral Type
      • By Animal
      • By Form
      • By Sales Channel
    • Key Takeaways
  15. East Asia Market Analysis 2020 to 2024 and Forecast 2025 to 2035, By Country
    • Historical Market Size Value (USD Billion) & Volume (kilotons) Trend Analysis By Market Taxonomy, 2020 to 2024
    • Market Size Value (USD Billion) & Volume (kilotons) Forecast By Market Taxonomy, 2025 to 2035
      • By Country
        • China
        • Japan
        • South Korea
      • By Mineral Type
      • By Animal
      • By Form
      • By Sales Channel
    • Market Attractiveness Analysis
      • By Country
      • By Mineral Type
      • By Animal
      • By Form
      • By Sales Channel
    • Key Takeaways
  16. South Asia & Pacific Market Analysis 2020 to 2024 and Forecast 2025 to 2035, By Country
    • Historical Market Size Value (USD Billion) & Volume (kilotons) Trend Analysis By Market Taxonomy, 2020 to 2024
    • Market Size Value (USD Billion) & Volume (kilotons) Forecast By Market Taxonomy, 2025 to 2035
      • By Country
        • India
        • Australia & New Zealand
        • ASEAN
        • Rest of SAP
      • By Mineral Type
      • By Animal
      • By Form
      • By Sales Channel
    • Market Attractiveness Analysis
      • By Country
      • By Mineral Type
      • By Animal
      • By Form
      • By Sales Channel
    • Key Takeaways
  17. Middle East and Africa Market Analysis 2020 to 2024 and Forecast 2025 to 2035, By Country
    • Historical Market Size Value (USD Billion) & Volume (kilotons) Trend Analysis By Market Taxonomy, 2020 to 2024
    • Market Size Value (USD Billion) & Volume (kilotons) Forecast By Market Taxonomy, 2025 to 2035
      • By Country
        • GCC Countries
        • Northern Africa
        • South Africa
        • Turkiye
        • Rest of MEA
      • By Mineral Type
      • By Animal
      • By Form
      • By Sales Channel
    • Market Attractiveness Analysis
      • By Country
      • By Mineral Type
      • By Animal
      • By Form
      • By Sales Channel
    • Key Takeaways
  18. Key Countries Market Analysis
    • USA
      • Pricing Analysis
      • Market Share Analysis, 2024
        • By Mineral Type
        • By Animal
        • By Form
        • By Sales Channel
    • Canada
      • Pricing Analysis
      • Market Share Analysis, 2024
        • By Mineral Type
        • By Animal
        • By Form
        • By Sales Channel
    • Brazil
      • Pricing Analysis
      • Market Share Analysis, 2024
        • By Mineral Type
        • By Animal
        • By Form
        • By Sales Channel
    • Mexico
      • Pricing Analysis
      • Market Share Analysis, 2024
        • By Mineral Type
        • By Animal
        • By Form
        • By Sales Channel
    • Argentina
      • Pricing Analysis
      • Market Share Analysis, 2024
        • By Mineral Type
        • By Animal
        • By Form
        • By Sales Channel
  19. Market Structure Analysis
    • Competition Dashboard
    • Competition Benchmarking
    • Market Share Analysis of Top Players
      • By Regional
      • By Mineral Type
      • By Animal
      • By Form
      • By Sales Channel
  20. Competition Analysis
    • Competition Deep Dive
      • Yara International (Bolifor®)
        • Overview
        • Product Portfolio
        • Profitability by Market Segments (Product/Age /Sales Channel/Region)
        • Sales Footprint
        • Strategy Overview
          • Marketing Strategy
          • Product Strategy
          • Channel Strategy
      • Phibro Animal Health
        • Overview
        • Product Portfolio
        • Profitability by Market Segments (Product/Age /Sales Channel/Region)
        • Sales Footprint
        • Strategy Overview
          • Marketing Strategy
          • Product Strategy
          • Channel Strategy
      • Zinpro Corp.
        • Overview
        • Product Portfolio
        • Profitability by Market Segments (Product/Age /Sales Channel/Region)
        • Sales Footprint
        • Strategy Overview
          • Marketing Strategy
          • Product Strategy
          • Channel Strategy
      • Royal DSM NV
        • Overview
        • Product Portfolio
        • Profitability by Market Segments (Product/Age /Sales Channel/Region)
        • Sales Footprint
        • Strategy Overview
          • Marketing Strategy
          • Product Strategy
          • Channel Strategy
      • Pancosma SA
        • Overview
        • Product Portfolio
        • Profitability by Market Segments (Product/Age /Sales Channel/Region)
        • Sales Footprint
        • Strategy Overview
          • Marketing Strategy
          • Product Strategy
          • Channel Strategy
      • Nutrco NV
        • Overview
        • Product Portfolio
        • Profitability by Market Segments (Product/Age /Sales Channel/Region)
        • Sales Footprint
        • Strategy Overview
          • Marketing Strategy
          • Product Strategy
          • Channel Strategy
      • Novus International Inc.
        • Overview
        • Product Portfolio
        • Profitability by Market Segments (Product/Age /Sales Channel/Region)
        • Sales Footprint
        • Strategy Overview
          • Marketing Strategy
          • Product Strategy
          • Channel Strategy
      • Mercer Milling Co. Inc.
        • Overview
        • Product Portfolio
        • Profitability by Market Segments (Product/Age /Sales Channel/Region)
        • Sales Footprint
        • Strategy Overview
          • Marketing Strategy
          • Product Strategy
          • Channel Strategy
      • Cargill Inc.
        • Overview
        • Product Portfolio
        • Profitability by Market Segments (Product/Age /Sales Channel/Region)
        • Sales Footprint
        • Strategy Overview
          • Marketing Strategy
          • Product Strategy
          • Channel Strategy
      • Tanke International Group
        • Overview
        • Product Portfolio
        • Profitability by Market Segments (Product/Age /Sales Channel/Region)
        • Sales Footprint
        • Strategy Overview
          • Marketing Strategy
          • Product Strategy
          • Channel Strategy
      • Biochem
        • Overview
        • Product Portfolio
        • Profitability by Market Segments (Product/Age /Sales Channel/Region)
        • Sales Footprint
        • Strategy Overview
          • Marketing Strategy
          • Product Strategy
          • Channel Strategy
      • Archer Daniels Midland Co.
        • Overview
        • Product Portfolio
        • Profitability by Market Segments (Product/Age /Sales Channel/Region)
        • Sales Footprint
        • Strategy Overview
          • Marketing Strategy
          • Product Strategy
          • Channel Strategy
      • Alltech Inc.
        • Overview
        • Product Portfolio
        • Profitability by Market Segments (Product/Age /Sales Channel/Region)
        • Sales Footprint
        • Strategy Overview
          • Marketing Strategy
          • Product Strategy
          • Channel Strategy
      • Kemin Industries Inc.
        • Overview
        • Product Portfolio
        • Profitability by Market Segments (Product/Age /Sales Channel/Region)
        • Sales Footprint
        • Strategy Overview
          • Marketing Strategy
          • Product Strategy
          • Channel Strategy
  21. Assumptions & Acronyms Used
  22. Research Methodology

List of Tables

  • Table 1: Global Market Value (USD Billion) Forecast by Region, 2020-2035
  • Table 2: Global Market Volume (kilotons) Forecast by Region, 2020-2035
  • Table 3: Global Market Value (USD Billion) Forecast by Mineral Type, 2020-2035
  • Table 4: Global Market Volume (kilotons) Forecast by Mineral Type, 2020-2035
  • Table 5: Global Market Value (USD Billion) Forecast by Animal, 2020-2035
  • Table 6: Global Market Volume (kilotons) Forecast by Animal, 2020-2035
  • Table 7: Global Market Value (USD Billion) Forecast by Form, 2020-2035
  • Table 8: Global Market Volume (kilotons) Forecast by Form, 2020-2035
  • Table 9: Global Market Value (USD Billion) Forecast by Sales Channel, 2020-2035
  • Table 10: Global Market Volume (kilotons) Forecast by Sales Channel, 2020-2035
  • Table 11: North America Market Value (USD Billion) Forecast by Country, 2020-2035
  • Table 12: North America Market Volume (kilotons) Forecast by Country, 2020-2035
  • Table 13: North America Market Value (USD Billion) Forecast by Mineral Type, 2020-2035
  • Table 14: North America Market Volume (kilotons) Forecast by Mineral Type, 2020-2035
  • Table 15: North America Market Value (USD Billion) Forecast by Animal, 2020-2035
  • Table 16: North America Market Volume (kilotons) Forecast by Animal, 2020-2035
  • Table 17: North America Market Value (USD Billion) Forecast by Form, 2020-2035
  • Table 18: North America Market Volume (kilotons) Forecast by Form, 2020-2035
  • Table 19: North America Market Value (USD Billion) Forecast by Sales Channel, 2020-2035
  • Table 20: North America Market Volume (kilotons) Forecast by Sales Channel, 2020-2035
  • Table 21: Latin America Market Value (USD Billion) Forecast by Country, 2020-2035
  • Table 22: Latin America Market Volume (kilotons) Forecast by Country, 2020-2035
  • Table 23: Latin America Market Value (USD Billion) Forecast by Mineral Type, 2020-2035
  • Table 24: Latin America Market Volume (kilotons) Forecast by Mineral Type, 2020-2035
  • Table 25: Latin America Market Value (USD Billion) Forecast by Animal, 2020-2035
  • Table 26: Latin America Market Volume (kilotons) Forecast by Animal, 2020-2035
  • Table 27: Latin America Market Value (USD Billion) Forecast by Form, 2020-2035
  • Table 28: Latin America Market Volume (kilotons) Forecast by Form, 2020-2035
  • Table 29: Latin America Market Value (USD Billion) Forecast by Sales Channel, 2020-2035
  • Table 30: Latin America Market Volume (kilotons) Forecast by Sales Channel, 2020-2035
  • Table 31: Western Europe Market Value (USD Billion) Forecast by Country, 2020-2035
  • Table 32: Western Europe Market Volume (kilotons) Forecast by Country, 2020-2035
  • Table 33: Western Europe Market Value (USD Billion) Forecast by Mineral Type, 2020-2035
  • Table 34: Western Europe Market Volume (kilotons) Forecast by Mineral Type, 2020-2035
  • Table 35: Western Europe Market Value (USD Billion) Forecast by Animal, 2020-2035
  • Table 36: Western Europe Market Volume (kilotons) Forecast by Animal, 2020-2035
  • Table 37: Western Europe Market Value (USD Billion) Forecast by Form, 2020-2035
  • Table 38: Western Europe Market Volume (kilotons) Forecast by Form, 2020-2035
  • Table 39: Western Europe Market Value (USD Billion) Forecast by Sales Channel, 2020-2035
  • Table 40: Western Europe Market Volume (kilotons) Forecast by Sales Channel, 2020-2035
  • Table 41: Eastern Europe Market Value (USD Billion) Forecast by Country, 2020-2035
  • Table 42: Eastern Europe Market Volume (kilotons) Forecast by Country, 2020-2035
  • Table 43: Eastern Europe Market Value (USD Billion) Forecast by Mineral Type, 2020-2035
  • Table 44: Eastern Europe Market Volume (kilotons) Forecast by Mineral Type, 2020-2035
  • Table 45: Eastern Europe Market Value (USD Billion) Forecast by Animal, 2020-2035
  • Table 46: Eastern Europe Market Volume (kilotons) Forecast by Animal, 2020-2035
  • Table 47: Eastern Europe Market Value (USD Billion) Forecast by Form, 2020-2035
  • Table 48: Eastern Europe Market Volume (kilotons) Forecast by Form, 2020-2035
  • Table 49: Eastern Europe Market Value (USD Billion) Forecast by Sales Channel, 2020-2035
  • Table 50: Eastern Europe Market Volume (kilotons) Forecast by Sales Channel, 2020-2035
  • Table 51: East Asia Market Value (USD Billion) Forecast by Country, 2020-2035
  • Table 52: East Asia Market Volume (kilotons) Forecast by Country, 2020-2035
  • Table 53: East Asia Market Value (USD Billion) Forecast by Mineral Type, 2020-2035
  • Table 54: East Asia Market Volume (kilotons) Forecast by Mineral Type, 2020-2035
  • Table 55: East Asia Market Value (USD Billion) Forecast by Animal, 2020-2035
  • Table 56: East Asia Market Volume (kilotons) Forecast by Animal, 2020-2035
  • Table 57: East Asia Market Value (USD Billion) Forecast by Form, 2020-2035
  • Table 58: East Asia Market Volume (kilotons) Forecast by Form, 2020-2035
  • Table 59: East Asia Market Value (USD Billion) Forecast by Sales Channel, 2020-2035
  • Table 60: East Asia Market Volume (kilotons) Forecast by Sales Channel, 2020-2035
  • Table 61: South Asia & Pacific Market Value (USD Billion) Forecast by Country, 2020-2035
  • Table 62: South Asia & Pacific Market Volume (kilotons) Forecast by Country, 2020-2035
  • Table 63: South Asia & Pacific Market Value (USD Billion) Forecast by Mineral Type, 2020-2035
  • Table 64: South Asia & Pacific Market Volume (kilotons) Forecast by Mineral Type, 2020-2035
  • Table 65: South Asia & Pacific Market Value (USD Billion) Forecast by Animal, 2020-2035
  • Table 66: South Asia & Pacific Market Volume (kilotons) Forecast by Animal, 2020-2035
  • Table 67: South Asia & Pacific Market Value (USD Billion) Forecast by Form, 2020-2035
  • Table 68: South Asia & Pacific Market Volume (kilotons) Forecast by Form, 2020-2035
  • Table 69: South Asia & Pacific Market Value (USD Billion) Forecast by Sales Channel, 2020-2035
  • Table 70: South Asia & Pacific Market Volume (kilotons) Forecast by Sales Channel, 2020-2035
  • Table 71: Middle East and Africa Market Value (USD Billion) Forecast by Country, 2020-2035
  • Table 72: Middle East and Africa Market Volume (kilotons) Forecast by Country, 2020-2035
  • Table 73: Middle East and Africa Market Value (USD Billion) Forecast by Mineral Type, 2020-2035
  • Table 74: Middle East and Africa Market Volume (kilotons) Forecast by Mineral Type, 2020-2035
  • Table 75: Middle East and Africa Market Value (USD Billion) Forecast by Animal, 2020-2035
  • Table 76: Middle East and Africa Market Volume (kilotons) Forecast by Animal, 2020-2035
  • Table 77: Middle East and Africa Market Value (USD Billion) Forecast by Form, 2020-2035
  • Table 78: Middle East and Africa Market Volume (kilotons) Forecast by Form, 2020-2035
  • Table 79: Middle East and Africa Market Value (USD Billion) Forecast by Sales Channel, 2020-2035
  • Table 80: Middle East and Africa Market Volume (kilotons) Forecast by Sales Channel, 2020-2035

List of Figures

  • Figure 1: Global Market Volume (kilotons) Forecast 2020-2035
  • Figure 2: Global Market Pricing Analysis
  • Figure 3: Global Market Value (USD Billion) Forecast 2020-2035
  • Figure 4: Global Market Value Share and BPS Analysis by Mineral Type, 2025 and 2035
  • Figure 5: Global Market Y-o-Y Growth Comparison by Mineral Type, 2025-2035
  • Figure 6: Global Market Attractiveness Analysis by Mineral Type
  • Figure 7: Global Market Value Share and BPS Analysis by Animal, 2025 and 2035
  • Figure 8: Global Market Y-o-Y Growth Comparison by Animal, 2025-2035
  • Figure 9: Global Market Attractiveness Analysis by Animal
  • Figure 10: Global Market Value Share and BPS Analysis by Form, 2025 and 2035
  • Figure 11: Global Market Y-o-Y Growth Comparison by Form, 2025-2035
  • Figure 12: Global Market Attractiveness Analysis by Form
  • Figure 13: Global Market Value Share and BPS Analysis by Sales Channel, 2025 and 2035
  • Figure 14: Global Market Y-o-Y Growth Comparison by Sales Channel, 2025-2035
  • Figure 15: Global Market Attractiveness Analysis by Sales Channel
  • Figure 16: Global Market Value (USD Billion) Share and BPS Analysis by Region, 2025 and 2035
  • Figure 17: Global Market Y-o-Y Growth Comparison by Region, 2025-2035
  • Figure 18: Global Market Attractiveness Analysis by Region
  • Figure 19: North America Market Incremental $ Opportunity, 2025-2035
  • Figure 20: Latin America Market Incremental $ Opportunity, 2025-2035
  • Figure 21: Western Europe Market Incremental $ Opportunity, 2025-2035
  • Figure 22: Eastern Europe Market Incremental $ Opportunity, 2025-2035
  • Figure 23: East Asia Market Incremental $ Opportunity, 2025-2035
  • Figure 24: South Asia & Pacific Market Incremental $ Opportunity, 2025-2035
  • Figure 25: Middle East and Africa Market Incremental $ Opportunity, 2025-2035
  • Figure 26: North America Market Value Share and BPS Analysis by Country, 2025 and 2035
  • Figure 27: North America Market Value Share and BPS Analysis by Mineral Type, 2025 and 2035
  • Figure 28: North America Market Y-o-Y Growth Comparison by Mineral Type, 2025-2035
  • Figure 29: North America Market Attractiveness Analysis by Mineral Type
  • Figure 30: North America Market Value Share and BPS Analysis by Animal, 2025 and 2035
  • Figure 31: North America Market Y-o-Y Growth Comparison by Animal, 2025-2035
  • Figure 32: North America Market Attractiveness Analysis by Animal
  • Figure 33: North America Market Value Share and BPS Analysis by Form, 2025 and 2035
  • Figure 34: North America Market Y-o-Y Growth Comparison by Form, 2025-2035
  • Figure 35: North America Market Attractiveness Analysis by Form
  • Figure 36: North America Market Value Share and BPS Analysis by Sales Channel, 2025 and 2035
  • Figure 37: North America Market Y-o-Y Growth Comparison by Sales Channel, 2025-2035
  • Figure 38: North America Market Attractiveness Analysis by Sales Channel
  • Figure 39: Latin America Market Value Share and BPS Analysis by Country, 2025 and 2035
  • Figure 40: Latin America Market Value Share and BPS Analysis by Mineral Type, 2025 and 2035
  • Figure 41: Latin America Market Y-o-Y Growth Comparison by Mineral Type, 2025-2035
  • Figure 42: Latin America Market Attractiveness Analysis by Mineral Type
  • Figure 43: Latin America Market Value Share and BPS Analysis by Animal, 2025 and 2035
  • Figure 44: Latin America Market Y-o-Y Growth Comparison by Animal, 2025-2035
  • Figure 45: Latin America Market Attractiveness Analysis by Animal
  • Figure 46: Latin America Market Value Share and BPS Analysis by Form, 2025 and 2035
  • Figure 47: Latin America Market Y-o-Y Growth Comparison by Form, 2025-2035
  • Figure 48: Latin America Market Attractiveness Analysis by Form
  • Figure 49: Latin America Market Value Share and BPS Analysis by Sales Channel, 2025 and 2035
  • Figure 50: Latin America Market Y-o-Y Growth Comparison by Sales Channel, 2025-2035
  • Figure 51: Latin America Market Attractiveness Analysis by Sales Channel
  • Figure 52: Western Europe Market Value Share and BPS Analysis by Country, 2025 and 2035
  • Figure 53: Western Europe Market Value Share and BPS Analysis by Mineral Type, 2025 and 2035
  • Figure 54: Western Europe Market Y-o-Y Growth Comparison by Mineral Type, 2025-2035
  • Figure 55: Western Europe Market Attractiveness Analysis by Mineral Type
  • Figure 56: Western Europe Market Value Share and BPS Analysis by Animal, 2025 and 2035
  • Figure 57: Western Europe Market Y-o-Y Growth Comparison by Animal, 2025-2035
  • Figure 58: Western Europe Market Attractiveness Analysis by Animal
  • Figure 59: Western Europe Market Value Share and BPS Analysis by Form, 2025 and 2035
  • Figure 60: Western Europe Market Y-o-Y Growth Comparison by Form, 2025-2035
  • Figure 61: Western Europe Market Attractiveness Analysis by Form
  • Figure 62: Western Europe Market Value Share and BPS Analysis by Sales Channel, 2025 and 2035
  • Figure 63: Western Europe Market Y-o-Y Growth Comparison by Sales Channel, 2025-2035
  • Figure 64: Western Europe Market Attractiveness Analysis by Sales Channel
  • Figure 65: Eastern Europe Market Value Share and BPS Analysis by Country, 2025 and 2035
  • Figure 66: Eastern Europe Market Value Share and BPS Analysis by Mineral Type, 2025 and 2035
  • Figure 67: Eastern Europe Market Y-o-Y Growth Comparison by Mineral Type, 2025-2035
  • Figure 68: Eastern Europe Market Attractiveness Analysis by Mineral Type
  • Figure 69: Eastern Europe Market Value Share and BPS Analysis by Animal, 2025 and 2035
  • Figure 70: Eastern Europe Market Y-o-Y Growth Comparison by Animal, 2025-2035
  • Figure 71: Eastern Europe Market Attractiveness Analysis by Animal
  • Figure 72: Eastern Europe Market Value Share and BPS Analysis by Form, 2025 and 2035
  • Figure 73: Eastern Europe Market Y-o-Y Growth Comparison by Form, 2025-2035
  • Figure 74: Eastern Europe Market Attractiveness Analysis by Form
  • Figure 75: Eastern Europe Market Value Share and BPS Analysis by Sales Channel, 2025 and 2035
  • Figure 76: Eastern Europe Market Y-o-Y Growth Comparison by Sales Channel, 2025-2035
  • Figure 77: Eastern Europe Market Attractiveness Analysis by Sales Channel
  • Figure 78: East Asia Market Value Share and BPS Analysis by Country, 2025 and 2035
  • Figure 79: East Asia Market Value Share and BPS Analysis by Mineral Type, 2025 and 2035
  • Figure 80: East Asia Market Y-o-Y Growth Comparison by Mineral Type, 2025-2035
  • Figure 81: East Asia Market Attractiveness Analysis by Mineral Type
  • Figure 82: East Asia Market Value Share and BPS Analysis by Animal, 2025 and 2035
  • Figure 83: East Asia Market Y-o-Y Growth Comparison by Animal, 2025-2035
  • Figure 84: East Asia Market Attractiveness Analysis by Animal
  • Figure 85: East Asia Market Value Share and BPS Analysis by Form, 2025 and 2035
  • Figure 86: East Asia Market Y-o-Y Growth Comparison by Form, 2025-2035
  • Figure 87: East Asia Market Attractiveness Analysis by Form
  • Figure 88: East Asia Market Value Share and BPS Analysis by Sales Channel, 2025 and 2035
  • Figure 89: East Asia Market Y-o-Y Growth Comparison by Sales Channel, 2025-2035
  • Figure 90: East Asia Market Attractiveness Analysis by Sales Channel
  • Figure 91: South Asia & Pacific Market Value Share and BPS Analysis by Country, 2025 and 2035
  • Figure 92: South Asia & Pacific Market Value Share and BPS Analysis by Mineral Type, 2025 and 2035
  • Figure 93: South Asia & Pacific Market Y-o-Y Growth Comparison by Mineral Type, 2025-2035
  • Figure 94: South Asia & Pacific Market Attractiveness Analysis by Mineral Type
  • Figure 95: South Asia & Pacific Market Value Share and BPS Analysis by Animal, 2025 and 2035
  • Figure 96: South Asia & Pacific Market Y-o-Y Growth Comparison by Animal, 2025-2035
  • Figure 97: South Asia & Pacific Market Attractiveness Analysis by Animal
  • Figure 98: South Asia & Pacific Market Value Share and BPS Analysis by Form, 2025 and 2035
  • Figure 99: South Asia & Pacific Market Y-o-Y Growth Comparison by Form, 2025-2035
  • Figure 100: South Asia & Pacific Market Attractiveness Analysis by Form
  • Figure 101: South Asia & Pacific Market Value Share and BPS Analysis by Sales Channel, 2025 and 2035
  • Figure 102: South Asia & Pacific Market Y-o-Y Growth Comparison by Sales Channel, 2025-2035
  • Figure 103: South Asia & Pacific Market Attractiveness Analysis by Sales Channel
  • Figure 104: Middle East and Africa Market Value Share and BPS Analysis by Country, 2025 and 2035
  • Figure 105: Middle East and Africa Market Value Share and BPS Analysis by Mineral Type, 2025 and 2035
  • Figure 106: Middle East and Africa Market Y-o-Y Growth Comparison by Mineral Type, 2025-2035
  • Figure 107: Middle East and Africa Market Attractiveness Analysis by Mineral Type
  • Figure 108: Middle East and Africa Market Value Share and BPS Analysis by Animal, 2025 and 2035
  • Figure 109: Middle East and Africa Market Y-o-Y Growth Comparison by Animal, 2025-2035
  • Figure 110: Middle East and Africa Market Attractiveness Analysis by Animal
  • Figure 111: Middle East and Africa Market Value Share and BPS Analysis by Form, 2025 and 2035
  • Figure 112: Middle East and Africa Market Y-o-Y Growth Comparison by Form, 2025-2035
  • Figure 113: Middle East and Africa Market Attractiveness Analysis by Form
  • Figure 114: Middle East and Africa Market Value Share and BPS Analysis by Sales Channel, 2025 and 2035
  • Figure 115: Middle East and Africa Market Y-o-Y Growth Comparison by Sales Channel, 2025-2035
  • Figure 116: Middle East and Africa Market Attractiveness Analysis by Sales Channel
  • Figure 117: Global Market - Tier Structure Analysis
  • Figure 118: Global Market - Company Share Analysis

Frequently Asked Questions

What is the projected size of the animal feed minerals market in 2025?

The market is valued at USD 4.5 billion in 2025.

What is the outlook on animal feed minerals demand by 2035?

The market is forecasted to reach USD 6.7 billion by 2035, reflecting a CAGR of 3.9%.

Which mineral type leads the animal feed minerals market in 2025?

Zinc minerals are expected to lead the market with a 34.5% share in 2025.

What is the projected share of dairy animals in the animal type segment by 2025?

Poultry animals are expected to hold a 35.5% share of the market in 2025.

Which country is projected to have the fastest-growing animal feed minerals market?

Japan is anticipated to be the fastest-growing market with a CAGR of 8.1% from 2025 to 2035.

Explore Similar Insights

Future Market Insights

Animal Feed Minerals Market