USA Animal Model Market Outlook (2023 to 2033)

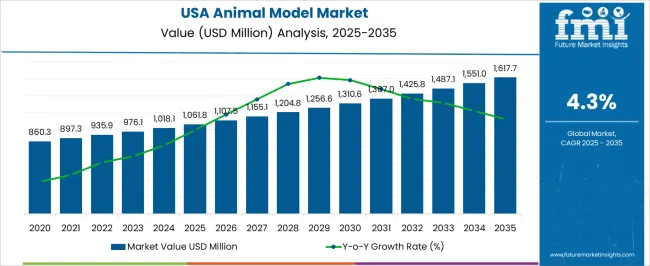
The USA animal model market valuation reached around US$ 947.3 million back in 2022. The demand in the USA animal model is set to increase at a 4.3% CAGR from 2023 to 2033. The demand for animal models in the United States, in terms of value, is anticipated to reach US$ 1,487.9 million by 2033. According to a study by Future Market Insights, mice held a substantial share of over 61.03% in 2022 within the USA market.

Data Points Market Insights
USA Animal Model Market Value (2022) US$ 947.3 million
USA Animal Model Market Estimated Value (2023) US$ 976.1 million
USA Animal Model Market Projected Value (2033) US$ 1,487.9 million
USA Animal Model Market Value-based CAGR (2022 to 2032) 4.3%

The animal model plays a valuable role in clinical research for the development of new drugs and treatments. Almost 90% of the processes for the development of drugs are depended on the testing of animal models.

Noticeable similarities, such as anatomical and physiological similarities, in humans and animals make animal models essential for biological research and drug development. Furthermore, the growing need for novel drugs and customized medicines might boost the demand for animal

The rising trend of genetically modified animal models, such as genetically engineered mice for the study of genetic diseases, multifactorial and polygenic (complex) disorders, neurodegenerative diseases, and inflammatory diseases, is boosting the growth in the market. In 2021, the USA animal model held nearly 60% of the global animal model market worth US$ 1.5 billion.

Don't pay for what you don't need

Customize your report by selecting specific countries or regions and save 30%!

Sales Analysis of USA Animal Model from 2017 to 2022 vs. Market Outlook for 2023 to 2033

Demand in the USA animal model market increased at a 3% CAGR between 2017 and 2022. Sales are projected to expand at a 4.3% CAGR over the forecast period due to the growing demand for animal models for regenerative medicine and tissue engineering.

The presence and dominance of CROs in the country, which involve animal models in their research, and increasing focus on personalized medications are key factors expected to drive demand in the USA.

Due to the advent of COVID-19, people gave priority to being fully vaccinated. The demand for clinical research and studies increased with increasing vaccination rates and rising awareness. This directly impacted the demand for animal models as it is used in the development of various vaccines.

Ongoing research and development in the healthcare sector for the development of regenerative medicine and tissue engineering are propelling demand for an animal model. Growing usage of animal model-based preclinical interpretation of new therapeutics and drug discovery & development might fuel sales in the market.

What are the Key Opportunities for USA Animal Model Manufacturers?

Animal models are effective tools for conducting preclinical; studies to learn about human biology. Factors driving the development and usage of animal models are:

  • The need to understand how drugs work in humans.
  • Growing interest in investigating human-specific diseases, therapies, and immune responses.

The increasing prevalence of diseases is compelling the government to focus on preventive measures. This is driving investments for performing clinical trials on animal models. For instance, in March 2020, the FDA spent around US$ 250,000 on testing coronavirus on animal models including monkeys, mice, ferrets, and others.

Hefty investments and policy reforms by the government have stimulated funding schemes with regard to animal model research, which is creating opportunities for growth in the market. In addition to this, different species of animal models have different anatomy, physiology, lifespan, and disease characteristics. Therefore, some experiments on animals do not provide conclusive information on patient outcomes. For accurate clinical research in the discovery of drugs, there is still a need for perfect genetically modified animal models.

Animal model providers are benefitting from the next-generation sequencing technology and genome engineering tools. They provide custom and rare disease models, with a focus on supporting personalized therapy drug trials. For instance,

  • Charles River Laboratories provides hACE2-NCG mouse models specifically designed for COVID-19 research. Such developments are expected to bode well for the market over the forecast period.
Sabyasachi Ghosh
Sabyasachi Ghosh

Principal Consultant

Talk to Analyst

Find your sweet spots for generating winning opportunities in this market.

What are the Factors Restraining Demand in the USA Animal Model Market?

Delays in drug approvals and reduced possibilities of medication for human use can hamper the growth of the animal model market. Drugs that survive clinical trials and get approved are sometimes recalled because of toxicity identified in them after a few months or years.

Some animal models have a limited ability to mimic proper complex processes of human physiology, progression, and carcinogenesis. Due to this, safety and efficacy identified in animal studies sometimes cannot be considered for humans. In many cases, certain mouse models’ physiological changes occur in the spectrum that does not occur in human disease.

Some animal model tests take months or years to conduct and analyze. For example, around 4-5 years are taken for rodent cancer studies, which involves thousands and sometimes millions of dollars.

Government regulatory agencies and scientific organizations are finding alternative methods due to the high costs of animal model clinical trials. It is to replace animal testing and provide improvements in the safety of new medications for human use. This can hamper the growth of the animal model market.

Comparative View of Adjacent USA Animal Model Market

USA Animal Model Market:

Attributes USA Animal Model Market
CAGR (2023 to 2033) 4.3%
Market Value (2023) US$ 976.1 million
Growth Factor Increasing need for research efforts at pharmaceutical and biotechnology firms.
Future Opportunities Making the clinical trials for vaccines & fast-track evaluation of prospective drugs.
Market Trends Federal investment for large research projects and financial support are boosting the demand.

USA Yeast Extract Market:

Attributes USA Yeast Extract Market
CAGR (2023 to 2033) 8.3%
Market Value (2023) US$ 1,291.3 million
Growth Factor The growing adoption of plant-based diets as a taste enhancer and food ingredient.
Future Opportunities Increasing demand for natural ingredients as people become health conscious.
Market Trends To meet customer demand, businesses are investing in research & experiments hugely.

USA Medical Coding Market:

Attributes USA Medical Coding Market
CAGR (2023 to 2033) 8.4%
Market Value (2023) US$ 1,000 million
Growth Factor The rise in medical appointments and hospital admissions in the United States.
Future Opportunities Growing medical tourism sector with appropriate provision for the same.
Market Trends Leading players are collaborating with hospitals to ensure administrative processes.

Get the data you need at a Fraction of the cost

Personalize your report by choosing insights you need
and save 40%!

Category-wise Insights

Which Species is Driving Sales?

Demand in the Mice Model Segment to Retain their Dominance and Gain Momentum

In terms of species, the mice model segment held a market share of around 61.03% in 2022, with sales anticipated to expand at 5.1% through 2033.

Mice models are one of the most important tools for performing preclinical research to acquire insights into human biology as they are genetically similar to humans. These models are created by engrafting human cells or tissues into mice, resulting in the expression of human proteins.

Mice are increasingly being employed as models in biomedical research for HIV/AIDS, cancer, regenerative medicine, hepatitis, and infectious disease research. They are being developed and used in response to a growing need to determine the true effects of medications on humans. Besides this, the increasing focus on researching human-specific infections, therapies, and immunological responses might continue pushing sales in this segment in the forthcoming years.

Category By Species
Top Segment Mice
Market Share in Percentage 61.03%
Category By End-user Verticals
Top Segment Academic & Research Institutes
Market Share in Percentage 37.21%

Which is the Leading Therapeutics Segment in the Animal Model Market?

Sales of Animal Models for Oncology Research to Remain High

Based on therapeutics, the oncology segment held nearly 32.6% of the total market share in 2022, and the trend is expected to continue over the forecast period.

Animal models are widely used in oncology to study the biochemical and physiological processes of the occurrence and development of cancer. They help in determining the appropriate treatment approach for specific cancers.

Presently, there is a huge global burden of chronic diseases, including cancer. In vitro as well as in vivo approaches are being developed to fight against the rising prevalence of cancer. One of the most significant advancements is the development of humanized mouse and rodent models. They offer high prescient power for the viability of standard and novel anti-cancer therapeutics.

Factors such as the importance of personalized medicine, monoclonal antibodies, and the potential to treat diseases easily on a personal level are expected to fuel sales in this segment.

Which Application Holds a Dominant Share in the USA Animal Model Market?

Adoption of Animal Models in Novel Drug Discovery to Increase Further

By application, total sales of animal models in the drug discovery/development segment accounted for 65.4% of the total market share in 2022.

Drug discovery/development is invariably a lengthy and costly process. It begins with the identification and validation of a potential molecular/cellular therapeutic target. It further moves through a series of preclinical and clinical trials, culminating in a series of regulatory approvals. The usage of experimental animal models helps researchers better understand the genesis, pathophysiology, and overall character of human diseases.

Animal models for drug discovery and development have played a crucial role in the characterization of disease pathophysiology and associated mechanisms of injury and target identification. They are also used for the evaluation of novel therapeutic agents for toxicity/safety, pharmacodynamics, and pharmacokinetics. They are also used for the efficacy of the development of safe and effective therapies and cures for diseases and/or symptoms connected with them.

Which End User Benefits the Most from the Employment of Animal Model?

Applications of Animal Models in Academic and Research Institutes might Gain Traction

Based on end users, demand in the academic & research institutes segments was about 37.21% of the total market share in 2022. Growth of this segment can be attributed to the increasing establishment of academic & research institutes for developing drugs and vaccines for various chronic diseases.

Researchers utilize animal models to examine and assemble evidence-based findings to address different health-related problems. The availability of highly qualified and skilled scientists at academic & research institutes might also contribute to the growth of this segment.
Competitive Landscape

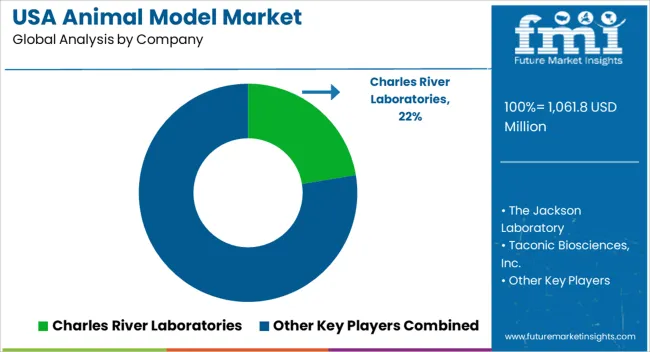
The USA animal model market is fragmented with the presence of established as well emerging market players. These players are actively investing in acquisitions, collaborations, and product launches as key strategies. For instance:

  • In January 2022, Taconic Biosciences launched huNOG-EXL EA (Early Access) humanized immune system mice. This unique mouse model supports human myeloid and lymphoid cells, which makes this mouse model useful for immunological and oncological research.
  • In April 2021, Ingenious Targeting Laboratory and SMOC collaborated to produce and distribute catalogue mouse models for Ingenious Targeting Laboratory to distribute SMOC’s validated off-the-shelf mouse models in North America and Europe.
  • In June 2021, the Dana-Farber Cancer Institute and Harbour BioMed collaborated to work on novel biotherapies for cancer treatment. Both organizations worked together on the development of CAR-T cell products and bio-specific antibodies.

Report Scope as per USA Animal Model Industry Analysis

Attribute Details
Forecast Period 2023 to 2033
Historical Data Available for 2017 to 2022
Market Analysis US$ million or billion for Value
Key Countries Covered The United States of America
Key Market Segments Covered By Species, By Technology, By Applications, By Use and By End-user Verticals
Key Companies Profiled Charles River Laboratories; The Jackson Laboratory; Taconic Biosciences, Inc.; Genoway; Envigo (Inotiv, Inc.); Marshall BioResources; Janvier Labs; Applied stem cells; Biocytogen; Transposagen Biopharmaceuticals, Inc. (Hera Bio Labs); Cyagen; Ingenious targeting labs; Crown Bioscience Inc. (JSR Corporation).; Harbour Biomed; Sinclair BioResources; Alpha Genesis Inc.; Creative Animodel; DaVinci Biomedical Research Products, Inc
Report Coverage Market Forecast, Company Share Analysis, Competition Intelligence, DROT Analysis, Market Dynamics and Challenges, and Strategic Growth Initiatives
Customization & Pricing Available upon Request

Key Segments Covered by USA Animal Model Industry Survey Report

By Species:

  • Mice
  • Rats
  • Fish
  • Birds
  • Cattles
  • Pigs
  • Amphibians
  • Guinea Pigs
  • Dogs
  • Cats
  • Rabbits
  • Monkeys
  • Sheep
  • Hamsters
  • Other Animals

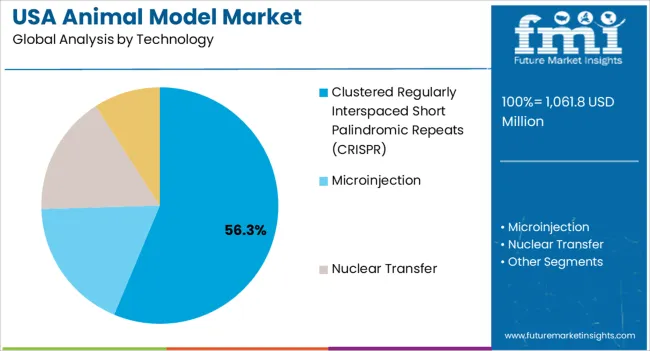
By Technology:

  • Clustered Regularly Interspaced Short Palindromic Repeats (CRISPR)
  • Microinjection
  • Nuclear Transfer
  • Other Technologies

By Application:

  • Research & Development
    • Infectious Disease
    • Immunological Diseases
    • Cancer
    • Cardiovascular Diseases
    • Diabetes
    • Genetic Diseases
    • Neurological Diseases
    • Obesity
    • NAFLD or NASH
    • Renal disease
    • Diabetic eye disease
    • Fibrosis
    • Micro-biome
    • Other Research and Developments
  • Production and Quality Control
  • Academics
  • Preclinical Applications
    • Infectious Disease
    • Immunological Diseases
    • Cancer
    • Cardiovascular Diseases
    • Diabetes
    • Genetic Diseases
    • Neurological Diseases
    • Obesity
    • NAFLD/NASH
    • Renal disease
    • Diabetic eye disease
    • Fibrosis
    • Micro-biome
    • Other Preclinical Applications
  • Other Applications

By Use:

  • Human
  • Veterinary

By End-user Verticals:

  • Companies
    • Pharmaceutical
    • Biotechnology
    • Cosmetics
    • Other Companies
  • Organizations
    • Government
    • Non-government
  • Academic and Research Institutes
  • Contract Research Organizations (CRO)

Frequently Asked Questions

How Big will be the Market by 2033?

The market is estimated to reach US$ 1,487.9 million by 2033.

Who are the Vital Market Players?

Genoway, Cyagen, and Biocytogen are the vital market players.

What is the Current Market Valuation?

The market is estimated to secure a valuation of US$ 976.1 million in 2023.

What is the Growth Potential of the Market?

The growth potential of the market is 4.3% through 2033.

What Drives Sales of the Market?

Rising need for research efforts at pharmaceutical and biotechnology firms.

Table of Content
1. Executive Summary

    1.1. Global Market Outlook

    1.2. Demand-side Trends

    1.3. Supply-side Trends

    1.4. Technology Roadmap Analysis

    1.5. Analysis and Recommendations

2. Market Overview

    2.1. Market Coverage / Taxonomy

    2.2. Market Definition / Scope / Limitations

3. Market Background

    3.1. Market Dynamics

        3.1.1. Drivers

        3.1.2. Restraints

        3.1.3. Opportunity

        3.1.4. Trends

    3.2. Scenario Forecast

        3.2.1. Demand in Optimistic Scenario

        3.2.2. Demand in Likely Scenario

        3.2.3. Demand in Conservative Scenario

    3.3. Opportunity Map Analysis

    3.4. Product Life Cycle Analysis

    3.5. Supply Chain Analysis

        3.5.1. Supply Side Participants and their Roles

            3.5.1.1. Producers

            3.5.1.2. Mid-Level Participants (Traders/ Agents/ Brokers)

            3.5.1.3. Wholesalers and Distributors

        3.5.2. Value Added and Value Created at Node in the Supply Chain

        3.5.3. List of Raw Material Suppliers

        3.5.4. List of Existing and Potential Buyer’s

    3.6. Investment Feasibility Matrix

    3.7. Value Chain Analysis

        3.7.1. Profit Margin Analysis

        3.7.2. Wholesalers and Distributors

        3.7.3. Retailers

    3.8. PESTLE and Porter’s Analysis

    3.9. Regulatory Landscape

        3.9.1. By Key Regions

        3.9.2. By Key Countries

    3.10. Regional Parent Market Outlook

    3.11. Production and Consumption Statistics

    3.12. Import and Export Statistics

4. Global Market Analysis 2018 to 2022 and Forecast, 2023 to 2033

    4.1. Historical Market Size Value (US$ Million) & Volume (Units) Analysis, 2018 to 2022

    4.2. Current and Future Market Size Value (US$ Million) & Volume (Units) Projections, 2023 to 2033

        4.2.1. Y-o-Y Growth Trend Analysis

        4.2.2. Absolute $ Opportunity Analysis

5. Global Market Analysis 2018 to 2022 and Forecast 2023 to 2033, By Species

    5.1. Introduction / Key Findings

    5.2. Historical Market Size Value (US$ Million) & Volume (Units) Analysis By Species, 2018 to 2022

    5.3. Current and Future Market Size Value (US$ Million) & Volume (Units) Analysis and Forecast By Species, 2023 to 2033

        5.3.1. Mouse

        5.3.2. Rat

        5.3.3. Zebrafish

        5.3.4. Rabbit

        5.3.5. Guinea pig

        5.3.6. Others

    5.4. Y-o-Y Growth Trend Analysis By Species, 2018 to 2022

    5.5. Absolute $ Opportunity Analysis By Species, 2023 to 2033

6. Global Market Analysis 2018 to 2022 and Forecast 2023 to 2033, By Therapeutics

    6.1. Introduction / Key Findings

    6.2. Historical Market Size Value (US$ Million) & Volume (Units) Analysis By Therapeutics, 2018 to 2022

    6.3. Current and Future Market Size Value (US$ Million) & Volume (Units) Analysis and Forecast By Therapeutics, 2023 to 2033

        6.3.1. Oncology

        6.3.2. Cardiovascular diseases

        6.3.3. Neurological disorders

        6.3.4. Immunological disorders

        6.3.5. Genetic disorders

        6.3.6. Others

    6.4. Y-o-Y Growth Trend Analysis By Therapeutics, 2018 to 2022

    6.5. Absolute $ Opportunity Analysis By Therapeutics, 2023 to 2033

7. Global Market Analysis 2018 to 2022 and Forecast 2023 to 2033, By Applications

    7.1. Introduction / Key Findings

    7.2. Historical Market Size Value (US$ Million) & Volume (Units) Analysis By Applications, 2018 to 2022

    7.3. Current and Future Market Size Value (US$ Million) & Volume (Units) Analysis and Forecast By Applications, 2023 to 2033

        7.3.1. Drug discovery and development

        7.3.2. Basic research

        7.3.3. Toxicology

        7.3.4. Preclinical testing

        7.3.5. Others

    7.4. Y-o-Y Growth Trend Analysis By Applications, 2018 to 2022

    7.5. Absolute $ Opportunity Analysis By Applications, 2023 to 2033

8. Global Market Analysis 2018 to 2022 and Forecast 2023 to 2033, By End-users

    8.1. Introduction / Key Findings

    8.2. Historical Market Size Value (US$ Million) & Volume (Units) Analysis By End-users, 2018 to 2022

    8.3. Current and Future Market Size Value (US$ Million) & Volume (Units) Analysis and Forecast By End-users, 2023 to 2033

        8.3.1. Pharmaceutical and biotechnology companies

        8.3.2. Academic and research institutes

        8.3.3. Contract research organizations (CROs)

        8.3.4. Government and regulatory agencies

    8.4. Y-o-Y Growth Trend Analysis By End-users, 2018 to 2022

    8.5. Absolute $ Opportunity Analysis By End-users, 2023 to 2033

9. Global Market Analysis 2018 to 2022 and Forecast 2023 to 2033, By Region

    9.1. Introduction

    9.2. Historical Market Size Value (US$ Million) & Volume (Units) Analysis By Region, 2018 to 2022

    9.3. Current Market Size Value (US$ Million) & Volume (Units) Analysis and Forecast By Region, 2023 to 2033

        9.3.1. North America

        9.3.2. Latin America

        9.3.3. Europe

        9.3.4. Asia Pacific

        9.3.5. MEA

    9.4. Market Attractiveness Analysis By Region

10. North America Market Analysis 2018 to 2022 and Forecast 2023 to 2033, By Country

    10.1. Historical Market Size Value (US$ Million) & Volume (Units) Trend Analysis By Market Taxonomy, 2018 to 2022

    10.2. Market Size Value (US$ Million) & Volume (Units) Forecast By Market Taxonomy, 2023 to 2033

        10.2.1. By Country

            10.2.1.1. The USA

            10.2.1.2. Canada

        10.2.2. By Species

        10.2.3. By Therapeutics

        10.2.4. By Applications

        10.2.5. By End-users

    10.3. Market Attractiveness Analysis

        10.3.1. By Country

        10.3.2. By Species

        10.3.3. By Therapeutics

        10.3.4. By Applications

        10.3.5. By End-users

    10.4. Key Takeaways

11. Latin America Market Analysis 2018 to 2022 and Forecast 2023 to 2033, By Country

    11.1. Historical Market Size Value (US$ Million) & Volume (Units) Trend Analysis By Market Taxonomy, 2018 to 2022

    11.2. Market Size Value (US$ Million) & Volume (Units) Forecast By Market Taxonomy, 2023 to 2033

        11.2.1. By Country

            11.2.1.1. Brazil

            11.2.1.2. Mexico

            11.2.1.3. Rest of Latin America

        11.2.2. By Species

        11.2.3. By Therapeutics

        11.2.4. By Applications

        11.2.5. By End-users

    11.3. Market Attractiveness Analysis

        11.3.1. By Country

        11.3.2. By Species

        11.3.3. By Therapeutics

        11.3.4. By Applications

        11.3.5. By End-users

    11.4. Key Takeaways

12. Europe Market Analysis 2018 to 2022 and Forecast 2023 to 2033, By Country

    12.1. Historical Market Size Value (US$ Million) & Volume (Units) Trend Analysis By Market Taxonomy, 2018 to 2022

    12.2. Market Size Value (US$ Million) & Volume (Units) Forecast By Market Taxonomy, 2023 to 2033

        12.2.1. By Country

            12.2.1.1. Germany

            12.2.1.2. United Kingdom

            12.2.1.3. France

            12.2.1.4. Spain

            12.2.1.5. Italy

            12.2.1.6. Rest of Europe

        12.2.2. By Species

        12.2.3. By Therapeutics

        12.2.4. By Applications

        12.2.5. By End-users

    12.3. Market Attractiveness Analysis

        12.3.1. By Country

        12.3.2. By Species

        12.3.3. By Therapeutics

        12.3.4. By Applications

        12.3.5. By End-users

    12.4. Key Takeaways

13. Asia Pacific Market Analysis 2018 to 2022 and Forecast 2023 to 2033, By Country

    13.1. Historical Market Size Value (US$ Million) & Volume (Units) Trend Analysis By Market Taxonomy, 2018 to 2022

    13.2. Market Size Value (US$ Million) & Volume (Units) Forecast By Market Taxonomy, 2023 to 2033

        13.2.1. By Country

            13.2.1.1. China

            13.2.1.2. Japan

            13.2.1.3. South Korea

            13.2.1.4. Singapore

            13.2.1.5. Thailand

            13.2.1.6. Indonesia

            13.2.1.7. Australia

            13.2.1.8. New Zealand

            13.2.1.9. Rest of Asia Pacific

        13.2.2. By Species

        13.2.3. By Therapeutics

        13.2.4. By Applications

        13.2.5. By End-users

    13.3. Market Attractiveness Analysis

        13.3.1. By Country

        13.3.2. By Species

        13.3.3. By Therapeutics

        13.3.4. By Applications

        13.3.5. By End-users

    13.4. Key Takeaways

14. MEA Market Analysis 2018 to 2022 and Forecast 2023 to 2033, By Country

    14.1. Historical Market Size Value (US$ Million) & Volume (Units) Trend Analysis By Market Taxonomy, 2018 to 2022

    14.2. Market Size Value (US$ Million) & Volume (Units) Forecast By Market Taxonomy, 2023 to 2033

        14.2.1. By Country

            14.2.1.1. GCC Countries

            14.2.1.2. South Africa

            14.2.1.3. Israel

            14.2.1.4. Rest of MEA

        14.2.2. By Species

        14.2.3. By Therapeutics

        14.2.4. By Applications

        14.2.5. By End-users

    14.3. Market Attractiveness Analysis

        14.3.1. By Country

        14.3.2. By Species

        14.3.3. By Therapeutics

        14.3.4. By Applications

        14.3.5. By End-users

    14.4. Key Takeaways

15. Key Countries Market Analysis

    15.1. USA

        15.1.1. Pricing Analysis

        15.1.2. Market Share Analysis, 2022

            15.1.2.1. By Species

            15.1.2.2. By Therapeutics

            15.1.2.3. By Applications

            15.1.2.4. By End-users

    15.2. Canada

        15.2.1. Pricing Analysis

        15.2.2. Market Share Analysis, 2022

            15.2.2.1. By Species

            15.2.2.2. By Therapeutics

            15.2.2.3. By Applications

            15.2.2.4. By End-users

    15.3. Brazil

        15.3.1. Pricing Analysis

        15.3.2. Market Share Analysis, 2022

            15.3.2.1. By Species

            15.3.2.2. By Therapeutics

            15.3.2.3. By Applications

            15.3.2.4. By End-users

    15.4. Mexico

        15.4.1. Pricing Analysis

        15.4.2. Market Share Analysis, 2022

            15.4.2.1. By Species

            15.4.2.2. By Therapeutics

            15.4.2.3. By Applications

            15.4.2.4. By End-users

    15.5. Germany

        15.5.1. Pricing Analysis

        15.5.2. Market Share Analysis, 2022

            15.5.2.1. By Species

            15.5.2.2. By Therapeutics

            15.5.2.3. By Applications

            15.5.2.4. By End-users

    15.6. United Kingdom

        15.6.1. Pricing Analysis

        15.6.2. Market Share Analysis, 2022

            15.6.2.1. By Species

            15.6.2.2. By Therapeutics

            15.6.2.3. By Applications

            15.6.2.4. By End-users

    15.7. France

        15.7.1. Pricing Analysis

        15.7.2. Market Share Analysis, 2022

            15.7.2.1. By Species

            15.7.2.2. By Therapeutics

            15.7.2.3. By Applications

            15.7.2.4. By End-users

    15.8. Spain

        15.8.1. Pricing Analysis

        15.8.2. Market Share Analysis, 2022

            15.8.2.1. By Species

            15.8.2.2. By Therapeutics

            15.8.2.3. By Applications

            15.8.2.4. By End-users

    15.9. Italy

        15.9.1. Pricing Analysis

        15.9.2. Market Share Analysis, 2022

            15.9.2.1. By Species

            15.9.2.2. By Therapeutics

            15.9.2.3. By Applications

            15.9.2.4. By End-users

    15.10. China

        15.10.1. Pricing Analysis

        15.10.2. Market Share Analysis, 2022

            15.10.2.1. By Species

            15.10.2.2. By Therapeutics

            15.10.2.3. By Applications

            15.10.2.4. By End-users

    15.11. Japan

        15.11.1. Pricing Analysis

        15.11.2. Market Share Analysis, 2022

            15.11.2.1. By Species

            15.11.2.2. By Therapeutics

            15.11.2.3. By Applications

            15.11.2.4. By End-users

    15.12. South Korea

        15.12.1. Pricing Analysis

        15.12.2. Market Share Analysis, 2022

            15.12.2.1. By Species

            15.12.2.2. By Therapeutics

            15.12.2.3. By Applications

            15.12.2.4. By End-users

    15.13. Singapore

        15.13.1. Pricing Analysis

        15.13.2. Market Share Analysis, 2022

            15.13.2.1. By Species

            15.13.2.2. By Therapeutics

            15.13.2.3. By Applications

            15.13.2.4. By End-users

    15.14. Thailand

        15.14.1. Pricing Analysis

        15.14.2. Market Share Analysis, 2022

            15.14.2.1. By Species

            15.14.2.2. By Therapeutics

            15.14.2.3. By Applications

            15.14.2.4. By End-users

    15.15. Indonesia

        15.15.1. Pricing Analysis

        15.15.2. Market Share Analysis, 2022

            15.15.2.1. By Species

            15.15.2.2. By Therapeutics

            15.15.2.3. By Applications

            15.15.2.4. By End-users

    15.16. Australia

        15.16.1. Pricing Analysis

        15.16.2. Market Share Analysis, 2022

            15.16.2.1. By Species

            15.16.2.2. By Therapeutics

            15.16.2.3. By Applications

            15.16.2.4. By End-users

    15.17. New Zealand

        15.17.1. Pricing Analysis

        15.17.2. Market Share Analysis, 2022

            15.17.2.1. By Species

            15.17.2.2. By Therapeutics

            15.17.2.3. By Applications

            15.17.2.4. By End-users

    15.18. GCC Countries

        15.18.1. Pricing Analysis

        15.18.2. Market Share Analysis, 2022

            15.18.2.1. By Species

            15.18.2.2. By Therapeutics

            15.18.2.3. By Applications

            15.18.2.4. By End-users

    15.19. South Africa

        15.19.1. Pricing Analysis

        15.19.2. Market Share Analysis, 2022

            15.19.2.1. By Species

            15.19.2.2. By Therapeutics

            15.19.2.3. By Applications

            15.19.2.4. By End-users

    15.20. Israel

        15.20.1. Pricing Analysis

        15.20.2. Market Share Analysis, 2022

            15.20.2.1. By Species

            15.20.2.2. By Therapeutics

            15.20.2.3. By Applications

            15.20.2.4. By End-users

16. Market Structure Analysis

    16.1. Competition Dashboard

    16.2. Competition Benchmarking

    16.3. Market Share Analysis of Top Players

        16.3.1. By Regional

        16.3.2. By Species

        16.3.3. By Therapeutics

        16.3.4. By Applications

        16.3.5. By End-users

17. Competition Analysis

    17.1. Competition Deep Dive

        17.1.1. Charles River Laboratories

            17.1.1.1. Overview

            17.1.1.2. Product Portfolio

            17.1.1.3. Profitability by Market Segments

            17.1.1.4. Sales Footprint

            17.1.1.5. Strategy Overview

                17.1.1.5.1. Marketing Strategy

                17.1.1.5.2. Product Strategy

                17.1.1.5.3. Channel Strategy

        17.1.2. The Jackson Laboratory

            17.1.2.1. Overview

            17.1.2.2. Product Portfolio

            17.1.2.3. Profitability by Market Segments

            17.1.2.4. Sales Footprint

            17.1.2.5. Strategy Overview

                17.1.2.5.1. Marketing Strategy

                17.1.2.5.2. Product Strategy

                17.1.2.5.3. Channel Strategy

        17.1.3. Taconic Biosciences, Inc.

            17.1.3.1. Overview

            17.1.3.2. Product Portfolio

            17.1.3.3. Profitability by Market Segments

            17.1.3.4. Sales Footprint

            17.1.3.5. Strategy Overview

                17.1.3.5.1. Marketing Strategy

                17.1.3.5.2. Product Strategy

                17.1.3.5.3. Channel Strategy

        17.1.4. Genoway

            17.1.4.1. Overview

            17.1.4.2. Product Portfolio

            17.1.4.3. Profitability by Market Segments

            17.1.4.4. Sales Footprint

            17.1.4.5. Strategy Overview

                17.1.4.5.1. Marketing Strategy

                17.1.4.5.2. Product Strategy

                17.1.4.5.3. Channel Strategy

        17.1.5. Envigo (Inotiv, Inc.)

            17.1.5.1. Overview

            17.1.5.2. Product Portfolio

            17.1.5.3. Profitability by Market Segments

            17.1.5.4. Sales Footprint

            17.1.5.5. Strategy Overview

                17.1.5.5.1. Marketing Strategy

                17.1.5.5.2. Product Strategy

                17.1.5.5.3. Channel Strategy

        17.1.6. Marshall BioResources

            17.1.6.1. Overview

            17.1.6.2. Product Portfolio

            17.1.6.3. Profitability by Market Segments

            17.1.6.4. Sales Footprint

            17.1.6.5. Strategy Overview

                17.1.6.5.1. Marketing Strategy

                17.1.6.5.2. Product Strategy

                17.1.6.5.3. Channel Strategy

        17.1.7. Janvier Labs

            17.1.7.1. Overview

            17.1.7.2. Product Portfolio

            17.1.7.3. Profitability by Market Segments

            17.1.7.4. Sales Footprint

            17.1.7.5. Strategy Overview

                17.1.7.5.1. Marketing Strategy

                17.1.7.5.2. Product Strategy

                17.1.7.5.3. Channel Strategy

        17.1.8. Applied stem cells

            17.1.8.1. Overview

            17.1.8.2. Product Portfolio

            17.1.8.3. Profitability by Market Segments

            17.1.8.4. Sales Footprint

            17.1.8.5. Strategy Overview

                17.1.8.5.1. Marketing Strategy

                17.1.8.5.2. Product Strategy

                17.1.8.5.3. Channel Strategy

        17.1.9. Biocytogen

            17.1.9.1. Overview

            17.1.9.2. Product Portfolio

            17.1.9.3. Profitability by Market Segments

            17.1.9.4. Sales Footprint

            17.1.9.5. Strategy Overview

                17.1.9.5.1. Marketing Strategy

                17.1.9.5.2. Product Strategy

                17.1.9.5.3. Channel Strategy

        17.1.10. Transposagen Biopharmaceuticals, Inc. (Hera Bio Labs)

            17.1.10.1. Overview

            17.1.10.2. Product Portfolio

            17.1.10.3. Profitability by Market Segments

            17.1.10.4. Sales Footprint

            17.1.10.5. Strategy Overview

                17.1.10.5.1. Marketing Strategy

                17.1.10.5.2. Product Strategy

                17.1.10.5.3. Channel Strategy

        17.1.11. Cyagen

            17.1.11.1. Overview

            17.1.11.2. Product Portfolio

            17.1.11.3. Profitability by Market Segments

            17.1.11.4. Sales Footprint

            17.1.11.5. Strategy Overview

                17.1.11.5.1. Marketing Strategy

                17.1.11.5.2. Product Strategy

                17.1.11.5.3. Channel Strategy

        17.1.12. Ingenious targeting labs

            17.1.12.1. Overview

            17.1.12.2. Product Portfolio

            17.1.12.3. Profitability by Market Segments

            17.1.12.4. Sales Footprint

            17.1.12.5. Strategy Overview

                17.1.12.5.1. Marketing Strategy

                17.1.12.5.2. Product Strategy

                17.1.12.5.3. Channel Strategy

        17.1.13. Crown Bioscience Inc. (JSR Corporation).

            17.1.13.1. Overview

            17.1.13.2. Product Portfolio

            17.1.13.3. Profitability by Market Segments

            17.1.13.4. Sales Footprint

            17.1.13.5. Strategy Overview

                17.1.13.5.1. Marketing Strategy

                17.1.13.5.2. Product Strategy

                17.1.13.5.3. Channel Strategy

        17.1.14. Harbour Biomed

            17.1.14.1. Overview

            17.1.14.2. Product Portfolio

            17.1.14.3. Profitability by Market Segments

            17.1.14.4. Sales Footprint

            17.1.14.5. Strategy Overview

                17.1.14.5.1. Marketing Strategy

                17.1.14.5.2. Product Strategy

                17.1.14.5.3. Channel Strategy

        17.1.15. Sinclair BioResources

            17.1.15.1. Overview

            17.1.15.2. Product Portfolio

            17.1.15.3. Profitability by Market Segments

            17.1.15.4. Sales Footprint

            17.1.15.5. Strategy Overview

                17.1.15.5.1. Marketing Strategy

                17.1.15.5.2. Product Strategy

                17.1.15.5.3. Channel Strategy

18. Assumptions & Acronyms Used

19. Research Methodology
Recommendations

Healthcare

Animal Model Market

January 2022

REP-GB-3141

January 2024

289 pages

Healthcare

Humanized Mouse Model Market

July 2017

REP-GB-4527

September 2023

310 pages

Explore Healthcare Insights

View Reports