
- Market Size (2026)
- USD 1270.0 Mn
- Forecast (2036)
- USD 2230.0 Mn
- CAGR (2026 to 2036)
- 5.8%
How big is the Animal Feed Sweetener Market in 2026?
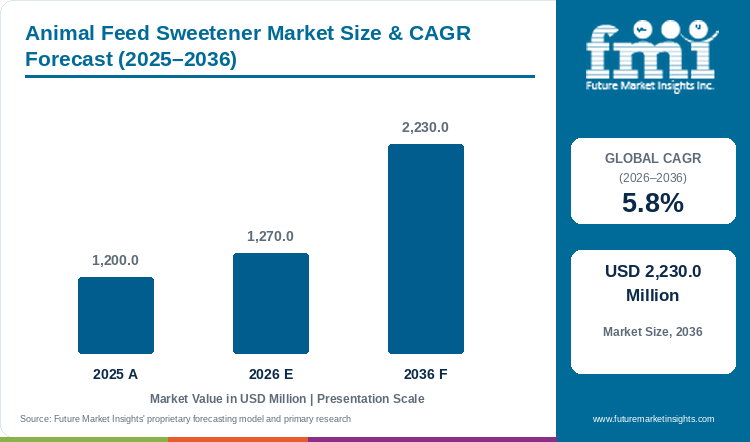
The Animal Feed Sweetener Market is projected to reach USD 2,230.0 million by 2036, growing at a 5.8% CAGR from 2026 to 2036.
FMI estimates the market at USD 1,270.0 million in 2026, up from USD 1,200.0 million in 2025. Sweeteners keep young animals eating, so demand follows starter, weaner and milk-replacer feed more than total feed tonnage. Alltech estimated that world feed output reached 1.44 billion tonnes in 2025, up 2.9%. Regulation (EU) 2024/1727 ended sodium saccharin use in piglet feed in three steps, the last on 11 July 2026. The geography of the piglet crop sets the addressable base for swine, which holds 45.0% of market value. USDA tracks 1.32 billion pigs born across 11 producers in 2026, and China accounts for 731 million of them. The European Union follows with 235 million, the United States with 135 million and Brazil with 50 million. Together these four account for 1,151 million pigs, or 87.2% of the tracked crop. Spain alone holds 25.6% of the EU pig population. Authorisation in China, the EU, the United States and Brazil therefore covers most of the volume a supplier can sell.
Key Market Trends & Insights
- Saccharin-free sweeteners are replacing the long-standing piglet standard in Europe. Regulation (EU) 2024/1727 withdrew sodium saccharin in piglet feed in three steps. Existing stocks could be used until 11 July 2025, premixtures until 11 October 2025 and compound feed until 11 July 2026. Phytobiotics sells PhytoSense 2.5, built on stevia and neohesperidin dihydrochalcone, at 150 g per tonne of feed. ADM sells saccharin-free Sucram M'I Sweet and Specifeek for weanling pigs.
- Feed volume is growing fastest in aquaculture, where Alltech recorded output up 4.7% to 55.5 million tonnes in 2025. Broiler feed rose 3.7% and pig feed 3.0% in the same year.
- Suppliers are selling sweeteners inside bundled palatability programmes. Adisseo markets Delistart, a combination of flavourings, appetising substances and sweeteners built for young animal feed. Piglet sweeteners work best in combination with a supplier's flavour range, according to one specialist.
Regional Highlights
- In Asia Pacific, feed volume growth is carrying sweetener demand, with Alltech recording Asian feed output of 559.3 million tonnes in 2025. China alone produced 330.1 million tonnes, up 4.8%.
- In Europe, regulation changes the product mix more than volume, as feed output grew 1.0% to 274.1 million tonnes in 2025. Sodium saccharin could stay in piglet compound feed until 11 July 2026, so reformulation ran through 2025 and 2026.
- In Latin America, growth rests on protein exports, and Alltech described the region as the world's leading protein basket, with 204.4 million tonnes of feed produced in 2025.
Animal Feed Sweetener Market Size and Forecast
Table 1: Animal Feed Sweetener Market Size and Forecast
| Market size and forecast | Value |
|---|---|
| Market size in 2025 | USD 1,200.0 million |
| Estimated market size in 2026 | USD 1,270.0 million |
| Projected market size by 2036 | USD 2,230.0 million |
| CAGR from 2026 to 2036 | 5.8% |
Source: Future Market Insights analysis of the animal feed sweetener market, 2026.
Analyst Perspective
“Sweetener revenue depends on how many piglets, calves and other young animals are weaned onto commercial feed each year, and on how much a feed mill will pay for a few hundred grams per tonne. Buyers judge a supplier on proof of intake response, regulatory status in each country and the ability to bundle sweeteners with flavours. Suppliers that held their position through a saccharin-based product face the greatest reformulation risk in Europe, while those with stevia or NHDC blends can sell the replacement.”
- Nandini Roy Choudhury, Principal Consultant, FMI
How is the Animal Feed Sweetener Market segmented?
- By source: Synthetic (saccharin, sucralose, neohesperidin dihydrochalcone and other high-intensity sweeteners), Natural (stevia, monk fruit, molasses-based and other plant-derived sweeteners).
- By animal type: Swine, Poultry, Ruminants, Aquaculture, Pets and Others.
- By form: Powder, Liquid, Crystal.
- By sales channel: Direct Sales (B2B), Distributors and Traders, Retail (Offline and Online).
- By region: North America, Latin America, Europe, East Asia, South Asia, Oceania, Middle East and Africa.
Why do Synthetic sweeteners lead by Source in the Animal Feed Sweetener Market in 2026?
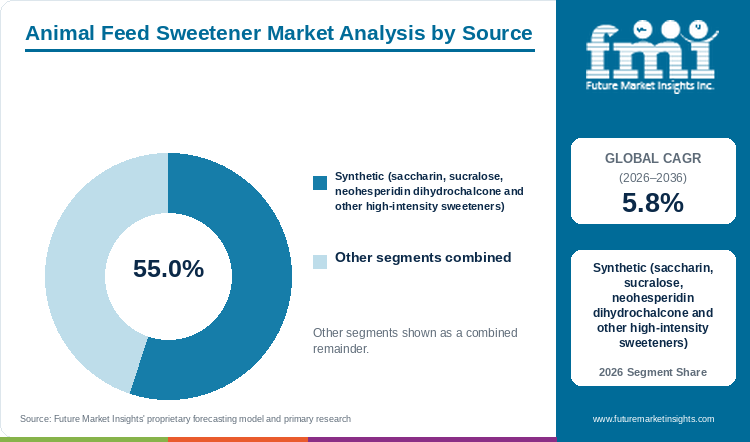
Synthetic sweeteners are estimated to account for 55.0% of the Animal Feed Sweetener Market by source in 2026.
A 2024 pig study found that sucralose, and neohesperidin dihydrochalcone combined with saccharin, improved feed intake. EFSA's feed additive panel concluded in 2025 that neohesperidin dihydrochalcone remains safe for target species, consumers and the environment. Natural sweeteners are estimated to hold the remaining 45.0%. Regulation (EU) 2024/1727 removed sodium saccharin, a long-standing synthetic piglet sweetener, from EU piglet feed. Suppliers now sell saccharin-free replacements, including stevia and neohesperidin dihydrochalcone blends.
Table 2: Source, 2026 Share
| Leading Share | 2026 market share |
|---|---|
| Synthetic | 55.0% |
| All Other Segments Combined Share | 45.0% |
Source: Future Market Insights analysis of the animal feed sweetener market, 2026.
Why does Swine lead by Animal Type in the Animal Feed Sweetener Market in 2026?
Swine feed is estimated to account for 45.0% of the Animal Feed Sweetener Market by animal type in 2026.
Weaning is the critical window, since piglets lose their milk source and face solid feed. Sweeteners help maintain intake during that change. Sweeteners designed for weanling pig feed are sold by major nutrition groups. The swine feed base is also very large. Alltech estimates pig feed output at 380.9 million tonnes in 2025, up 3.0%, second only to broilers at 400.4 million tonnes. Aquaculture feed output rose faster, up 4.7% to 55.5 million tonnes.
Table 3: Animal Type, 2026 Share
| Leading Share | 2026 market share |
|---|---|
| Swine | 45.0% |
| All Other Segments Combined Share | 55.0% |
Source: Future Market Insights analysis of the animal feed sweetener market, 2026.
Why does Powder lead by Form in the Animal Feed Sweetener Market in 2026?
Powder is estimated to account for 42.0% of the Animal Feed Sweetener Market by form in 2026.
Premix and feed mill operations are built around dry dosing, and Phytobiotics describes PhytoSense as stable through pelleting. Its stevia products are offered as extracts, extract and dextrose blends and dried leaf meal, all dry forms. The extract and dextrose blend fits milk replacers as well as dry feed. Liquid, crystal and other forms together are estimated to hold the remaining 58.0%.
Table 4: Form, 2026 Share
| Leading Share | 2026 market share |
|---|---|
| Powder | 42.0% |
| All Other Segments Combined Share | 58.0% |
Source: Future Market Insights analysis of the animal feed sweetener market, 2026.
Why do Direct Sales (B2B) lead by Sales Channel in the Animal Feed Sweetener Market in 2026?
Direct business-to-business sales are estimated to account for 62.0% of the Animal Feed Sweetener Market by sales channel in 2026.
Sweeteners are specified by nutritionists at feed mills and integrators, and the sale usually comes with formulation support. Large nutrition groups sell sweeteners together with wider nutrition services, which keeps the relationship direct. Distributors and traders, with retail sales of pet and smallholder products, are estimated to hold the remaining 38.0%.
Table 5: Sales Channel, 2026 Share
| Leading Share | 2026 market share |
|---|---|
| Direct Sales (B2B) | 62.0% |
| All Other Segments Combined Share | 38.0% |
Source: Future Market Insights analysis of the animal feed sweetener market, 2026.
What are the key drivers, restraints and opportunities?
Driver
Growth in young-animal and compound feed. Feed volume is growing in the species that use sweeteners most. Alltech recorded gains of 3.0% in pig feed and 4.7% in aquaculture feed in 2025. Each additional weaned piglet or fed fish adds to the base on which sweeteners are sold.
Replacement demand after the European saccharin withdrawal. All transition periods under Regulation (EU) 2024/1727 had ended by 11 July 2026. EU piglet feed therefore needs saccharin-free sweeteners, such as stevia-based products.
Restraint
Margin pressure at producers. Live pig prices in China averaged 11.3 yuan per kg from January to 17 June 2026, 27.0% below a year earlier. Prices sat below break-even, and feed mills under that pressure may keep palatability spending low unless the intake gain is demonstrated.
Regulatory and species-specific limits. Approval status differs by country and species, which slows product launches and requires a separate dossier for each region. China maintains positive lists of approved feed additives and approves imported products in batches, with 233 products from 100 companies approved in one 2026 announcement.
Opportunity
Natural and saccharin-free ranges. Suppliers with EU-compliant plant-based sweeteners can win replacement business in piglet feed, since mills that find a drop-in dose need no reformulation. One specialist reported a 10.0% higher cumulative feed intake in its own 42-day trial of 400 weaned piglets against a saccharin blend.
Aquaculture and early-life nutrition. Aquaculture feed output grew 4.7% to 55.5 million tonnes in 2025, the highest rate among the species Alltech tracks. Species-specific products for fish starter feed therefore offer growth beyond the pig feed base.
Animal Feed Sweetener Market by Country (2026 to 2036)
Table 6: Animal Feed Sweetener Market Country Growth Forecast
| Country | CAGR, 2026 to 2036 |
|---|---|
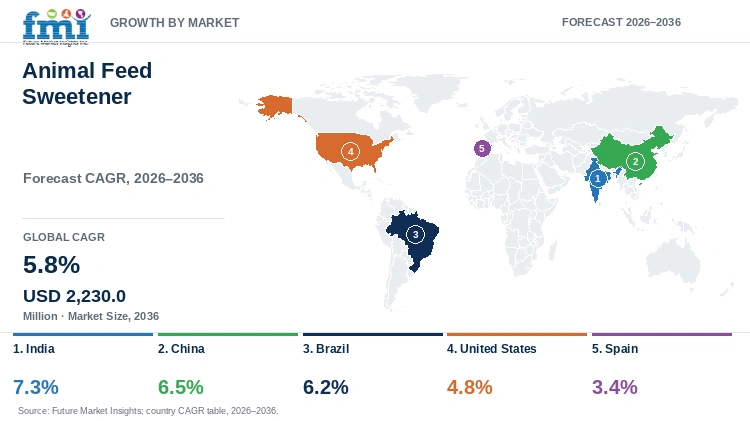
| India | 7.3% |
| China | 6.5% |
| Brazil | 6.2% |
| United States | 4.8% |
| Spain | 3.4% |
Source: Future Market Insights analysis of the animal feed sweetener market, 2026.
India
India is the fastest-growing profiled market from a smaller base. Alltech recorded feed output of 57.7 million tonnes in 2025, up 4.5%. Demand for feed sweeteners in India is projected to grow at a 7.3% CAGR from 2026 to 2036.
Indian livestock output is growing steadily. India ranks first in milk production with 25.0% of world output. Its per capita supply is 485 grams a day against a world average of 328 grams. It ranks second in egg production and fourth in meat production. Milk yield rose 27.0% to 2,079 kg per animal per year in 2024 to 2025. Milk output rose from 146.31 million tonnes in 2014 to 2015 to 247.87 million tonnes in 2024 to 2025. That is growth of 5.4% a year. Egg output rose from 78.48 billion to 149.11 billion units, or 6.6% a year. Meat output reached 10.50 million tonnes at 4.6% a year. USDA projects the calf crop at 72.1 million head in 2026 and 72.5 million in 2027.
Dairy and poultry anchor Indian demand. Delhi market sources quote pork at INR 400 to 600 per kg and poultry at INR 275 to 375. Most dairy holdings keep two to five animals, while specialised herds of 20 to 50 animals are growing. Sweetener volume therefore follows the specialised herds more than total cattle numbers.
China
China leads feed production, with Alltech recording 330.1 million tonnes in 2025, up 4.8%. Feed is shifting from on-farm mixing to commercial feed. The agriculture ministry maintains a positive list of feed additives and approves imported products in batches. Product registration is therefore the main entry barrier for foreign suppliers. Compound annual growth of 6.5% is projected for China between 2026 and 2036.
Herd policy caps volume, so the forecast rests on how pigs are fed more than on how many are born. China held 39.6 million sows at the end of 2025. USDA expects sow stocks to move toward a 37.5 million head target. USDA forecasts the pig crop at 731 million in 2026 and 722 million in 2027. Farms slaughtering 500 or more pigs a year supplied 70.7% of slaughter in 2024, up from 43.4% in 2015. That shift moves piglets onto commercial feed, which is where sweeteners are specified.
Price pressure is the counterweight. Live pig prices averaged 11.3 yuan per kg from January to 17 June 2026, 27.0% below a year earlier. Prices sat below break-even, so state and local governments bought pork for reserves. Thin margins limit the premium that mills accept for natural sweeteners. Pork imports fell nearly 30.0% through August 2026. Foreign suppliers reach Chinese feed mills only with approved products. The ministry approved 233 products from 100 companies in one 2026 announcement.
Brazil
Brazil is the third-largest feed producer, behind China and the United States. It is also an export-led protein supplier, and Alltech recorded 89.9 million tonnes of feed in 2025, up 2.8%. A 6.2% CAGR is projected for 2026 to 2036, and it depends on pork exports and swine feed output.
Brazil has the fastest-growing piglet crop among the large producers. USDA shows the pig crop rising from 48.8 million in 2025 to 51.0 million in 2027, up 4.5%. China falls 1.2% over the same period, and the European Union falls 0.2%. USDA expects efficiency to lift pigs per litter and carcass weights even as sow numbers fall. The national feed union estimates that swine feed output rose 2.6% in 2026.
Supply has outrun demand, which weighs on hog prices and producer margins. USDA reports an oversupply of hogs at the start of 2026. Brazilian pork export unit values fell 2.1% from January to July. Brazil ships 36.0% of its output abroad, against 25.5% for the United States. Over 35.0% of its 2025 exports went to the Philippines, Japan and South Korea, where import pace has stalled. WOAH has considered Brazil free of ASF since 1988. Feed accounts for 70.0% to 75.0% of swine production cost, so sweetener spending competes with a far larger line.
United States
The United States has a large but mature feed base. Alltech recorded 267.4 million tonnes of feed in 2025, down 0.8%. A tight cattle cycle reduced beef feed, while pork feed stabilised and broiler and dairy feed grew. The projected CAGR for the United States is 4.8% over 2026 to 2036.
The piglet count is flat to lower, so volume does not explain growth. NASS counted 74.3 million hogs and pigs on US farms on 1 September 2026, down 2.0% from a year earlier. Of these, 68.4 million were market hogs and 5.87 million were kept for breeding. The inventory was up 2.0% from 1 June 2026. Producers weaned 34.5 million pigs from June to August, down 2.0% from a year earlier. USDA forecasts the 2026 pig crop at 134.8 million, which is 1.0% below 2025. Litter size offsets part of the loss, at 11.96 pigs per litter in the same quarter. US producers intend 2.85 million sows to farrow from September to November 2026. A further 2.80 million are planned for December 2026 to February 2027.
Growth therefore rests on value per piglet, not on the number of piglets. Pork exports of 3.2 million tonnes in 2026 equal 25.5% of output. USDA describes sector profitability as relatively strong in 2026. Strong margins leave room for spending on intake support at weaning.
Spain
Spain's feed output was 37.5 million tonnes in 2025, down 3.4%, according to Alltech. Europe's feed output rose 1.0% to 274.1 million tonnes, so Spain ran against the regional trend. Piglet compound feed containing sodium saccharin could stay on the EU market until 11 July 2026. Spain hosts Industrial Técnica Pecuaria, S.A. (ITPSA), a feed additive producer founded in 1968. Value growth comes from replacement sweeteners while feed volume is lower, which supports a 3.4% CAGR from 2026 to 2036.
Herd size does not explain the low forecast. Spain holds 25.6% of the EU pig population and produced 5.3 million tonnes of pigmeat in 2025, up 6.0%. Trade explains it, since Spain declared wild cases of ASF in November 2025, the first since 1994. Japan, Malaysia and Taiwan still restrict its pork. Product moved to other EU states, and EU export unit values fell 8.7% from January to July 2026.
Price and policy cap the upside from here. The last transition period for sodium saccharin in compound feed ended on 11 July 2026. The reformulation step is therefore complete. USDA expects EU pork output to fall 1.0% to 22.0 million tonnes in 2027 on environmental regulation. Eurostat shows the EU pig population 15.0% smaller than in 2005. Replacement sweeteners therefore sell into a shrinking EU herd.
Who are the notable companies in the Animal Feed Sweetener Market?
Notable companies in the Animal Feed Sweetener Market include ADM, Phytobiotics, Norel, Adisseo and HOWTIAN.
Registration, geography and formulation separate feed sweetener suppliers after the European saccharin withdrawal. ADM sells the Sucram range in more than 45 countries. It launched saccharin-free Sucram M'I Sweet and Specifeek for weanling pigs. Both products were developed to activate swine sweet taste receptors. Adisseo markets Delistart, a combination of flavourings, appetising substances and sweeteners formulated for young animal feed.
Phytobiotics and Norel compete on saccharin-free replacements. Regulation (EU) 2024/1727 withdrew sodium saccharin from piglet feed, with the last transition period ending on 11 July 2026. Phytobiotics sells PhytoSense 2.5, built on stevia and neohesperidin dihydrochalcone, at 150 g per tonne of feed. That dosage is comparable to saccharin products, so mills avoid reformulation. Norel offers a saccharin-free sweetener solution and reported a new plant in Johor, Malaysia in October 2026.
HOWTIAN promoted a stevia extract as a saccharin-free sweetener for animal feed in April 2025, after the European withdrawal. Industrial Técnica Pecuaria, S.A. (ITPSA) is a Spanish multinational that has produced feed additives since 1968. Authorisation rules decide which products these suppliers may sell. They differ between the European Union and China, and China approves imported feed products in batches.
Key Players in the Animal Feed Sweetener Market
- ADM Animal Nutrition
- Phytobiotics Futterzusatzstoffe GmbH
- Norel Animal Nutrition
- Adisseo
- Industrial Técnica Pecuaria, S.A. (ITPSA)
- HOWTIAN
Animal Feed Sweetener Market Report Scope
Table 7: Animal Feed Sweetener Market Report Scope
| Coverage field | Report scope |
|---|---|
| Market definition | Sweeteners sold as feed additives to improve palatability and feed intake in livestock, aquaculture and pet diets, valued at manufacturer selling prices. Flavours, natural enhancers without a sweetening role, and molasses sold as a bulk energy ingredient are excluded. |
| Source | Synthetic (saccharin, sucralose, neohesperidin dihydrochalcone and other high-intensity sweeteners); Natural (stevia, monk fruit, molasses-based and other plant-derived sweeteners) |
| Animal Type | Swine; Poultry; Ruminants; Aquaculture; Pets and Others |
| Form | Powder; Liquid; Crystal |
| Sales Channel | Direct Sales (B2B); Distributors and Traders; Retail (Offline and Online) |
| Regions and profiled countries | North America, Latin America, Europe, East Asia, South Asia, Oceania, Middle East and Africa. Profiled countries: India, China, Brazil, United States, Spain |
| Companies covered | ADM Animal Nutrition; Phytobiotics Futterzusatzstoffe GmbH; Norel Animal Nutrition; Adisseo; Industrial Tecnica Pecuaria, S.A. Industrial Técnica Pecuaria, S.A. (ITPSA); HOWTIAN |
| Quantitative Units | USD million |
Animal Feed Sweetener Market by Segments
Animal Feed Sweetener Market segmented by Source:
- Synthetic (saccharin, sucralose, neohesperidin dihydrochalcone and other high-intensity sweeteners)
- Natural (stevia, monk fruit, molasses-based and other plant-derived sweeteners)
Animal Feed Sweetener Market segmented by Animal Type:
- Swine
- Poultry
- Ruminants
- Aquaculture
- Pets and Others
Animal Feed Sweetener Market segmented by Form:
- Powder
- Liquid
- Crystal
Animal Feed Sweetener Market segmented by Sales Channel:
- Direct Sales (B2B)
- Distributors and Traders
- Retail (Offline and Online)
Animal Feed Sweetener Market by Region
- North America
- Latin America
- Europe
- East Asia
- South Asia
- Oceania
- Middle East
- Africa
- India
- China
- Brazil
- United States
- Spain
Research Sources and Bibliography
- [1] Alltech. (2026, April 21). 2026 Alltech Agri-Food Outlook shares global feed production survey data. https://www.alltech.com/press-release/2026-alltech-agri-food-outlook-shares-global-feed-production-survey-data
- [2] European Commission. (2024, June 20). Commission Implementing Regulation (EU) 2024/1727 withdrawing from the market certain feed additives. https://eur-lex.europa.eu/eli/reg_impl/2024/1727/oj/eng
- [3] Phytobiotics Futterzusatzstoffe GmbH. (2025, May 8). Europe goes saccharin-free: Innovative sweetener for piglet nutrition. Feed & Additive Magazine. https://www.feedandadditive.com/europe-goes-saccharin-free-innovative-sweetener-for-piglet-nutrition/
- [4] Phytobiotics. (2026). Sweeteners for Animal Feed (product overview). https://www.phytobiotics.com/en_eur/products/sweeteners/
- [5] ADM. (2022, November 22). ADM launches two new sweeteners for weanling pig feed. National Hog Farmer. https://www.nationalhogfarmer.com/farming-business-management/adm-launches-two-new-sweeteners-for-weanling-pig-feed
- [6] Adisseo. (2026, July 15). Early gut care: piglets' readiness (North America). https://www.adisseo.com/fr/na/piglet-gut-health-pwd-resilience
- [7] Evaluating the Effects of Non-Nutritive Sweeteners on Pigs. (2024, October 19). PubMed Central. https://pmc.ncbi.nlm.nih.gov/articles/PMC11504390/
- [8] Norel Nutricion Animal. (2024, May 21). Sweetener solution from Norel, saccharin-free. https://norel.net/en/sweetener-solution-norel-saccharin-free/
- [9] EFSA Panel on Additives and Products or Substances used in Animal Feed (FEEDAP). (2025). Assessment of the feed additive neohesperidine dihydrochalcone for all animal species (renewal). EFSA Journal 23(4):e9358. https://pmc.ncbi.nlm.nih.gov/articles/PMC11983774/
- [10] knoell. (2026, May 4). China MARA approves 233 imported feed products. https://www.knoell.com/en/news/china-mara-approves-233-imported-feed-products
- [11] Interzoo. (2026). ITPSA Industrial Tecnica Pecuaria S.A, company profile. https://www.interzoo.com/en/exhibitors/itpsa-industrial-tecnica-pecuaria-sa-2499794
- [12] HOWTIAN. (2025, April 7). Saccharin-free sweetener for animal feed: HOWTIAN's stevia extract. https://howtiangroup.com/a-smarter-sweetener-for-animal-feed-howtians-stevia-extract/
- [13] U.S. Department of Agriculture, Foreign Agricultural Service. (2026, October 9). Livestock and Poultry: World Markets and Trade. https://apps.fas.usda.gov/psdonline/circulars/livestock_poultry.pdf
- [14] Eurostat. (2026). Livestock populations and meat production. Statistics Explained. https://ec.europa.eu/eurostat/statistics-explained/index.php?title=Livestock_populations_and_meat_production
- [15] U.S. Department of Agriculture, National Agricultural Statistics Service. (2026, September 24). United States hog inventory down 2%. https://www.nass.usda.gov/Newsroom/2026/09-24-2026.php
- [16] U.S. Department of Agriculture, Foreign Agricultural Service. (2026, September 3). Brazil: Livestock and Products Annual, GAIN report BR2026-0035. https://apps.fas.usda.gov/newgainapi/api/Report/DownloadReportByFileName?fileName=Livestock+and+Products+Annual_Brasilia_Brazil_BR2026-0035.pdf
- [17] U.S. Department of Agriculture, Foreign Agricultural Service. (2026, September 23). India: Livestock and Products Annual, GAIN report IN2026-0049. https://agriexchange.apeda.gov.in/MarketReport/9999904032026929162151223.pdf
- [18] Press Information Bureau, Government of India. (2026, January 7). Year end review of Animal Husbandry and Dairy Department for the year 2025. https://www.pib.gov.in/PressReleasePage.aspx?PRID=2212290
- [19] AHDB. (2026, July 6). China pork market update: oversupply and weak demand weigh on prices. https://ahdb.org.uk/news/china-pork-market-update-oversupply-and-weak-demand-weigh-on-prices
- [20] Liu, C. et al. (2026). Moderate Scale of Pig Farming: Implications for Herd Management and Disease Control, Evidence from Heilongjiang Province, China. Veterinary Sciences, 13(8), 728. https://www.mdpi.com/2306-7381/13/8/728
- [21] Norel Animal Nutrition. (2026, October 13). Norel expands Asia-Pacific presence with new Malaysia facility. Feed & Additive Magazine. https://www.feedandadditive.com/norel-expands-asia-pacific-presence-with-new-malaysia-facility/
Table of Content
- Key Takeaways
- Market Size and CAGR
- Top Growth Driver
- Fastest Growing Segment
- Leading Region
- Key Companies
- Emerging Opportunities
- Executive Summary
- Global Market Outlook
- Demand-side Trends
- Supply-side Trends
- Technology Roadmap Analysis
- Analysis and Recommendations
- Analyst Perspective (What is happening? Why now? What should investors know?)
- Key Questions Answered
- How large is the market?
- What is the CAGR?
- What are key trends?
- Which region dominates?
- Who are the leaders?
Read More...
- Market Overview
- Market Coverage / Taxonomy
- Market Definition / Scope / Limitations
- Research Methodology
- Chapter Orientation
- Analytical Lens and Working Hypotheses
- Market Structure, Signals, and Trend Drivers
- Benchmarking and Cross-market Comparability
- Market Sizing, Forecasting, and Opportunity Mapping
- Research Design and Evidence Framework
- Desk Research Programme (Secondary Evidence)
- Expert Input and Fieldwork (Primary Evidence)
- Tooling, Models, and Reference Databases
- Data Engineering and Model Build
- Quality Assurance and Audit Trail
- Market Background
- Market Dynamics (Drivers, Restraints, Opportunity, Trends)
- Scenario Forecast (Optimistic, Likely, Conservative)
- Impact Analysis
- AI Impact
- Sustainability Impact
- Regulatory Impact
- Technology Impact
- Consumer / Buyer Analysis
- Purchase Drivers
- Adoption Barriers
- Buyer Journey
- Opportunity Map Analysis
- Product Life Cycle Analysis
- Supply Chain Analysis
- Investment Feasibility Matrix
- Value Chain Analysis
- PESTLE and Porter's Analysis
- Regulatory Landscape
- Regional Parent Market Outlook
- Production and Consumption Statistics
- Import and Export Statistics
- Global Market Analysis and Forecast, 2021 to 2036
- Historical Market Size Value (USD Million) Analysis, 2021 to 2025
- Current and Future Market Size Value (USD Million) Projections, 2026 to 2036
- Y-o-Y Growth Trend Analysis
- Absolute $ Opportunity Analysis
- Global Market Pricing Analysis, 2021 to 2036
- Global Market Analysis and Forecast, By Source, 2021 to 2036
- Introduction / Key Findings
- Historical Market Size Value (USD Million) Analysis By Source, 2021 to 2025
- Current and Future Market Size Value (USD Million) Analysis and Forecast By Source, 2026 to 2036
- Synthetic (saccharin, sucralose, neohesperidin dihydrochalcone and other high-intensity sweeteners)
- Natural (stevia, monk fruit, molasses-based and other plant-derived sweeteners)
- Y-o-Y Growth Trend Analysis By Source, 2021 to 2025
- Absolute $ Opportunity Analysis By Source, 2026 to 2036
- Global Market Analysis and Forecast, By Animal Type, 2021 to 2036
- Introduction / Key Findings
- Historical Market Size Value (USD Million) Analysis By Animal Type, 2021 to 2025
- Current and Future Market Size Value (USD Million) Analysis and Forecast By Animal Type, 2026 to 2036
- Swine
- Poultry
- Ruminants
- Aquaculture
- Pets and Others
- Y-o-Y Growth Trend Analysis By Animal Type, 2021 to 2025
- Absolute $ Opportunity Analysis By Animal Type, 2026 to 2036
- Global Market Analysis and Forecast, By Form, 2021 to 2036
- Introduction / Key Findings
- Historical Market Size Value (USD Million) Analysis By Form, 2021 to 2025
- Current and Future Market Size Value (USD Million) Analysis and Forecast By Form, 2026 to 2036
- Powder
- Liquid
- Crystal
- Y-o-Y Growth Trend Analysis By Form, 2021 to 2025
- Absolute $ Opportunity Analysis By Form, 2026 to 2036
- Global Market Analysis and Forecast, By Sales Channel, 2021 to 2036
- Introduction / Key Findings
- Historical Market Size Value (USD Million) Analysis By Sales Channel, 2021 to 2025
- Current and Future Market Size Value (USD Million) Analysis and Forecast By Sales Channel, 2026 to 2036
- Direct Sales (B2B)
- Distributors and Traders
- Retail (Offline and Online)
- Y-o-Y Growth Trend Analysis By Sales Channel, 2021 to 2025
- Absolute $ Opportunity Analysis By Sales Channel, 2026 to 2036
- Global Market Analysis and Forecast, By Region, 2021 to 2036
- Introduction
- Historical Market Size Value (USD Million) Analysis By Region, 2021 to 2025
- Current Market Size Value (USD Million) Analysis and Forecast By Region, 2026 to 2036
- North America
- Latin America
- Europe
- East Asia
- South Asia
- Oceania
- Middle East
- Africa
- Market Attractiveness Analysis By Region
- North America Market Analysis and Forecast, By Country, 2021 to 2036
- Historical Market Size Value (USD Million) Trend Analysis By Market Taxonomy, 2021 to 2025
- Market Size Value (USD Million) Forecast By Market Taxonomy, 2026 to 2036
- By Country
- By Source
- By Animal Type
- By Form
- By Sales Channel
- Market Attractiveness Analysis
- By Country
- By Source
- By Animal Type
- By Form
- By Sales Channel
- Key Takeaways
- Latin America Market Analysis and Forecast, By Country
- Historical Market Size Value (USD Million) Trend Analysis By Market Taxonomy, 2021 to 2025
- Market Size Value (USD Million) Forecast By Market Taxonomy, 2026 to 2036
- By Country
- By Source
- By Animal Type
- By Form
- By Sales Channel
- Market Attractiveness Analysis
- By Country
- By Source
- By Animal Type
- By Form
- By Sales Channel
- Key Takeaways
- Europe Market Analysis and Forecast, By Country
- Historical Market Size Value (USD Million) Trend Analysis By Market Taxonomy, 2021 to 2025
- Market Size Value (USD Million) Forecast By Market Taxonomy, 2026 to 2036
- By Country
- By Source
- By Animal Type
- By Form
- By Sales Channel
- Market Attractiveness Analysis
- By Country
- By Source
- By Animal Type
- By Form
- By Sales Channel
- Key Takeaways
- East Asia Market Analysis and Forecast, By Country
- Historical Market Size Value (USD Million) Trend Analysis By Market Taxonomy, 2021 to 2025
- Market Size Value (USD Million) Forecast By Market Taxonomy, 2026 to 2036
- By Country
- By Source
- By Animal Type
- By Form
- By Sales Channel
- Market Attractiveness Analysis
- By Country
- By Source
- By Animal Type
- By Form
- By Sales Channel
- Key Takeaways
- South Asia Market Analysis and Forecast, By Country
- Historical Market Size Value (USD Million) Trend Analysis By Market Taxonomy, 2021 to 2025
- Market Size Value (USD Million) Forecast By Market Taxonomy, 2026 to 2036
- By Country
- By Source
- By Animal Type
- By Form
- By Sales Channel
- Market Attractiveness Analysis
- By Country
- By Source
- By Animal Type
- By Form
- By Sales Channel
- Key Takeaways
- Oceania Market Analysis and Forecast, By Country
- Historical Market Size Value (USD Million) Trend Analysis By Market Taxonomy, 2021 to 2025
- Market Size Value (USD Million) Forecast By Market Taxonomy, 2026 to 2036
- By Country
- By Source
- By Animal Type
- By Form
- By Sales Channel
- Market Attractiveness Analysis
- By Country
- By Source
- By Animal Type
- By Form
- By Sales Channel
- Key Takeaways
- Middle East Market Analysis and Forecast, By Country
- Historical Market Size Value (USD Million) Trend Analysis By Market Taxonomy, 2021 to 2025
- Market Size Value (USD Million) Forecast By Market Taxonomy, 2026 to 2036
- By Country
- By Source
- By Animal Type
- By Form
- By Sales Channel
- Market Attractiveness Analysis
- By Country
- By Source
- By Animal Type
- By Form
- By Sales Channel
- Key Takeaways
- Africa Market Analysis and Forecast, By Country
- Historical Market Size Value (USD Million) Trend Analysis By Market Taxonomy, 2021 to 2025
- Market Size Value (USD Million) Forecast By Market Taxonomy, 2026 to 2036
- By Country
- India
- China
- Brazil
- United States
- Spain
- By Source
- By Animal Type
- By Form
- By Sales Channel
- By Country
- Market Attractiveness Analysis
- By Country
- By Source
- By Animal Type
- By Form
- By Sales Channel
- Key Takeaways
- Key Countries Market Analysis
- United States
- Pricing Analysis
- Market Share Analysis, 2025
- By Source
- By Animal Type
- By Form
- By Sales Channel
- Brazil
- Pricing Analysis
- Market Share Analysis, 2025
- By Source
- By Animal Type
- By Form
- By Sales Channel
- Spain
- Pricing Analysis
- Market Share Analysis, 2025
- By Source
- By Animal Type
- By Form
- By Sales Channel
- India
- Pricing Analysis
- Market Share Analysis, 2025
- By Source
- By Animal Type
- By Form
- By Sales Channel
- China
- Pricing Analysis
- Market Share Analysis, 2025
- By Source
- By Animal Type
- By Form
- By Sales Channel
- United States
- Market Structure Analysis
- Competition Dashboard
- Competition Benchmarking
- Market Share Analysis of Top Players
- By Regional
- By Source
- By Animal Type
- By Form
- By Sales Channel
- Emerging Startups
- Innovation Benchmarking
- Competition Analysis
- Competition Deep Dive
- ADM Animal Nutrition
- Overview
- Product Portfolio
- Profitability by Market Segments
- Sales Footprint
- Strategy Overview
- Marketing Strategy
- Product Strategy
- Channel Strategy
- Phytobiotics Futterzusatzstoffe GmbH
- Norel Animal Nutrition
- Adisseo
- Industrial Técnica Pecuaria, S.A. (ITPSA)
- HOWTIAN
- ADM Animal Nutrition
- Case Studies
- Success Stories
- Recent Developments
- Competition Deep Dive
- Assumptions & Acronyms Used
List of Tables
- Table 1: Global Market Value (USD Million) Forecast by Region, 2021 to 2036
- Table 2: Global Market Value (USD Million) Forecast by Source, 2021 to 2036
- Table 3: Global Market Value (USD Million) Forecast by Animal Type, 2021 to 2036
- Table 4: Global Market Value (USD Million) Forecast by Form, 2021 to 2036
- Table 5: Global Market Value (USD Million) Forecast by Sales Channel, 2021 to 2036
- Table 6: North America Market Value (USD Million) Forecast by Country, 2021 to 2036
- Table 7: North America Market Value (USD Million) Forecast by Source, 2021 to 2036
- Table 8: North America Market Value (USD Million) Forecast by Animal Type, 2021 to 2036
- Table 9: North America Market Value (USD Million) Forecast by Form, 2021 to 2036
- Table 10: North America Market Value (USD Million) Forecast by Sales Channel, 2021 to 2036
- Table 11: Latin America Market Value (USD Million) Forecast by Country, 2021 to 2036
- Table 12: Latin America Market Value (USD Million) Forecast by Source, 2021 to 2036
- Table 13: Latin America Market Value (USD Million) Forecast by Animal Type, 2021 to 2036
- Table 14: Latin America Market Value (USD Million) Forecast by Form, 2021 to 2036
- Table 15: Latin America Market Value (USD Million) Forecast by Sales Channel, 2021 to 2036
- Table 16: Europe Market Value (USD Million) Forecast by Country, 2021 to 2036
- Table 17: Europe Market Value (USD Million) Forecast by Source, 2021 to 2036
- Table 18: Europe Market Value (USD Million) Forecast by Animal Type, 2021 to 2036
- Table 19: Europe Market Value (USD Million) Forecast by Form, 2021 to 2036
- Table 20: Europe Market Value (USD Million) Forecast by Sales Channel, 2021 to 2036
- Table 21: East Asia Market Value (USD Million) Forecast by Country, 2021 to 2036
- Table 22: East Asia Market Value (USD Million) Forecast by Source, 2021 to 2036
- Table 23: East Asia Market Value (USD Million) Forecast by Animal Type, 2021 to 2036
- Table 24: East Asia Market Value (USD Million) Forecast by Form, 2021 to 2036
- Table 25: East Asia Market Value (USD Million) Forecast by Sales Channel, 2021 to 2036
- Table 26: South Asia Market Value (USD Million) Forecast by Country, 2021 to 2036
- Table 27: South Asia Market Value (USD Million) Forecast by Source, 2021 to 2036
- Table 28: South Asia Market Value (USD Million) Forecast by Animal Type, 2021 to 2036
- Table 29: South Asia Market Value (USD Million) Forecast by Form, 2021 to 2036
- Table 30: South Asia Market Value (USD Million) Forecast by Sales Channel, 2021 to 2036
- Table 31: Oceania Market Value (USD Million) Forecast by Country, 2021 to 2036
- Table 32: Oceania Market Value (USD Million) Forecast by Source, 2021 to 2036
- Table 33: Oceania Market Value (USD Million) Forecast by Animal Type, 2021 to 2036
- Table 34: Oceania Market Value (USD Million) Forecast by Form, 2021 to 2036
- Table 35: Oceania Market Value (USD Million) Forecast by Sales Channel, 2021 to 2036
- Table 36: Middle East Market Value (USD Million) Forecast by Country, 2021 to 2036
- Table 37: Middle East Market Value (USD Million) Forecast by Source, 2021 to 2036
- Table 38: Middle East Market Value (USD Million) Forecast by Animal Type, 2021 to 2036
- Table 39: Middle East Market Value (USD Million) Forecast by Form, 2021 to 2036
- Table 40: Middle East Market Value (USD Million) Forecast by Sales Channel, 2021 to 2036
- Table 41: Africa Market Value (USD Million) Forecast by Country, 2021 to 2036
- Table 42: Africa Market Value (USD Million) Forecast by Source, 2021 to 2036
- Table 43: Africa Market Value (USD Million) Forecast by Animal Type, 2021 to 2036
- Table 44: Africa Market Value (USD Million) Forecast by Form, 2021 to 2036
- Table 45: Africa Market Value (USD Million) Forecast by Sales Channel, 2021 to 2036
List of Figures
- Figure 1: Global Market Pricing Analysis
- Figure 2: Global Market Value (USD Million) Forecast 2021-2036
- Figure 3: Global Market Value Share and BPS Analysis by Source, 2026 and 2036
- Figure 4: Global Market Y-o-Y Growth Comparison by Source, 2026-2036
- Figure 5: Global Market Attractiveness Analysis by Source
- Figure 6: Global Market Value Share and BPS Analysis by Animal Type, 2026 and 2036
- Figure 7: Global Market Y-o-Y Growth Comparison by Animal Type, 2026-2036
- Figure 8: Global Market Attractiveness Analysis by Animal Type
- Figure 9: Global Market Value Share and BPS Analysis by Form, 2026 and 2036
- Figure 10: Global Market Y-o-Y Growth Comparison by Form, 2026-2036
- Figure 11: Global Market Attractiveness Analysis by Form
- Figure 12: Global Market Value Share and BPS Analysis by Sales Channel, 2026 and 2036
- Figure 13: Global Market Y-o-Y Growth Comparison by Sales Channel, 2026-2036
- Figure 14: Global Market Attractiveness Analysis by Sales Channel
- Figure 15: Global Market Value (USD Million) Share and BPS Analysis by Region, 2026 and 2036
- Figure 16: Global Market Y-o-Y Growth Comparison by Region, 2026-2036
- Figure 17: Global Market Attractiveness Analysis by Region
- Figure 18: North America Market Incremental Dollar Opportunity, 2026-2036
- Figure 19: Latin America Market Incremental Dollar Opportunity, 2026-2036
- Figure 20: Europe Market Incremental Dollar Opportunity, 2026-2036
- Figure 21: East Asia Market Incremental Dollar Opportunity, 2026-2036
- Figure 22: South Asia Market Incremental Dollar Opportunity, 2026-2036
- Figure 23: Oceania Market Incremental Dollar Opportunity, 2026-2036
- Figure 24: Middle East Market Incremental Dollar Opportunity, 2026-2036
- Figure 25: Africa Market Incremental Dollar Opportunity, 2026-2036
- Figure 26: North America Market Value Share and BPS Analysis by Country, 2026 and 2036
- Figure 27: North America Market Value Share and BPS Analysis by Source, 2026 and 2036
- Figure 28: North America Market Y-o-Y Growth Comparison by Source, 2026-2036
- Figure 29: North America Market Attractiveness Analysis by Source
- Figure 30: North America Market Value Share and BPS Analysis by Animal Type, 2026 and 2036
- Figure 31: North America Market Y-o-Y Growth Comparison by Animal Type, 2026-2036
- Figure 32: North America Market Attractiveness Analysis by Animal Type
- Figure 33: North America Market Value Share and BPS Analysis by Form, 2026 and 2036
- Figure 34: North America Market Y-o-Y Growth Comparison by Form, 2026-2036
- Figure 35: North America Market Attractiveness Analysis by Form
- Figure 36: North America Market Value Share and BPS Analysis by Sales Channel, 2026 and 2036
- Figure 37: North America Market Y-o-Y Growth Comparison by Sales Channel, 2026-2036
- Figure 38: North America Market Attractiveness Analysis by Sales Channel
- Figure 39: Latin America Market Value Share and BPS Analysis by Country, 2026 and 2036
- Figure 40: Latin America Market Value Share and BPS Analysis by Source, 2026 and 2036
- Figure 41: Latin America Market Y-o-Y Growth Comparison by Source, 2026-2036
- Figure 42: Latin America Market Attractiveness Analysis by Source
- Figure 43: Latin America Market Value Share and BPS Analysis by Animal Type, 2026 and 2036
- Figure 44: Latin America Market Y-o-Y Growth Comparison by Animal Type, 2026-2036
- Figure 45: Latin America Market Attractiveness Analysis by Animal Type
- Figure 46: Latin America Market Value Share and BPS Analysis by Form, 2026 and 2036
- Figure 47: Latin America Market Y-o-Y Growth Comparison by Form, 2026-2036
- Figure 48: Latin America Market Attractiveness Analysis by Form
- Figure 49: Latin America Market Value Share and BPS Analysis by Sales Channel, 2026 and 2036
- Figure 50: Latin America Market Y-o-Y Growth Comparison by Sales Channel, 2026-2036
- Figure 51: Latin America Market Attractiveness Analysis by Sales Channel
- Figure 52: Europe Market Value Share and BPS Analysis by Country, 2026 and 2036
- Figure 53: Europe Market Value Share and BPS Analysis by Source, 2026 and 2036
- Figure 54: Europe Market Y-o-Y Growth Comparison by Source, 2026-2036
- Figure 55: Europe Market Attractiveness Analysis by Source
- Figure 56: Europe Market Value Share and BPS Analysis by Animal Type, 2026 and 2036
- Figure 57: Europe Market Y-o-Y Growth Comparison by Animal Type, 2026-2036
- Figure 58: Europe Market Attractiveness Analysis by Animal Type
- Figure 59: Europe Market Value Share and BPS Analysis by Form, 2026 and 2036
- Figure 60: Europe Market Y-o-Y Growth Comparison by Form, 2026-2036
- Figure 61: Europe Market Attractiveness Analysis by Form
- Figure 62: Europe Market Value Share and BPS Analysis by Sales Channel, 2026 and 2036
- Figure 63: Europe Market Y-o-Y Growth Comparison by Sales Channel, 2026-2036
- Figure 64: Europe Market Attractiveness Analysis by Sales Channel
- Figure 65: East Asia Market Value Share and BPS Analysis by Country, 2026 and 2036
- Figure 66: East Asia Market Value Share and BPS Analysis by Source, 2026 and 2036
- Figure 67: East Asia Market Y-o-Y Growth Comparison by Source, 2026-2036
- Figure 68: East Asia Market Attractiveness Analysis by Source
- Figure 69: East Asia Market Value Share and BPS Analysis by Animal Type, 2026 and 2036
- Figure 70: East Asia Market Y-o-Y Growth Comparison by Animal Type, 2026-2036
- Figure 71: East Asia Market Attractiveness Analysis by Animal Type
- Figure 72: East Asia Market Value Share and BPS Analysis by Form, 2026 and 2036
- Figure 73: East Asia Market Y-o-Y Growth Comparison by Form, 2026-2036
- Figure 74: East Asia Market Attractiveness Analysis by Form
- Figure 75: East Asia Market Value Share and BPS Analysis by Sales Channel, 2026 and 2036
- Figure 76: East Asia Market Y-o-Y Growth Comparison by Sales Channel, 2026-2036
- Figure 77: East Asia Market Attractiveness Analysis by Sales Channel
- Figure 78: South Asia Market Value Share and BPS Analysis by Country, 2026 and 2036
- Figure 79: South Asia Market Value Share and BPS Analysis by Source, 2026 and 2036
- Figure 80: South Asia Market Y-o-Y Growth Comparison by Source, 2026-2036
- Figure 81: South Asia Market Attractiveness Analysis by Source
- Figure 82: South Asia Market Value Share and BPS Analysis by Animal Type, 2026 and 2036
- Figure 83: South Asia Market Y-o-Y Growth Comparison by Animal Type, 2026-2036
- Figure 84: South Asia Market Attractiveness Analysis by Animal Type
- Figure 85: South Asia Market Value Share and BPS Analysis by Form, 2026 and 2036
- Figure 86: South Asia Market Y-o-Y Growth Comparison by Form, 2026-2036
- Figure 87: South Asia Market Attractiveness Analysis by Form
- Figure 88: South Asia Market Value Share and BPS Analysis by Sales Channel, 2026 and 2036
- Figure 89: South Asia Market Y-o-Y Growth Comparison by Sales Channel, 2026-2036
- Figure 90: South Asia Market Attractiveness Analysis by Sales Channel
- Figure 91: Oceania Market Value Share and BPS Analysis by Country, 2026 and 2036
- Figure 92: Oceania Market Value Share and BPS Analysis by Source, 2026 and 2036
- Figure 93: Oceania Market Y-o-Y Growth Comparison by Source, 2026-2036
- Figure 94: Oceania Market Attractiveness Analysis by Source
- Figure 95: Oceania Market Value Share and BPS Analysis by Animal Type, 2026 and 2036
- Figure 96: Oceania Market Y-o-Y Growth Comparison by Animal Type, 2026-2036
- Figure 97: Oceania Market Attractiveness Analysis by Animal Type
- Figure 98: Oceania Market Value Share and BPS Analysis by Form, 2026 and 2036
- Figure 99: Oceania Market Y-o-Y Growth Comparison by Form, 2026-2036
- Figure 100: Oceania Market Attractiveness Analysis by Form
- Figure 101: Oceania Market Value Share and BPS Analysis by Sales Channel, 2026 and 2036
- Figure 102: Oceania Market Y-o-Y Growth Comparison by Sales Channel, 2026-2036
- Figure 103: Oceania Market Attractiveness Analysis by Sales Channel
- Figure 104: Middle East Market Value Share and BPS Analysis by Country, 2026 and 2036
- Figure 105: Middle East Market Value Share and BPS Analysis by Source, 2026 and 2036
- Figure 106: Middle East Market Y-o-Y Growth Comparison by Source, 2026-2036
- Figure 107: Middle East Market Attractiveness Analysis by Source
- Figure 108: Middle East Market Value Share and BPS Analysis by Animal Type, 2026 and 2036
- Figure 109: Middle East Market Y-o-Y Growth Comparison by Animal Type, 2026-2036
- Figure 110: Middle East Market Attractiveness Analysis by Animal Type
- Figure 111: Middle East Market Value Share and BPS Analysis by Form, 2026 and 2036
- Figure 112: Middle East Market Y-o-Y Growth Comparison by Form, 2026-2036
- Figure 113: Middle East Market Attractiveness Analysis by Form
- Figure 114: Middle East Market Value Share and BPS Analysis by Sales Channel, 2026 and 2036
- Figure 115: Middle East Market Y-o-Y Growth Comparison by Sales Channel, 2026-2036
- Figure 116: Middle East Market Attractiveness Analysis by Sales Channel
- Figure 117: Africa Market Value Share and BPS Analysis by Country, 2026 and 2036
- Figure 118: Africa Market Value Share and BPS Analysis by Source, 2026 and 2036
- Figure 119: Africa Market Y-o-Y Growth Comparison by Source, 2026-2036
- Figure 120: Africa Market Attractiveness Analysis by Source
- Figure 121: Africa Market Value Share and BPS Analysis by Animal Type, 2026 and 2036
- Figure 122: Africa Market Y-o-Y Growth Comparison by Animal Type, 2026-2036
- Figure 123: Africa Market Attractiveness Analysis by Animal Type
- Figure 124: Africa Market Value Share and BPS Analysis by Form, 2026 and 2036
- Figure 125: Africa Market Y-o-Y Growth Comparison by Form, 2026-2036
- Figure 126: Africa Market Attractiveness Analysis by Form
- Figure 127: Africa Market Value Share and BPS Analysis by Sales Channel, 2026 and 2036
- Figure 128: Africa Market Y-o-Y Growth Comparison by Sales Channel, 2026-2036
- Figure 129: Africa Market Attractiveness Analysis by Sales Channel
- Figure 130: Global Market - Tier Structure Analysis
- Figure 131: Global Market - Company Share Analysis
Frequently Asked Questions
How big is the Animal Feed Sweetener Market in 2026?
FMI estimates the market at USD 1,270.0 million in 2026, up from USD 1,200.0 million in 2025. It is forecast to reach USD 2,230.0 million by 2036 at a 5.8% CAGR.
Which source of sweetener leads in 2026?
Synthetic sweeteners are estimated to lead with 55.0% of 2026 value by source. Natural sweeteners hold the remaining 45.0%, and the European saccharin withdrawal removed a long-standing synthetic piglet sweetener [2].
Which animal type uses the most feed sweetener?
Swine is estimated to lead with 45.0% of 2026 value because sweeteners are used heavily in piglet weaning diets [3].
Which country is forecast to grow fastest through 2036?
India has the highest forecast CAGR among the profiled countries at 7.3% during 2026 to 2036, followed by China at 6.5%.
Why was saccharin removed from European feed?
Regulation (EU) 2024/1727 withdrew sodium saccharin for piglets from the EU market. Applications for its re-evaluation were not submitted or were withdrawn [2]. Existing stocks could be used until 11 July 2025 and premixtures until 11 October 2025 [2]. Compound feed and feed materials could be used until 11 July 2026 [2].
Preview the report firsthand - request a free sample
Get SampleGet the brochure for pricing and purchase details.
Get PDF
