
- Market Size (2026)
- USD 2.41 Bn
- Forecast (2036)
- USD 3.92 Bn
- CAGR (2026 to 2036)
- 5.0%
How Big Is the Animal Feed Prebiotics Market in 2026?
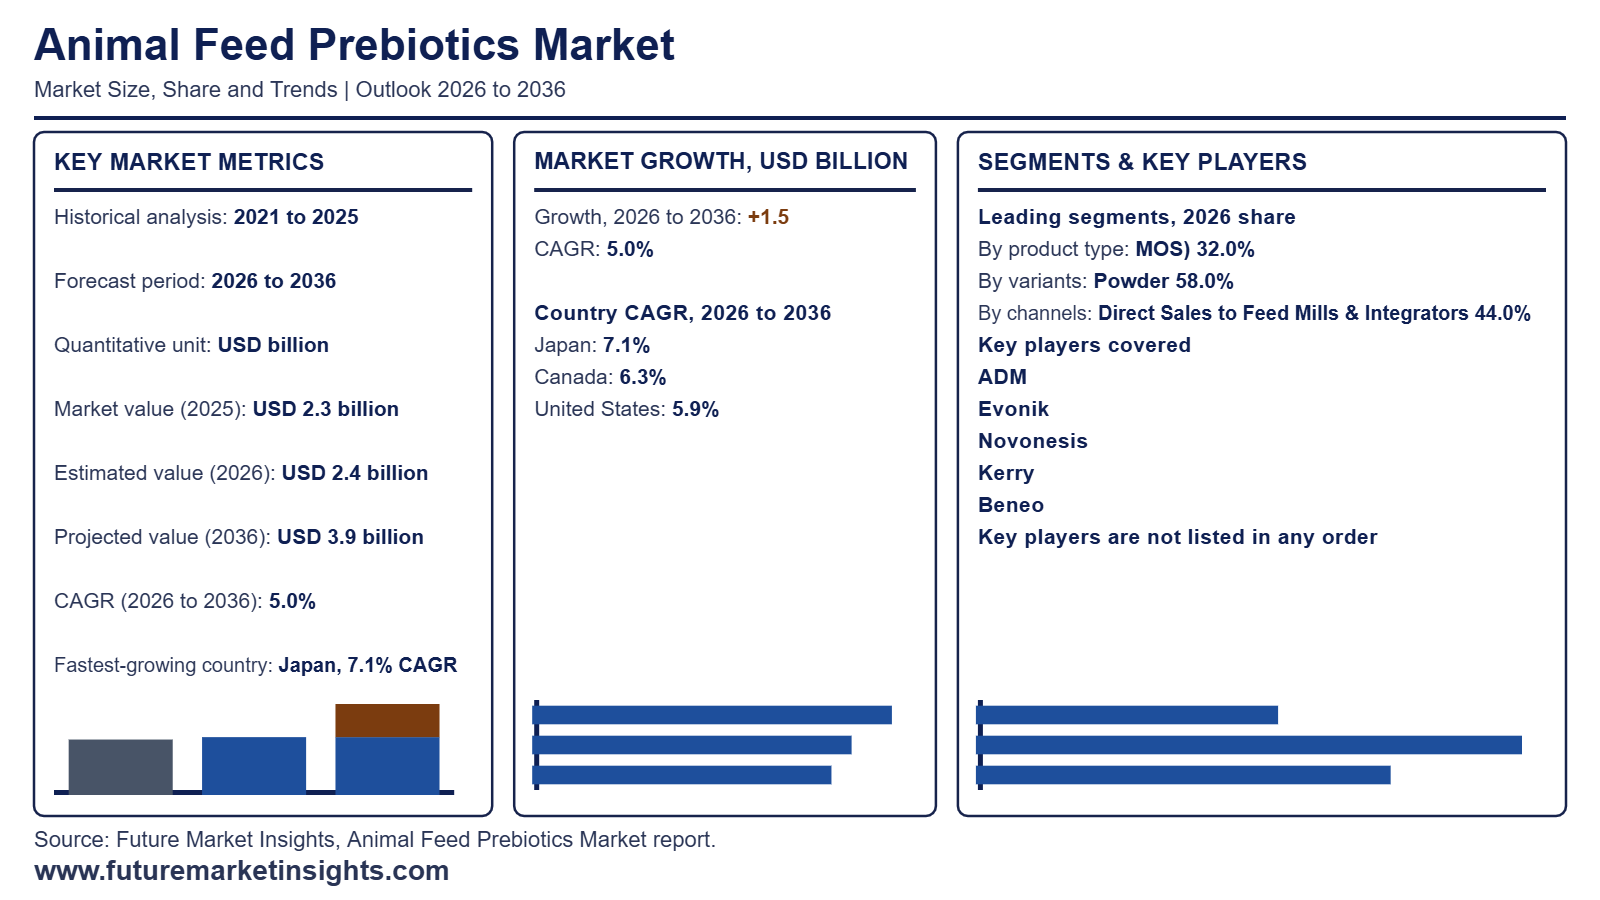
The global animal feed prebiotics market is valued at USD 2.41 billion in 2026, up from USD 2.30 billion in 2025. Future Market Insights (FMI) expects the market to reach USD 3.92 billion by 2036, growing at a 5.0% CAGR from 2026 to 2036 and adding USD 1.51 billion in revenue over the 10-year forecast period.
| Market Metric | Valuation / Share / Forecast Benchmark |
|---|---|
| 2025 Market Size (Historical) | USD 2.30 billion |
| 2026 Market Size (Estimated) | USD 2.41 billion |
| 2036 Market Size (Projected) | USD 3.92 billion |
| Compound Annual Growth Rate (2026 to 2036) | 5.0% CAGR |
| Incremental Dollar Opportunity (2026 to 2036) | USD 1.51 billion |
| Dominant Product Type (2026 to 2036 Share) | Mannan-Oligosaccharides (MOS) (32.0% in 2026, falling to 30.8% by 2036) |
| Leading & Fastest-Growing Variants | Powder (58.0% share in 2026; 4.7% CAGR) | Liquid (5.6% CAGR) |
| Leading & Fastest-Growing Channels | Direct Sales to Feed Mills & Integrators (44.0% share in 2026) | Farm Stores & Online (6.4% CAGR) |
| Largest Country Markets (2026 Global Share) | United States (20.0%), Brazil (8.0%), Germany (5.5%) |
| Fastest-Growing Country Markets (2026 to 2036) | Japan (7.1% CAGR), Canada (6.3% CAGR), United States (5.9% CAGR) |
| Leading Tier-1 Companies | ADM, Evonik, Novonesis, Kerry, Beneo |
Source: Future Market Insights analysis of the animal feed prebiotics market, 2026.
Executive Market Overview
Demand for animal feed prebiotics is likely to be driven by poultry and pig producers adding yeast cell wall and plant fiber for gut health, along with antibiotic-free programs. Mannan-oligosaccharides account for 32.0% of 2026 revenue, and feed mills and integrators that buy direct account for 44.0% of sales. The United States is expected to maintain its position as the largest market, because its broiler and pork integrators run large antibiotic-free programs. Also, Brazil and Germany are set to remain important markets by revenue. Japan is expected to grow at the fastest pace through 2036, ahead of Canada and the United States, as its July 2026 One Health surveillance report puts antimicrobial feed additive use above 200 tons yearly.
Feed prebiotics such as MOS come from yeast cell walls or plant fiber and feed helpful gut bacteria, which matters most in young pigs and calves raised without antibiotics. Ingredient makers are moving into beta-glucans and xylo-oligosaccharides, which sell for more per kilogram in piglet and calf starter diets and in aquaculture feeds. FMI expects xylo-oligosaccharides to grow at a 7.4% CAGR and beta-glucans at a 5.9% CAGR through 2036, ahead of the 5.0% overall market average. Mannan-oligosaccharides trail at a 4.6% CAGR. Market sizing covers non-digestible carbohydrate prebiotics sold as powders, liquids or granules for farm animal and aquaculture feed, along with pet food. Probiotics and postbiotics are excluded, as are enzymes, organic acids, whole yeast sold as protein and human prebiotic supplements.
Analyst Perspective
"Prebiotic revenue will grow faster than the tonnage fed, because producers pay extra for beta-glucan and xylo-oligosaccharide blends with trial data behind them. The main risk lies in the United States, where FDA reported in December 2025 that 2024 sales of medically important antimicrobials for food animals broke years of stable volumes."
Nandini Roy Choudhury, Principal Consultant, Future Market Insights (FMI)
Top Animal Feed Prebiotics Market Dynamics and Industry Trends
Demand for yeast-based prebiotics for higher milk production, maintain condition in high producers, and enhance digestibility.
Yeast-based prebiotics are beneficial for animal health, productivity, and overall performance. It supports enhanced metabolic health and maintains the gut microbiome and immune system. Yeast-based prebiotics are used as substitutes for antibiotics, Due to the regulations and restrictions on use of antibiotics in animal feed. The outstanding benefits of yeast-based prebiotics, manufacturers are focusing on developing yeast-based prebiotic products.
Alltech offers a yeast-based prebiotic added to animal feed. Yea-Sacc is a yeast-based prebiotic product of Saccharomyces it is ideal for dairy, beef, equine, and calf feeds. It boosts milk production, supports high productivity, improves digestion, promotes the digestion and utilization of nutrients, and enhances protein supply. Yea-Sacc helps to better digestion of fiber and boost the uptake of energy.
The use of prebiotics in animal feed as a substitute for antibiotics leads the prebiotics market.
Prebiotics are a non-digestible substance that enhance the growth of good bacteria in the animal's gut. For boosting the immune system and nutrient absorption animal prebiotics added in their diet. It resists disease-causing microbes in the animal digestive system. Improvements in animal husbandry practices and the emphasis on preventative healthcare in livestock production are driving the use of prebiotics in animal feed formulations.
Sustainable vitality and productivity in animals by Using natural ingredients in animal feed
Naturally sourced ingredients are a safe and effective solution for the development of various compound poultry feeds and specialty pre-starter concepts for very young chicks. They increase profitability and the bird's performance. Also, they contribute to sustainable nutrition by successfully supporting intestinal health and reducing dependency on synthetic feed ingredients.
A leading manufacturer in animal feed 'Beneo' developed 'BeneoCarb' which is a unique functional syrup with a low viscosity. Due to its low in ash, it is an economical, qualitative substitute to vegetal oils as feed dust binder or pellet binder. Furthermore, the slowly digestible carbohydrates enhance the bird's performance.
Comparison of Historical vs Forecast Outlook for Animal Feed Prebiotics Sales (2021 to 2025 vs 2026 to 2036)
From 2021 to 2025 in animal population and growing awareness regarding animal health have raised the demand for animal prebiotic feed additives. DSM contributes to the delivery of sustainable animal farming that respects animals, and the environment while meeting customer demand for volume, price, and margin that the farming community can meet by utilizing science and collaborating with customers.
Cargill adapts complex market forces regulations to change operations, by force to find new ways to maximize feed conversion and enhance animal performance more affordably, more efficiently, and more sustainably and ensures better nutrition for better lives. During this period, demand for nutritional feed for livestock and meat products fuelled the growth of this industry.
From 2026 to 2036, the prebiotics market has risen faster with innovations and advanced technology. The growing use of prebiotics in dairy cattle has raised the market. Prebiotics mannan oligosaccharides are complex mannose sugars that block the colonization of pathogens in the digestive tract.
Beta-galactosidase is used as an enzymatic process whey to create galactosyl-lactose, a trisaccharide. It has previously been discovered that adding GL to milk replacers improved the growth and general health of dairy calves.
The combination of technological advancements with smart feeding systems changes the way feeds are given, lessens waste, and uses productive growth rates by operating in real time. Optimizing feed technology with animal life stages and specifications enhances feed efficiency and productivity.
Market Concentration in the Animal Feed Prebiotics Sector
Tier 1 Companies are major players in the industry as they are established globally with holding majority shares of the market. Market leaders aiming at research and development for innovative solutions for enhance animal nutrition. They include Cargill and ADM, with their innovative feed solutions and differentiation in their products, which is the leading provider of sustainable nutrition and health solutions in animal nutrition.
Tier 2 Companies are the regional players with adequate market coverage and are known for offering niche products. They are typically more localized and address specific issues of more general ones. BENEO is an example of this, it is catering latest developments and trends in the animal nutrition industry. They are partnering with local partners to acquire niche product markets at the local level and contribute to serving innovative solutions.
Tier 3 Companies are minor players who are limited to the local or regional areas. They focus on service localized areas and do not possess the same level of R&D as bigger companies but they are strong at their target industries due to their deep-seated innovations and customer service. They are satisfying local consumer needs. Godrej Agrovet fulfills the local cattle nutrition needs in India with a research and customer-centric approach.
Analysis of Top Countries Using Prebiotic Feed Additives
The following table shows the estimated growth rates of the top three territories. China and Japan are set to represent high consumption.

| Countries | CAGR |
|---|---|
| USA | 5.9% |
| Canada | 6.3% |
| India | 5.2% |
| Japan | 7.1% |
| China | 6.1% |

Integration of advanced technologies and supportive government boosting prebiotics sales in China
Being the largest meat consumer in the world, china demands for high amount of meet. Prebiotics help in beef, pork, and poultry feed to enhance their overall growth. Prebiotics play a substitute role for antibiotics, so help in maintaining quality and required meat production. The government of China is supporting animal feed manufacturers to research and develop feed products and develop quality animal nutritional products.
Yihai Kerry Arawana Holdings Co., Ltd. is an important food products processing company in China, running its business based on the principles of correctness, and aiming at feed quality and animal welfare. They aim at the use of advanced technology and government-supportive policies for the best quality nutritional animal feed.
Demand Outlook in European Countries

Growing consciousness among European consumers about meat and dairy products they use minimal use of antibiotics and synthetic feed additives. Animal feed producers are aiming to develop quality and nutritional feed additives. Prebiotics are the prominent substitute for antibiotics.
Also, it is manufactured from natural ingredients. It helps to increase the microbiome in the animal gut and support nutrient absorption. It ensures high-quality dairy and meat production while meeting consumer demand.
Land O'Lakes is key manufacture in animal nutrition for high-quality feed, are developing new products and a rise in sales in probiotic categories within the animal feed industry. This products are catering to immune support, antioxidant optimization to cognitive function.
Focus on the Production of nutritional feed for dairy cattle to enhance milk production in India.
India contributing 24% of global milk production by the report, the Ministry of Animal Husbandry & Dairying. Growing awareness about animal health and increased productivity of dairy cattle Indian animal milk producers anticipate for high-quality feed additives to meet the nutritional needs of dairy cattle.
Prebiotics support to increase of good bacteria in the animal gut and absorption of nutrients. This leads to, efficient nutrient utilization and produces higher milk production.
Alltech, a leading manufacturer of animal feed introduces a product 'Yea-Sacc' to increase the ability of milk production of dairy cattle. Yea-Sacc helps to improve rumen by stabilizing the pH of the rumen and improving the digestibility of the ration. This makes it possible to produce more milk more effectively without sacrificing the dairy cow's health or fertility.
Animal Feed Prebiotics Industry Analysis by Top Investment Segments
Manufacturers Focus on animal feed prebiotics segment for Higher Sales
| Segment | Animal Feed - Ruminants |
|---|---|
| Value Share (2026) | 23.5% |
A leading producer of animal feed Beneo, specializes in their prebiotic products according to animal type like as Poultry feed, Swine feed, Ruminants feed, and pet feed. BENEO provides plant-based functional additives for animal feed that enhance the technical and nutritional qualities without sacrificing flavor or texture.
They provide clients with the foundation for innovative product concepts and prosperous product launches through a special chain of expertise. Their cutting-edge production facilities across the globe guarantee consistently high-quality, sustainably sourced ingredients. As the global population keeps growing the demand for dairy products and meat.
Kemin's aim at raising healthy cattle and poultry is more vital than ever, and we are committed to providing our customers with products and services that maximize their profitability while assisting consumers in achieving optimal nutrition, feed quality, gut health, and disease management.
New improvements in the feed will improve the nutritional and digestibility levels of the different feeds offered to the animals. A good example of this is Alltech, which advances its products through research and provides feeds that improve animal's immunity and overall performance. These technology initiatives are very important in satisfying the increased demand for prebiotic products as a results of, animal Feed Prebiotics sector growth.
Rising demand for dairy and meat products Leading to Innovative Solutions

| Segment | Gut Health (By Functionality) |
|---|---|
| Value Share (2026) | 27% |
A prebiotic is a substrate that offers health benefits to host microorganisms by being specifically used by them. For the health benefit of the pet, prebiotics are the preferred diet of the good bacteria that are already present in our bodies, whether in the gut or elsewhere. They aid in the growth and multiplication of these bacteria.
Prebiotics added to animal feed will help the good bacteria that are already there to develop selectively in the gut, adding to the ecosystem of the gut and improving overall health. It supports nourishment and improves nutrient absorption in the animal's intestines. Prebiotics improve the immunity, growth, and production of animals.
Utilized for dairy production and other agricultural uses, cattle represent a significant application area in the global animal feed market. The growing market for beef products from nations like China will spur industry expansion. There are multiple microbial communities at the dairy farm Lallemand Animal Nutrition.
Everywhere from the cow's rumen to the fodder supports native microbiota. The health, happiness, and productivity of herds depend on these ecosystems remaining in balance. Producers may maximize performance, quality, and safety while supporting sustainable dairy production by regulating these microbial communities.
Cattle is a major application segment in the global animal feed market, as it is used for dairy production and other agricultural purposes. Increasing demand for beef products from countries such as China will boost industry growth. "DSM" continuously focuses on scientific research, and technological advancements, and builds an international network.
The prebiotic products offered by DSM's animal nutrition division include those sold under the "Nutrivance" brand. These items are to enhance feed efficiency and promote intestinal health. They have an edge in the prebiotics market for their sustainability and focus on creating evidence-based solutions.
Competitive Outlook in the Animal Feed Prebiotics Market

The competition landscape of the Animal Feed Prebiotics market is intense. Due to the increase in the animal population and growing awareness regarding animal health market growth has risen. Prebiotics are used in animal feed to increase feed efficiency and offer resistance against bacteria.
They help grow gut bacteria, improving digestion and nutrition of animals. Cargill, beneo, and Alltech are the major market players and constantly aiming at R&D and creating innovative sustainable solutions for animal feed. Major market players are aiming at developing quality animal feed prebiotics products to enhance animal gut health, nutrition, immunity, and overall performance.
Manufacturers are adopting a variety of tactics, such as strategic and vertical acquisitions, to increase their sales. Beneo, for example, was able to grow its market share by acquiring smaller feed companies and integrating them into its distribution network, guaranteeing raw material quality and availability.
Godrej Agrovet strategically targeted local aquaculture producers, in addition to local consumers to regionalize their distribution and ultimately seize market share.
Leading Animal Feed Prebiotics Brands by Market Share
- ADM
- Evonik
- DSM
- Kerry
- Novonesis
- Cargill
- Orffa International Holding B.V.
- Alltech
- Lallemand
- Kemin
- Provita
- BASF SE
- Novus International Inc.
- Land Lakes Inc.
- beghin meiji s.a.
- Biochem
- Adisseo
- Beneo
Scope of the Report

| Metric | Value |
|---|---|
| Quantitative Units | USD 2,407.86 Million to USD 3,922.15 Million, at a CAGR of 5.0% |
| Market Definition | Animal feed prebiotics are non-digestible carbohydrate substrates added to livestock feed that selectively promote the growth and metabolic activity of beneficial gut microorganisms. These ingredients include fructooligosaccharides (FOS), mannan-oligosaccharides (MOS), galactooligosaccharides (GOS), and inulin, serving gut health, growth promotion, and immune function objectives across commercial livestock species. |
| Form Segmentation | Powder, Liquid |
| Function Segmentation | Gut Health, Growth, Immunity |
| Regions Covered | North America, Latin America, Europe, East Asia, South Asia, Oceania, Middle East & Africa |
| Countries Covered | Japan, Canada, China, USA, India, and 40 plus countries |
| Key Companies Profiled | ADM, Evonik, DSM, Kerry, Novonesis, Cargill, Orffa International Holding B.V., Alltech, Lallemand, Kemin, Provita, BASF SE, Novus International Inc., Land O'Lakes Inc., Beghin Meiji S.A., Biochem, Adisseo, Beneo |
| Forecast Period | 2026 to 2036 |
| Approach | Hybrid top-down and bottom-up modelling anchored by primary interviews and public data benchmarking |
Top Investment Segments Studied in the Animal Feed Prebiotics Market
By Form:
As per by Form, the industry has been categorized into Powder and Liquid.
By Source:
As per Source, the industry has been categorized into Oligosaccharides, Galactooligosaccharides, Inulin, Beta-Glucans, Lactulose and Xylo Oligosaccharides
By Function:
This segment is further categorized into Gut Health, Growth, Immunity.
By Sales Channel:
As per sales channel, Direct Sale, Online retail, Speciality Stores, Retail Pharmacies and Veterinary Hospitals.
By Region:
Industry analysis has been carried out in key countries of North America, Latin America, Europe, East Asia, South Asia, Oceania, and the Middle East & Africa.
Bibliography
- AMR One Health Surveillance Committee. (2026, July 10). Nippon AMR One Health Report (NAOR) 2025.
- Foods. (2026, May 25). Impact of Functional Feed Additives and Lower Antibiotic Use on Poultry Meat Quality and Consumer Perception.
- U.S. Food and Drug Administration. (2025, December 5). FDA Releases Annual Summary of Sales and Distribution of Antimicrobials in 2024 for Use in Food-Producing Animals.
- USDA Foreign Agricultural Service. (2025, September 29). Poultry and Products Annual: Brazil.
- Veterinarni Medicina. (2025, December 19). Impact of prebiotic supplementation on the zootechnical and health performance in broiler chickens.
Table of Content
- Executive Summary
- Global Market Outlook
- Demand-side Trends
- Supply-side Trends
- Technology Roadmap Analysis
- Analysis and Recommendations
- Market Overview
- Market Coverage / Taxonomy
- Market Definition / Scope / Limitations
Read More...
- Research Methodology
- Chapter Orientation
- Analytical Lens and Working Hypotheses
- Market Structure, Signals, and Trend Drivers
- Benchmarking and Cross-market Comparability
- Market Sizing, Forecasting, and Opportunity Mapping
- Research Design and Evidence Framework
- Desk Research Programme (Secondary Evidence)
- Company Annual and Sustainability Reports
- Peer-reviewed Journals and Academic Literature
- Corporate Websites, Product Literature, and Technical Notes
- Earnings Decks and Investor Briefings
- Statutory Filings and Regulatory Disclosures
- Technical White Papers and Standards Notes
- Trade Journals, Industry Magazines, and Analyst Briefs
- Conference Proceedings, Webinars, and Seminar Materials
- Government Statistics Portals and Public Data Releases
- Press Releases and Reputable Media Coverage
- Specialist Newsletters and Curated Briefings
- Sector Databases and Reference Repositories
- FMI Internal Proprietary Databases and Historical Market Datasets
- Subscription Datasets and Paid Sources
- Social Channels, Communities, and Digital Listening Inputs
- Additional Desk Sources
- Expert Input and Fieldwork (Primary Evidence)
- Primary Modes
- Qualitative Interviews and Expert Elicitation
- Quantitative Surveys and Structured Data Capture
- Blended Approach
- Why Primary Evidence is Used
- Field Techniques
- Interviews
- Surveys
- Focus Groups
- Observational and In-context Research
- Social and Community Interactions
- Stakeholder Universe Engaged
- C-suite Leaders
- Board Members
- Presidents and Vice Presidents
- R&D and Innovation Heads
- Technical Specialists
- Domain Subject-matter Experts
- Scientists
- Physicians and Other Healthcare Professionals
- Governance, Ethics, and Data Stewardship
- Research Ethics
- Data Integrity and Handling
- Primary Modes
- Tooling, Models, and Reference Databases
- Desk Research Programme (Secondary Evidence)
- Data Engineering and Model Build
- Data Acquisition and Ingestion
- Cleaning, Normalisation, and Verification
- Synthesis, Triangulation, and Analysis
- Quality Assurance and Audit Trail
- Market Background
- Market Dynamics
- Drivers
- Restraints
- Opportunity
- Trends
- Scenario Forecast
- Demand in Optimistic Scenario
- Demand in Likely Scenario
- Demand in Conservative Scenario
- Opportunity Map Analysis
- Product Life Cycle Analysis
- Supply Chain Analysis
- Investment Feasibility Matrix
- Value Chain Analysis
- PESTLE and Porter’s Analysis
- Regulatory Landscape
- Regional Parent Market Outlook
- Production and Consumption Statistics
- Import and Export Statistics
- Market Dynamics
- Global Market Analysis 2021 to 2025 and Forecast, 2026 to 2036
- Historical Market Size Value (USD Million) Analysis, 2021 to 2025
- Current and Future Market Size Value (USD Million) Projections, 2026 to 2036
- Y-o-Y Growth Trend Analysis
- Absolute $ Opportunity Analysis
- Global Market Pricing Analysis 2021 to 2025 and Forecast 2026 to 2036
- Global Market Analysis 2021 to 2025 and Forecast 2026 to 2036, By Form
- Introduction / Key Findings
- Historical Market Size Value (USD Million) Analysis By Form , 2021 to 2025
- Current and Future Market Size Value (USD Million) Analysis and Forecast By Form , 2026 to 2036
- Powder
- Liquid
- Powder
- Y-o-Y Growth Trend Analysis By Form , 2021 to 2025
- Absolute $ Opportunity Analysis By Form , 2026 to 2036
- Global Market Analysis 2021 to 2025 and Forecast 2026 to 2036, By Function
- Introduction / Key Findings
- Historical Market Size Value (USD Million) Analysis By Function, 2021 to 2025
- Current and Future Market Size Value (USD Million) Analysis and Forecast By Function, 2026 to 2036
- Gut Health
- Growth
- Immunity
- Gut Health
- Y-o-Y Growth Trend Analysis By Function, 2021 to 2025
- Absolute $ Opportunity Analysis By Function, 2026 to 2036
- Global Market Analysis 2021 to 2025 and Forecast 2026 to 2036, By Region
- Introduction
- Historical Market Size Value (USD Million) Analysis By Region, 2021 to 2025
- Current Market Size Value (USD Million) Analysis and Forecast By Region, 2026 to 2036
- North America
- Latin America
- Western Europe
- Eastern Europe
- East Asia
- South Asia and Pacific
- Middle East & Africa
- Market Attractiveness Analysis By Region
- North America Market Analysis 2021 to 2025 and Forecast 2026 to 2036, By Country
- Historical Market Size Value (USD Million) Trend Analysis By Market Taxonomy, 2021 to 2025
- Market Size Value (USD Million) Forecast By Market Taxonomy, 2026 to 2036
- By Country
- USA
- Canada
- Mexico
- By Form
- By Function
- By Country
- Market Attractiveness Analysis
- By Country
- By Form
- By Function
- Key Takeaways
- Latin America Market Analysis 2021 to 2025 and Forecast 2026 to 2036, By Country
- Historical Market Size Value (USD Million) Trend Analysis By Market Taxonomy, 2021 to 2025
- Market Size Value (USD Million) Forecast By Market Taxonomy, 2026 to 2036
- By Country
- Brazil
- Chile
- Rest of Latin America
- By Form
- By Function
- By Country
- Market Attractiveness Analysis
- By Country
- By Form
- By Function
- Key Takeaways
- Western Europe Market Analysis 2021 to 2025 and Forecast 2026 to 2036, By Country
- Historical Market Size Value (USD Million) Trend Analysis By Market Taxonomy, 2021 to 2025
- Market Size Value (USD Million) Forecast By Market Taxonomy, 2026 to 2036
- By Country
- Germany
- UK
- Italy
- Spain
- France
- Nordic
- BENELUX
- Rest of Western Europe
- By Form
- By Function
- By Country
- Market Attractiveness Analysis
- By Country
- By Form
- By Function
- Key Takeaways
- Eastern Europe Market Analysis 2021 to 2025 and Forecast 2026 to 2036, By Country
- Historical Market Size Value (USD Million) Trend Analysis By Market Taxonomy, 2021 to 2025
- Market Size Value (USD Million) Forecast By Market Taxonomy, 2026 to 2036
- By Country
- Russia
- Poland
- Hungary
- Balkan & Baltic
- Rest of Eastern Europe
- By Form
- By Function
- By Country
- Market Attractiveness Analysis
- By Country
- By Form
- By Function
- Key Takeaways
- East Asia Market Analysis 2021 to 2025 and Forecast 2026 to 2036, By Country
- Historical Market Size Value (USD Million) Trend Analysis By Market Taxonomy, 2021 to 2025
- Market Size Value (USD Million) Forecast By Market Taxonomy, 2026 to 2036
- By Country
- China
- Japan
- South Korea
- By Form
- By Function
- By Country
- Market Attractiveness Analysis
- By Country
- By Form
- By Function
- Key Takeaways
- South Asia and Pacific Market Analysis 2021 to 2025 and Forecast 2026 to 2036, By Country
- Historical Market Size Value (USD Million) Trend Analysis By Market Taxonomy, 2021 to 2025
- Market Size Value (USD Million) Forecast By Market Taxonomy, 2026 to 2036
- By Country
- India
- ASEAN
- Australia & New Zealand
- Rest of South Asia and Pacific
- By Form
- By Function
- By Country
- Market Attractiveness Analysis
- By Country
- By Form
- By Function
- Key Takeaways
- Middle East & Africa Market Analysis 2021 to 2025 and Forecast 2026 to 2036, By Country
- Historical Market Size Value (USD Million) Trend Analysis By Market Taxonomy, 2021 to 2025
- Market Size Value (USD Million) Forecast By Market Taxonomy, 2026 to 2036
- By Country
- Kingdom of Saudi Arabia
- Other GCC Countries
- Turkiye
- South Africa
- Other African Union
- Rest of Middle East & Africa
- By Form
- By Function
- By Country
- Market Attractiveness Analysis
- By Country
- By Form
- By Function
- Key Takeaways
- Key Countries Market Analysis
- USA
- Pricing Analysis
- Market Share Analysis, 2025
- By Form
- By Function
- Canada
- Pricing Analysis
- Market Share Analysis, 2025
- By Form
- By Function
- Mexico
- Pricing Analysis
- Market Share Analysis, 2025
- By Form
- By Function
- Brazil
- Pricing Analysis
- Market Share Analysis, 2025
- By Form
- By Function
- Chile
- Pricing Analysis
- Market Share Analysis, 2025
- By Form
- By Function
- Germany
- Pricing Analysis
- Market Share Analysis, 2025
- By Form
- By Function
- UK
- Pricing Analysis
- Market Share Analysis, 2025
- By Form
- By Function
- Italy
- Pricing Analysis
- Market Share Analysis, 2025
- By Form
- By Function
- Spain
- Pricing Analysis
- Market Share Analysis, 2025
- By Form
- By Function
- France
- Pricing Analysis
- Market Share Analysis, 2025
- By Form
- By Function
- India
- Pricing Analysis
- Market Share Analysis, 2025
- By Form
- By Function
- ASEAN
- Pricing Analysis
- Market Share Analysis, 2025
- By Form
- By Function
- Australia & New Zealand
- Pricing Analysis
- Market Share Analysis, 2025
- By Form
- By Function
- China
- Pricing Analysis
- Market Share Analysis, 2025
- By Form
- By Function
- Japan
- Pricing Analysis
- Market Share Analysis, 2025
- By Form
- By Function
- South Korea
- Pricing Analysis
- Market Share Analysis, 2025
- By Form
- By Function
- Russia
- Pricing Analysis
- Market Share Analysis, 2025
- By Form
- By Function
- Poland
- Pricing Analysis
- Market Share Analysis, 2025
- By Form
- By Function
- Hungary
- Pricing Analysis
- Market Share Analysis, 2025
- By Form
- By Function
- Kingdom of Saudi Arabia
- Pricing Analysis
- Market Share Analysis, 2025
- By Form
- By Function
- Turkiye
- Pricing Analysis
- Market Share Analysis, 2025
- By Form
- By Function
- South Africa
- Pricing Analysis
- Market Share Analysis, 2025
- By Form
- By Function
- USA
- Market Structure Analysis
- Competition Dashboard
- Competition Benchmarking
- Market Share Analysis of Top Players
- By Regional
- By Form
- By Function
- Competition Analysis
- Competition Deep Dive
- ADM
- Overview
- Product Portfolio
- Profitability by Market Segments (Product/Age /Sales Channel/Region)
- Sales Footprint
- Strategy Overview
- Marketing Strategy
- Product Strategy
- Channel Strategy
- Evonik
- DSM
- Kerry
- Novonesis
- Cargill
- Orffa International Holding B.V.
- Alltech
- Lallemand
- Kemin
- Provita
- BASF SE
- Novus International Inc.
- Land Lakes Inc.
- beghin meiji s.a.
- Biochem
- Adisseo
- Beneo
- ADM
- Competition Deep Dive
- Assumptions & Acronyms Used
List of Tables
- Table 1: Global Market Value (USD Million) Forecast by Region, 2021 to 2036
- Table 2: Global Market Value (USD Million) Forecast by Form , 2021 to 2036
- Table 3: Global Market Value (USD Million) Forecast by Function, 2021 to 2036
- Table 4: North America Market Value (USD Million) Forecast by Country, 2021 to 2036
- Table 5: North America Market Value (USD Million) Forecast by Form , 2021 to 2036
- Table 6: North America Market Value (USD Million) Forecast by Function, 2021 to 2036
- Table 7: Latin America Market Value (USD Million) Forecast by Country, 2021 to 2036
- Table 8: Latin America Market Value (USD Million) Forecast by Form , 2021 to 2036
- Table 9: Latin America Market Value (USD Million) Forecast by Function, 2021 to 2036
- Table 10: Western Europe Market Value (USD Million) Forecast by Country, 2021 to 2036
- Table 11: Western Europe Market Value (USD Million) Forecast by Form , 2021 to 2036
- Table 12: Western Europe Market Value (USD Million) Forecast by Function, 2021 to 2036
- Table 13: Eastern Europe Market Value (USD Million) Forecast by Country, 2021 to 2036
- Table 14: Eastern Europe Market Value (USD Million) Forecast by Form , 2021 to 2036
- Table 15: Eastern Europe Market Value (USD Million) Forecast by Function, 2021 to 2036
- Table 16: East Asia Market Value (USD Million) Forecast by Country, 2021 to 2036
- Table 17: East Asia Market Value (USD Million) Forecast by Form , 2021 to 2036
- Table 18: East Asia Market Value (USD Million) Forecast by Function, 2021 to 2036
- Table 19: South Asia and Pacific Market Value (USD Million) Forecast by Country, 2021 to 2036
- Table 20: South Asia and Pacific Market Value (USD Million) Forecast by Form , 2021 to 2036
- Table 21: South Asia and Pacific Market Value (USD Million) Forecast by Function, 2021 to 2036
- Table 22: Middle East & Africa Market Value (USD Million) Forecast by Country, 2021 to 2036
- Table 23: Middle East & Africa Market Value (USD Million) Forecast by Form , 2021 to 2036
- Table 24: Middle East & Africa Market Value (USD Million) Forecast by Function, 2021 to 2036
List of Figures
- Figure 1: Global Market Pricing Analysis
- Figure 2: Global Market Value (USD Million) Forecast 2021-2036
- Figure 3: Global Market Value Share and BPS Analysis by Form , 2026 and 2036
- Figure 4: Global Market Y-o-Y Growth Comparison by Form , 2026-2036
- Figure 5: Global Market Attractiveness Analysis by Form
- Figure 6: Global Market Value Share and BPS Analysis by Function, 2026 and 2036
- Figure 7: Global Market Y-o-Y Growth Comparison by Function, 2026-2036
- Figure 8: Global Market Attractiveness Analysis by Function
- Figure 9: Global Market Value (USD Million) Share and BPS Analysis by Region, 2026 and 2036
- Figure 10: Global Market Y-o-Y Growth Comparison by Region, 2026-2036
- Figure 11: Global Market Attractiveness Analysis by Region
- Figure 12: North America Market Incremental Dollar Opportunity, 2026-2036
- Figure 13: Latin America Market Incremental Dollar Opportunity, 2026-2036
- Figure 14: Western Europe Market Incremental Dollar Opportunity, 2026-2036
- Figure 15: Eastern Europe Market Incremental Dollar Opportunity, 2026-2036
- Figure 16: East Asia Market Incremental Dollar Opportunity, 2026-2036
- Figure 17: South Asia and Pacific Market Incremental Dollar Opportunity, 2026-2036
- Figure 18: Middle East & Africa Market Incremental Dollar Opportunity, 2026-2036
- Figure 19: North America Market Value Share and BPS Analysis by Country, 2026 and 2036
- Figure 20: North America Market Value Share and BPS Analysis by Form , 2026 and 2036
- Figure 21: North America Market Y-o-Y Growth Comparison by Form , 2026-2036
- Figure 22: North America Market Attractiveness Analysis by Form
- Figure 23: North America Market Value Share and BPS Analysis by Function, 2026 and 2036
- Figure 24: North America Market Y-o-Y Growth Comparison by Function, 2026-2036
- Figure 25: North America Market Attractiveness Analysis by Function
- Figure 26: Latin America Market Value Share and BPS Analysis by Country, 2026 and 2036
- Figure 27: Latin America Market Value Share and BPS Analysis by Form , 2026 and 2036
- Figure 28: Latin America Market Y-o-Y Growth Comparison by Form , 2026-2036
- Figure 29: Latin America Market Attractiveness Analysis by Form
- Figure 30: Latin America Market Value Share and BPS Analysis by Function, 2026 and 2036
- Figure 31: Latin America Market Y-o-Y Growth Comparison by Function, 2026-2036
- Figure 32: Latin America Market Attractiveness Analysis by Function
- Figure 33: Western Europe Market Value Share and BPS Analysis by Country, 2026 and 2036
- Figure 34: Western Europe Market Value Share and BPS Analysis by Form , 2026 and 2036
- Figure 35: Western Europe Market Y-o-Y Growth Comparison by Form , 2026-2036
- Figure 36: Western Europe Market Attractiveness Analysis by Form
- Figure 37: Western Europe Market Value Share and BPS Analysis by Function, 2026 and 2036
- Figure 38: Western Europe Market Y-o-Y Growth Comparison by Function, 2026-2036
- Figure 39: Western Europe Market Attractiveness Analysis by Function
- Figure 40: Eastern Europe Market Value Share and BPS Analysis by Country, 2026 and 2036
- Figure 41: Eastern Europe Market Value Share and BPS Analysis by Form , 2026 and 2036
- Figure 42: Eastern Europe Market Y-o-Y Growth Comparison by Form , 2026-2036
- Figure 43: Eastern Europe Market Attractiveness Analysis by Form
- Figure 44: Eastern Europe Market Value Share and BPS Analysis by Function, 2026 and 2036
- Figure 45: Eastern Europe Market Y-o-Y Growth Comparison by Function, 2026-2036
- Figure 46: Eastern Europe Market Attractiveness Analysis by Function
- Figure 47: East Asia Market Value Share and BPS Analysis by Country, 2026 and 2036
- Figure 48: East Asia Market Value Share and BPS Analysis by Form , 2026 and 2036
- Figure 49: East Asia Market Y-o-Y Growth Comparison by Form , 2026-2036
- Figure 50: East Asia Market Attractiveness Analysis by Form
- Figure 51: East Asia Market Value Share and BPS Analysis by Function, 2026 and 2036
- Figure 52: East Asia Market Y-o-Y Growth Comparison by Function, 2026-2036
- Figure 53: East Asia Market Attractiveness Analysis by Function
- Figure 54: South Asia and Pacific Market Value Share and BPS Analysis by Country, 2026 and 2036
- Figure 55: South Asia and Pacific Market Value Share and BPS Analysis by Form , 2026 and 2036
- Figure 56: South Asia and Pacific Market Y-o-Y Growth Comparison by Form , 2026-2036
- Figure 57: South Asia and Pacific Market Attractiveness Analysis by Form
- Figure 58: South Asia and Pacific Market Value Share and BPS Analysis by Function, 2026 and 2036
- Figure 59: South Asia and Pacific Market Y-o-Y Growth Comparison by Function, 2026-2036
- Figure 60: South Asia and Pacific Market Attractiveness Analysis by Function
- Figure 61: Middle East & Africa Market Value Share and BPS Analysis by Country, 2026 and 2036
- Figure 62: Middle East & Africa Market Value Share and BPS Analysis by Form , 2026 and 2036
- Figure 63: Middle East & Africa Market Y-o-Y Growth Comparison by Form , 2026-2036
- Figure 64: Middle East & Africa Market Attractiveness Analysis by Form
- Figure 65: Middle East & Africa Market Value Share and BPS Analysis by Function, 2026 and 2036
- Figure 66: Middle East & Africa Market Y-o-Y Growth Comparison by Function, 2026-2036
- Figure 67: Middle East & Africa Market Attractiveness Analysis by Function
- Figure 68: Global Market - Tier Structure Analysis
- Figure 69: Global Market - Company Share Analysis
Frequently Asked Questions
How big is the animal feed prebiotics market in 2026?
Future Market Insights estimates the global animal feed prebiotics market at USD 2.41 billion in 2026, up from USD 2.30 billion in 2025.
How fast is the animal feed prebiotics market expected to grow through 2036?
FMI projects a 5.0% CAGR from 2026 to 2036, taking the global animal feed prebiotics market to USD 3.92 billion by 2036 and generating USD 1.51 billion in incremental revenue.
Which product type leads the animal feed prebiotics market?
Mannan-oligosaccharides lead with 32.0% of 2026 revenue, and their global revenue share is projected to ease to 30.8% by 2036 as beta-glucans and xylo-oligosaccharides gain share.
Which variant leads the animal feed prebiotics market?
Powder prebiotics hold 58.0% of 2026 revenue (expanding at a 4.7% CAGR), while liquid prebiotics are projected to grow fastest at 5.6% per year, followed by granulated and microgranulated prebiotics at 5.1%.
Which distribution channel leads the animal feed prebiotics market?
Direct sales to feed mills and integrators account for 44.0% of 2026 sales, whereas farm stores and online sellers are expected to grow fastest at 6.4% per year from 2026 to 2036.
Which country is the largest animal feed prebiotics market?
The United States leads the animal feed prebiotics market, capturing 20.0% of global revenue in 2026 (USD 481.6 million), followed by Brazil at 8.0% (USD 192.6 million) and Germany at 5.5% (USD 132.4 million).
Which countries are expected to grow fastest in the animal feed prebiotics market?
Japan and Canada are projected to grow fastest, expanding at 7.1% and 6.3% CAGRs from 2026 to 2036, followed by the United States at 5.9%.
What drives demand for animal feed prebiotics?
Demand for animal feed prebiotics rests on gut health programs in poultry and pigs, supported by trials such as a December 2025 broiler study that linked yeast-based mannan-oligosaccharides to better feed conversion.
Preview the report firsthand - request a free sample
Get SampleGet the brochure for pricing and purchase details.
Get PDF
