Feed Attractants Market Size, Share, and Forecast Outlook 2025 to 2035

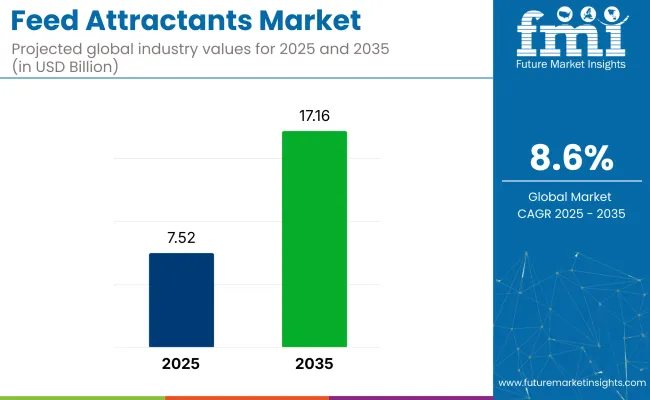
Feed attractants revenue is expected to climb from USD 7.52 billion in 2025 to USD 17.16 billion by 2035, corresponding to an 8.6% CAGR across the period.
Quick Stats for Feed Attractants Market

  • Market value (2025): USD 7.52 billion
  • Forecast value (2035): USD 17.16 billion
  • Forecast CAGR (2025 - 2035): 8.6%
  • Leading segment in 2035: Behaviour-modification functionality (≈ 50 % share)
  • Key growth region: Asia Pacific
  • Leading country: India (10.2% CAGR)
  • Key players: Monster Meal; Tucker Milling; Innovad; 4S Advanced Wildlife Solutions; Double Down Deer Feed; Merton Feed Company, LLC

Feed Attractants Market

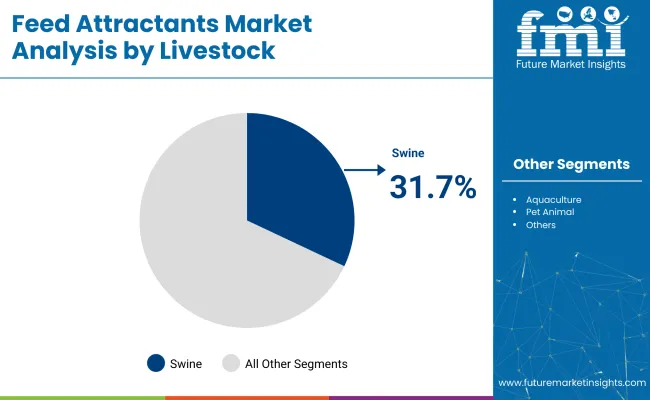
Demand has been driven by the pursuit of higher feed‐conversion efficiency and palatability improvement in intensive production systems. Swine dietsareprojected to hold 31.7% share in 2025 and have relied on refined flavor-enhancing compounds to counter weaning stress and preserve growth rates under antibiotic-reduction mandates.

Organic compounds are anticipated to command 45% share, their inclusion being favoured for recognised safety profiles, uniform dispersion, and broad compatibility with amino-acid matrices.

Bulk packaging is expected to retain 54.2% share, reflecting volume movement through compound-feed manufacturers. Retail sales are projected to account for 40% of distribution, supported by small-holder and game-management demand for farm-store pack sizes.

Production is scaled through modular spray-drying and encapsulation lines capable of delivering uniform particle sizes for premix integration. Formulation flexibility has been maintained by blending carbohydrate carriers with organic acids, nucleotides, and botanical extracts, ensuring target flavour profiles without compromising nutrient density. Constant developments keep the industry active.

Phileo by Lesaffre launched its Aquasaf Shrimpprogramme in April 2024, bundling yeast probiotics, postbiotics and attractant peptides with on-farm guidance; three pillars target gut integrity, immune resilience and fishmeal substitution, ensuring feed intake and profitability amid intensifying Asian shrimp production and exports.

The feed attractants market holds specific shares within its parent markets. In the animal feed additives market, it accounts for around 4-6%, as attractants are a key part of the additives used to enhance feed consumption. Within the animal nutrition market, the share is approximately 3-5%, driven by the need for products that improve animal feed intake and digestion. In the livestock farming market, feed attractants contribute about 2-4%, optimizing feed efficiency and performance.

The aquaculture feed market holds a share of 5-7%, with attractants being crucial for enhancing the palatability of aquatic animal feeds. The pet food market contributes around 4-6%, as attractants are used for improving the appeal of pet food.

Analysis of Feed Attractants Market by Top Investment Segments

Investment across 2025 targets swine-specific attractants, bulk packaging formats, organic compound blends, behavior-modification functionalities, and retail-oriented distribution. Each focus area supports precise intake control, efficient freight handling, residue-free labeling, feed-conversion optimization, and small-holder accessibility across global livestock production networks.

Swine Producers Embrace Palatability-Focused Attractant Strategies

Swine formulations hold 31.7% share, as nursery and grow-finish diets require reliable intake stimulation under confined housing conditions.
  • Branched-chain amino acids mask soybean-meal bitterness, improving post-weaning feed acceptance during immunity-sensitive stages
  • Encapsulated aroma esters survive 85 °C conditioning, releasing olfactory cues only after pellet cooling in bins
  • Sweetener-acid pairs balance taste thresholds, preventing ration sorting while supporting uniform daily weight gain patterns.
  • Sodium-based flavor carriers promote water intake synergy, reducing constipation incidents in high-density barns.
  • RFID-linked feeders record attractant consumption, generating data that refine phase-feeding matrices in precision-nutrition software.

Feed Attractants Market By Live Stock

Bulk Packaging Optimizes Supply Chain Cost Containment Programs

A 54.2% share has been possessed by bulk packaging in 2025, owing to mill-direct deliveries benefit from reduced unit costs and streamlined material handling at large integrator sites.

  • One-ton FIBC bags with food-grade liners cut plastic pail usage, trimming disposal fees at feed mills.
  • Corner-loop designs enable single-operator forklift movement, accelerating raw-material staging during three-shift production schedules.
  • Anti-static coatings mitigate ignition risk when powders flow into pneumatic conveyors charging mash mixers.
  • Barcode patches integrate with ERP scanners, ensuring batch traceability within Hazard Analysis Critical Control Point frameworks.
  • Moisture-barrier films maintain attractant potency for six months under 25 °C warehouse conditions, limiting potency drift.

Organic Compound Formulations Enhance Regulatory Compliance Assurance

A share of 45% is accounted for by organic compound attractants in 2025, as synthetic-free declarations satisfy retailer audits and export certificates in antibiotic-reduction programs

  • Fermented beet extract delivers volatile aldehydes that stimulate olfaction without solvent residues flagged by residue-monitoring plans
  • Esterified essential-oil fractions remain stable through steam-pelleting, having aroma intensity during extended storage
  • Citric-acid buffering lowers final ration pH, curbing pathogenic growth while avoiding medicated-feed classifications.
  • Allergen-free carrier matrices, based on rice hull fiber, prevent cross-contact with gluten-containing premixes in shared plants.
  • Carbon-neutral sourcing claims are validated via third-party life-cycle assessments, supporting eco-label placement on premium feeds.

Behavior Modification Drives Consistent Feed Intake Uniformity Targets

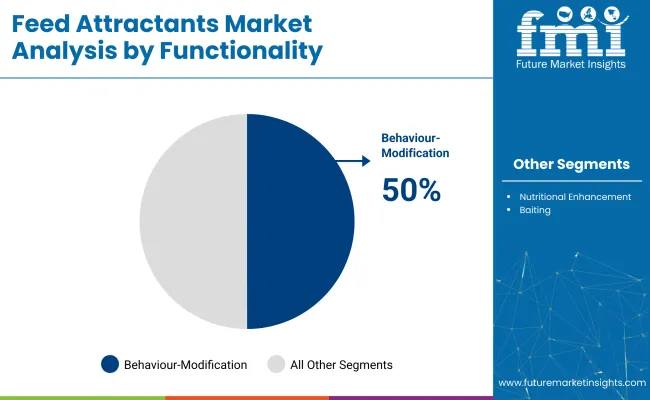
A 50% share has been held by behavior-modification attractants in 2025, reflecting their role in stabilizing feeding patterns and mitigating social stress within intensive production systems.
  • Appetite-trigger peptides are micro-encapsulated to bypass gastric degradation, releasing signals at intestinal receptor sites.
  • Controlled aroma pulses during dusk hours synchronize herd feeding, reducing aggression around electronic sow feeders.
  • Bitter-blocker molecules suppress off-notes from heat-processed protein meals, maintaining intake when cost-saving ingredients are incorporated.
  • Improved feed-conversion ratios reduce total ration cost per kilogram gain, supporting integrator margin objectives.

Feed Attractants Market By Functionality

Retail Sales Channels Expand Smallholder Access to Attractants

Retail sales account for a 40% sharein 2025, as cooperative stores and veterinary outlets source attractants in convenient pack sizes for backyard and niche producers

  • Five-kilogram resealable buckets protect hygroscopic powders from humidity, maintaining flowability during prolonged on-farm storage.
  • Color-coded labels simplify species selection, minimizing misapplication across mixed-livestock holdings.
  • QR-embedded trace codes direct buyers to dosage calculators, aligning usage with breed-specific growth targets.
  • Promotional tie-ins with mineral blocks encourage complementary purchases, boosting average ticket value at point of sale
  • Regional radio campaigns stress on non-medicated status, attracting hobby farmers seeking residue-free animal products.

Top Feed Attractants Market Dynamics

The shift toward antibiotic-free animal diets has intensified feed attractant usage, especially in aquaculture and swine. At the same time, volatile raw material sourcing and inconsistent compound standardization are restricting consistent formulation outcomes across commercial feed operations.

Antibiotic-Free Protocols Accelerating Attractant Inclusion Rates

Regulatory bans on antibiotic growth promoters in the EU, South Korea, and Vietnam have driven the integration of feed attractants to maintain intake and feed conversion ratios. Fishmeal substitutes in aquaculture have lowered palatability, making marine peptide-based attractants necessary in shrimp and tilapia feed. Swine starter diets now incorporate nucleotides, glutamate salts, and yeast extracts to preserve early-stage appetite. Compound feed mills in Thailand and Spain have partnered with ingredient providers like Nutriad and Phodé to standardize attractant blends by species and life stage. Intake trials are now embedded in pre-launch protocols to validate efficacy against conventional antibiotic regimes.

  • Marine-derived peptide blends are being adopted to offset low palatability in plant-based aquafeed.
  • Swine starter diets use attractants to recover appetite loss after AGP phase-out.
  • National regulators demand intake validation for antibiotic-free label certification.

Standardization Gaps Undermining Performance in Large-Scale Operations

Feed attractant efficacy often varies due to inconsistent raw input quality, especially in natural-origin compounds like fish hydrolysates or yeast extracts. Variability in peptide profile, salt content, and fermentation residue creates batch inconsistency across geographies. Poultry and ruminant feed formulators in India and Brazil report fluctuations in daily feed intake linked to seasonal shifts in attractant performance. Without global standards for attractant classification or potency benchmarks, integrators struggle to lock consistent inclusion rates. Performance predictability is a barrier to scale-up beyond pilot-stage use.
  • Ingredient variability from fish hydrolysates disrupts formulation stability in commercial aquafeed lines.
  • Lack of global potency benchmarks causes inconsistency across multi-country feed programs.
  • Ruminant intake dips are linked to seasonal volatility in attractant base quality.

Top Countries Formulating, Manufacturing, and Exporting Feed Attractants

Feed Attractants Market Country Wise

The report covers detailed analysis of 40+ countries and the top five countries have been shared as a reference.

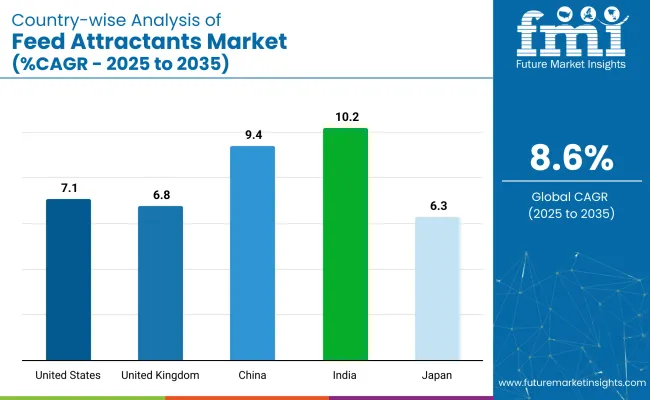
Countries CAGR (2025-2035)
United States 7.1 %
United Kingdom 6.8 %
China 9.4 %
Japan 6.3 %
India 10.2 %

The demand for feed attractants is expected to rise at an 8.5 % CAGR from 2025 to 2035. Among five profiled markets, India leads at 10.2 %, China follows at 9.4 %, and the United States reaches 7.1 %; the United Kingdom logs 6.8 % and Japan 6.3 %. These figures translate a +20 % premium for India and +11 % for China versus baseline, while the United States, United Kingdom, and Japan trail by –16 %, –20 %, and –26 %. Catalysts differ: shrimp-feed enhancers lift India’s BRICS growth; China gains from swine-herd rebuilding and umami additives; OECD United States relies on pet-food lines; the United Kingdom sees limited herd expansion; Japan’s aqua flavours inch ahead amid meat output.

Analysis of Feed Attractants Market in India

India is forecasted to witness robust growth in the feed attractants market, with a CAGR of 10.2% through 2035. India’s feed attractants demand has intensified as compounders reformulate around oilseed cakes and protein extenders. Aquaculture feed usage has surged due to state-backed inland fisheries missions, prompting higher inclusion of krill extracts and fermented yeast blends in carp and prawn diets. Poultry producers are adopting attractants to offset variability in broken rice and corn digestibility. Regulatory mandates now require proper labeling of feed ingredients, indirectly supporting branded attractant suppliers. Buyer preference is shifting toward organoleptic enhancers that deliver consistent intake in small ruminants and backyard poultry flocks.

  • Private feed mills are incorporating molasses-based flavorants to stabilize sugarcane by-product-based rations.
  • Attractants are now embedded in new BIS-compliant formulations for livestock and aquafeed blends.
  • Coastal states are promoting shrimp-specific attractants through cluster-based aquafeed subsidies.

Demand Forecast for Feed Attractants Market in China

China’s feed attractants market is projected to grow at an impressive 9.4% CAGR between 2025 and 2035. In China, flavor modulator adoption is increasing as compounders replace synthetic amino acids with enzymatically hydrolyzed protein sources. Attractants have become a default input in shrimp, eel, and tilapia feeds, especially in recirculating aquaculture systems. Pig integrators are incorporating proprietary scent compounds to combat stress-related feed refusal during post-weaning transitions. Since the phase-out of in-feed antibiotics, the sector has seen a shift toward palatability enhancers for both health maintenance and conversion efficiency.

  • Proprietary fishmeal alternatives now feature marine-origin attractants to retain appetite across intensive systems.
  • Commercial poultry diets include fermented yeast attractants to balance low-lysine grain formulations.
  • Regional fish farms have standardized krill- and squid-based palatants in high-density tank feeds.

Growth Analysis of Feed Attractants Market in the United States

A CAGR of 7.1% is expected for the feed attractants market in the United States between 2025 and 2035. The United States feed sector is utilizing attractants to support formula optimization under volatile corn and soy pricing. Flavoring agents are integrated across dairy, poultry, and swine diets, especially where producers are limiting protein to meet nutrient-excretion regulations. Ruminant premixes often feature molasses or vanilla derivatives to improve intake of urea-based blends. Pet food manufacturers are also leveraging meat-digest palatants to differentiate in a competitive companion animal nutrition landscape.

  • Flavorants are used in forage-extender cubes to improve dry matter intake during drought-induced hay shortages.
  • Feedlot operators prefer low-ash palatants to meet carcass-traceability standards under verified beef programs.
  • Pet food plants are deploying flavor systems that mimic species-specific aroma profiles in freeze-dried recipes.

Future Outlook for Feed Attractants Market in the United Kingdom

A growth rate of 6.8% CAGR is anticipated for the feed attractants market in the United Kingdom between 2025 and 2035. The United Kingdom’s feed manufacturers are aligning attractant usage with shifts in ingredient sourcing and animal welfare compliance. As synthetic amino acid imports tighten, feed formulators are leaning on attractants to balance palatability across rapeseed-based diets. Pig producers are experimenting with attractant-infused creep feeds for neonatal acceptance. In monogastric sectors, specific blends are being deployed to improve intake consistency during heat stress and seasonal transitions.

  • Compounders are developing attractant systems tailored to swine weight-gain programs using co-products.
  • Poultry feed uses herb-infused attractants to reduce bitter off-notes in legume-based blends.
  • Aquafeed suppliers are rolling out carp-specific attractants to align with pond water temperature variability.

Feed Attractants Market Growth Outlook in Japan

The feed attractants market in Japan is projected to expand at a rate of 6.3% CAGR over the forecast period. Japan’s aquaculture-centered feed market has incorporated attractants as standard in pellet and microencapsulated feeds. Producers of yellowtail and sea bream have increased usage of krill and squid extract blends to ensure feed acceptance in temperature-sensitive recirculating systems. As fisheries reform limits marine resource access, attractants are supporting transition to plant-protein-based diets. High-end feed processors are formulating palatant-infused lines for export-oriented hatcheries focused on quality certification and reduced feed conversion ratios.

  • Micro-pellets for early-stage hatchlings now rely on natural flavor boosters for faster training-to-feed.
  • Marine fish diets incorporate attractants to retain appetite under fluctuating oxygen levels.
  • Domestic aquafeed firms use custom attractants to differentiate their brands in premium farm clusters.

Leading Feed Attractant Suppliers

The industry has a high competition, with leading players like Monster Meal, Tucker Milling, and Innovad focusing on developing specialized products that enhance the appeal and nutritional value of animal feed. Kemin Industries and Darling Ingredients leverage their strong research and development capabilities to introduce innovative feed attractants that meet the needs of various livestock. Companies like Adisseo and BigTine focus on regional growth, offering tailored solutions for specific animal types or markets. Smaller players like Attrax and Boarmasters differentiate themselves by focusing on niche segments. The market remains fragmented, with both large firms and smaller, specialized companies competing on product innovation, regional presence, and customer-specific solutions.

Recent Industry News

  • KeminNutrisurance debuted PALIVATE™ in January 2025, a wet-pet-food palatant delivering richer aroma and masking off-notes from alternative proteins; the EMEA launch promises higher feline and canine intake scores, enabling premium, clean-label recipes without artificial flavors or colorants at industrial scale.
  • Symrise’s SPF division launched VET’PAL, a plant-based palatability enhancer formulated for veterinary drugs and pet supplements, boosting acceptance across gummies, chews, tablets and liquids, supporting treatment compliance while meeting label-friendly, GMO-free sourcing demands.

Report Coverage and Scope Summary

Report Attributes Key Insights
Estimated Market Value (2025) USD 7.52 billion
Projected Market Value (2035) USD 17.16 billion
CAGR (2025 to 2035) 8.6%
Base Year for Estimation 2024
Historical Period 2020 to 2024
Forecast Period 2025 to 2035
Quantitative Units Revenue in USD billion
Composition Organic compounds (amino acids, fatty acids, carbohydrates), Inorganic compounds (mineral salts, acidifiers, pH modifiers), Bio-additives (enzymes, probiotics, prebiotics), others
Functionality Behavior modification (feeding, breeding), Nutritional enhancement (growth, health stimulants), Baiting
Livestock Ruminant, Poultry, Swine, Aquaculture, Pet animal, Others
Sales Channel Retail sales, Wholesale, Industrial sales, Online sales
Packaging Type Bulk packaging, Retail packaging, Customized packaging
Region North America, Latin America, Western Europe, Eastern Europe, East Asia, South Asia & Pacific, Central Asia, Russia & Belarus, Balkan & Baltic Countries, Middle East & Africa
Countries Covered United States, Canada, Mexico, Brazil, Argentina, Germany, France, United Kingdom, Italy, Spain, Netherlands, China, India, Japan, South Korea, ANZ, GCC Countries, South Africa
Key Players Monster Meal, Tucker Milling, Innovad , 4S Advanced Wildlife Solutions, Double Down Deer Feed, Merton Feed Company, LLC, Standley Feed and Seed, Attrax , Boarmasters , BigTine , PVS Laboratories Limited, Advance Aqua Biotechnologies India, Kemin Industries, Inc., Darling Ingredients, Adisseo , Chongqing Mintai New Agrotech Development Group Co., Ltd.
Additional Attributes Dollar sales, CAGR trends, product type distribution, size preferences, absorbency level demand, price range segmentation, competitor dollar sales & market share, regional growth patterns

Top Segments Analyzed

By Composition:

The segmentation is into organic compounds (amino acids, fatty acids, carbohydrates, and others), inorganic compounds (mineral salts, acidifiers, and pH modifiers), bio-additives (enzymes, probiotics, and prebiotics), and others.

By Functionality:

The segmentation is into behavior modification (feeding behavior, and breeding behavior), nutritional enhancement (growth stimulants, and health stimulants), and baiting.

By Livestock:

The segmentation is into ruminant, poultry, swine, aquaculture, pet animal, and others.

By Sales Channel:

The segmentation is into retail sales, wholesale, industrial sales, and online sales.

By Packaging Type:

The segmentation is into bulk packaging, retail packaging, and customized packaging.

By Region:

The segmentation is into North America, Latin America, Western Europe, Eastern Europe, East Asia, South Asia & Pacific, Central Asia, Russia and Belarus, Balkan & Baltic Countries, Middle East and Africa.

Table of Content

  1. Executive Summary
    • Global Market Outlook
    • Demand-side Trends
    • Supply-side Trends
    • Technology Roadmap Analysis
    • Analysis and Recommendations
  2. Market Overview
    • Market Coverage / Taxonomy
    • Market Definition / Scope / Limitations
  3. Market Background
    • Market Dynamics
      • Drivers
      • Restraints
      • Opportunity
      • Trends
    • Scenario Forecast
      • Demand in Optimistic Scenario
      • Demand in Likely Scenario
      • Demand in Conservative Scenario
    • Opportunity Map Analysis
    • Product Life Cycle Analysis
    • Supply Chain Analysis
      • Supply Side Participants and their Roles
        • Producers
        • Mid-Level Participants (Traders/ Agents/ Brokers)
        • Wholesalers and Distributors
      • Value Added and Value Created at Node in the Supply Chain
      • List of Raw Material Suppliers
      • List of Existing and Potential Buyer’s
    • Investment Feasibility Matrix
    • Value Chain Analysis
      • Profit Margin Analysis
      • Wholesalers and Distributors
      • Retailers
    • PESTLE and Porter’s Analysis
    • Regulatory Landscape
      • By Key Regions
      • By Key Countries
    • Regional Parent Market Outlook
    • Production and Consumption Statistics
    • Import and Export Statistics
  4. Global Market Analysis 2020-2024 and Forecast, 2025-2035
    • Historical Market Size Value (USD Billion) & Million Units Analysis, 2020-2024
    • Current and Future Market Size Value (USD Billion) & Million Units Projections, 2025-2035
      • Y-o-Y Growth Trend Analysis
      • Absolute $ Opportunity Analysis
  5. Global Market Pricing Analysis 2020-2024 and Forecast 2025-2035
  6. Global Market Analysis 2020-2024 and Forecast 2025-2035, By Composition
    • Introduction / Key Findings
    • Historical Market Size Value (USD Billion) & Million Units Analysis By Composition, 2020-2024
    • Current and Future Market Size Value (USD Billion) & Million Units Analysis and Forecast By Composition, 2025-2035
      • Organic Compounds
        • Amino Acids
        • Fatty Acids
        • Carbohydrates
        • Others
      • Inorganic Compounds
        • Mineral Salts
        • Acidifiers
        • pH Modifiers
      • Bio-Additives
        • Enzymes
        • Probiotics
        • Prebiotics
      • Others
    • Y-o-Y Growth Trend Analysis By Composition, 2020-2024
    • Absolute $ Opportunity Analysis By Composition, 2025-2035
  7. Global Market Analysis 2020-2024 and Forecast 2025-2035, By Functionality
    • Introduction / Key Findings
    • Historical Market Size Value (USD Billion) & Million Units Analysis By Functionality, 2020-2024
    • Current and Future Market Size Value (USD Billion) & Million Units Analysis and Forecast By Functionality, 2025-2035
      • Behavior Modification
        • Feeding Behavior
        • Breeding Behavior
      • Nutritional Enhancement
        • Growth Stimulants
        • Health Stimulants
      • Baiting
    • Y-o-Y Growth Trend Analysis By Functionality, 2020-2024
    • Absolute $ Opportunity Analysis By Functionality, 2025-2035
  8. Global Market Analysis 2020-2024 and Forecast 2025-2035, By Livestock
    • Introduction / Key Findings
    • Historical Market Size Value (USD Billion) & Million Units Analysis By Livestock, 2020-2024
    • Current and Future Market Size Value (USD Billion) & Million Units Analysis and Forecast By Livestock, 2025-2035
      • Ruminant
      • Poultry
      • Swine
      • Aquaculture
      • Pet Animal
      • Others
    • Y-o-Y Growth Trend Analysis By Livestock, 2020-2024
    • Absolute $ Opportunity Analysis By Livestock, 2025-2035
  9. Global Market Analysis 2020-2024 and Forecast 2025-2035, By Sales Channel
    • Introduction / Key Findings
    • Historical Market Size Value (USD Billion) & Million Units Analysis By Sales Channel, 2020-2024
    • Current and Future Market Size Value (USD Billion) & Million Units Analysis and Forecast By Sales Channel, 2025-2035
      • Retail Sales
      • Wholesale
      • Industrial Sales
      • Online Sales
    • Y-o-Y Growth Trend Analysis By Sales Channel, 2020-2024
    • Absolute $ Opportunity Analysis By Sales Channel, 2025-2035
  10. Global Market Analysis 2020-2024 and Forecast 2025-2035, By Packaging Type
    • Introduction / Key Findings
    • Historical Market Size Value (USD Billion) & Million Units Analysis By Packaging Type, 2020-2024
    • Current and Future Market Size Value (USD Billion) & Million Units Analysis and Forecast By Packaging Type, 2025-2035
      • Bulk Packaging
      • Retail Packaging
      • Customized Packaging
    • Y-o-Y Growth Trend Analysis By Packaging Type, 2020-2024
    • Absolute $ Opportunity Analysis By Packaging Type, 2025-2035
  11. Global Market Analysis 2020-2024 and Forecast 2025-2035, By Region
    • Introduction
    • Historical Market Size Value (USD Billion) & Million Units Analysis By Region, 2020-2024
    • Current Market Size Value (USD Billion) & Million Units Analysis and Forecast By Region, 2025-2035
      • North America
      • Latin America
      • Western Europe
      • Eastern Europe
      • East Asia
      • South Asia & Pacific
      • Middle East and Africa
    • Market Attractiveness Analysis By Region
  12. North America Market Analysis 2020-2024 and Forecast 2025-2035, By Country
    • Historical Market Size Value (USD Billion) & Million Units Trend Analysis By Market Taxonomy, 2020-2024
    • Market Size Value (USD Billion) & Million Units Forecast By Market Taxonomy, 2025-2035
      • By Country
        • USA
        • Canada
        • Mexico
      • By Composition
      • By Functionality
      • By Livestock
      • By Sales Channel
      • By Packaging Type
    • Market Attractiveness Analysis
      • By Country
      • By Composition
      • By Functionality
      • By Livestock
      • By Sales Channel
      • By Packaging Type
    • Key Takeaways
  13. Latin America Market Analysis 2020-2024 and Forecast 2025-2035, By Country
    • Historical Market Size Value (USD Billion) & Million Units Trend Analysis By Market Taxonomy, 2020-2024
    • Market Size Value (USD Billion) & Million Units Forecast By Market Taxonomy, 2025-2035
      • By Country
        • Brazil
        • Argentina
        • Rest of LATAM
      • By Composition
      • By Functionality
      • By Livestock
      • By Sales Channel
      • By Packaging Type
    • Market Attractiveness Analysis
      • By Country
      • By Composition
      • By Functionality
      • By Livestock
      • By Sales Channel
      • By Packaging Type
    • Key Takeaways
  14. Western Europe Market Analysis 2020-2024 and Forecast 2025-2035, By Country
    • Historical Market Size Value (USD Billion) & Million Units Trend Analysis By Market Taxonomy, 2020-2024
    • Market Size Value (USD Billion) & Million Units Forecast By Market Taxonomy, 2025-2035
      • By Country
        • Germany
        • Italy
        • France
        • UK
        • Spain
        • BENELUX
        • Nordic
        • Rest of W.Europe
      • By Composition
      • By Functionality
      • By Livestock
      • By Sales Channel
      • By Packaging Type
    • Market Attractiveness Analysis
      • By Country
      • By Composition
      • By Functionality
      • By Livestock
      • By Sales Channel
      • By Packaging Type
    • Key Takeaways
  15. Eastern Europe Market Analysis 2020-2024 and Forecast 2025-2035, By Country
    • Historical Market Size Value (USD Billion) & Million Units Trend Analysis By Market Taxonomy, 2020-2024
    • Market Size Value (USD Billion) & Million Units Forecast By Market Taxonomy, 2025-2035
      • By Country
        • Russia
        • Hungary
        • Poland
        • Balkan & Baltics
        • Rest of E. Europe
      • By Composition
      • By Functionality
      • By Livestock
      • By Sales Channel
      • By Packaging Type
    • Market Attractiveness Analysis
      • By Country
      • By Composition
      • By Functionality
      • By Livestock
      • By Sales Channel
      • By Packaging Type
    • Key Takeaways
  16. East Asia Market Analysis 2020-2024 and Forecast 2025-2035, By Country
    • Historical Market Size Value (USD Billion) & Million Units Trend Analysis By Market Taxonomy, 2020-2024
    • Market Size Value (USD Billion) & Million Units Forecast By Market Taxonomy, 2025-2035
      • By Country
        • China
        • Japan
        • South Korea
      • By Composition
      • By Functionality
      • By Livestock
      • By Sales Channel
      • By Packaging Type
    • Market Attractiveness Analysis
      • By Country
      • By Composition
      • By Functionality
      • By Livestock
      • By Sales Channel
      • By Packaging Type
    • Key Takeaways
  17. South Asia & Pacific Market Analysis 2020-2024 and Forecast 2025-2035, By Country
    • Historical Market Size Value (USD Billion) & Million Units Trend Analysis By Market Taxonomy, 2020-2024
    • Market Size Value (USD Billion) & Million Units Forecast By Market Taxonomy, 2025-2035
      • By Country
        • India
        • Australia & New Zealand
        • ASEAN
        • Rest of SAP
      • By Composition
      • By Functionality
      • By Livestock
      • By Sales Channel
      • By Packaging Type
    • Market Attractiveness Analysis
      • By Country
      • By Composition
      • By Functionality
      • By Livestock
      • By Sales Channel
      • By Packaging Type
    • Key Takeaways
  18. Middle East and Africa Market Analysis 2020-2024 and Forecast 2025-2035, By Country
    • Historical Market Size Value (USD Billion) & Million Units Trend Analysis By Market Taxonomy, 2020-2024
    • Market Size Value (USD Billion) & Million Units Forecast By Market Taxonomy, 2025-2035
      • By Country
        • GCC Countries
        • Northern Africa
        • South Africa
        • Turkiye
        • Rest of MEA
      • By Composition
      • By Functionality
      • By Livestock
      • By Sales Channel
      • By Packaging Type
    • Market Attractiveness Analysis
      • By Country
      • By Composition
      • By Functionality
      • By Livestock
      • By Sales Channel
      • By Packaging Type
    • Key Takeaways
  19. Key Countries Market Analysis
    • USA
      • Pricing Analysis
      • Market Share Analysis, 2024
        • By Composition
        • By Functionality
        • By Livestock
        • By Sales Channel
        • By Packaging Type
    • Canada
      • Pricing Analysis
      • Market Share Analysis, 2024
        • By Composition
        • By Functionality
        • By Livestock
        • By Sales Channel
        • By Packaging Type
    • Brazil
      • Pricing Analysis
      • Market Share Analysis, 2024
        • By Composition
        • By Functionality
        • By Livestock
        • By Sales Channel
        • By Packaging Type
    • Mexico
      • Pricing Analysis
      • Market Share Analysis, 2024
        • By Composition
        • By Functionality
        • By Livestock
        • By Sales Channel
        • By Packaging Type
    • Argentina
      • Pricing Analysis
      • Market Share Analysis, 2024
        • By Composition
        • By Functionality
        • By Livestock
        • By Sales Channel
        • By Packaging Type
  20. Market Structure Analysis
    • Competition Dashboard
    • Competition Benchmarking
    • Market Share Analysis of Top Players
      • By Regional
      • By Composition
      • By Functionality
      • By Livestock
      • By Sales Channel
      • By Packaging Type
  21. Competition Analysis
    • Competition Deep Dive
      • Monster Meal
        • Overview
        • Product Portfolio
        • Profitability by Market Segments (Product/Age /Sales Channel/Region)
        • Sales Footprint
        • Strategy Overview
          • Marketing Strategy
          • Product Strategy
          • Channel Strategy
      • Tucker Milling
        • Overview
        • Product Portfolio
        • Profitability by Market Segments (Product/Age /Sales Channel/Region)
        • Sales Footprint
        • Strategy Overview
          • Marketing Strategy
          • Product Strategy
          • Channel Strategy
      • Innovad
        • Overview
        • Product Portfolio
        • Profitability by Market Segments (Product/Age /Sales Channel/Region)
        • Sales Footprint
        • Strategy Overview
          • Marketing Strategy
          • Product Strategy
          • Channel Strategy
      • 4S Advanced Wildlife Solutions
        • Overview
        • Product Portfolio
        • Profitability by Market Segments (Product/Age /Sales Channel/Region)
        • Sales Footprint
        • Strategy Overview
          • Marketing Strategy
          • Product Strategy
          • Channel Strategy
      • Double Down Deer Feed
        • Overview
        • Product Portfolio
        • Profitability by Market Segments (Product/Age /Sales Channel/Region)
        • Sales Footprint
        • Strategy Overview
          • Marketing Strategy
          • Product Strategy
          • Channel Strategy
      • Merton Feed Company, LLC
        • Overview
        • Product Portfolio
        • Profitability by Market Segments (Product/Age /Sales Channel/Region)
        • Sales Footprint
        • Strategy Overview
          • Marketing Strategy
          • Product Strategy
          • Channel Strategy
      • Standley Feed and Seed
        • Overview
        • Product Portfolio
        • Profitability by Market Segments (Product/Age /Sales Channel/Region)
        • Sales Footprint
        • Strategy Overview
          • Marketing Strategy
          • Product Strategy
          • Channel Strategy
      • Attrax
        • Overview
        • Product Portfolio
        • Profitability by Market Segments (Product/Age /Sales Channel/Region)
        • Sales Footprint
        • Strategy Overview
          • Marketing Strategy
          • Product Strategy
          • Channel Strategy
      • Boarmasters
        • Overview
        • Product Portfolio
        • Profitability by Market Segments (Product/Age /Sales Channel/Region)
        • Sales Footprint
        • Strategy Overview
          • Marketing Strategy
          • Product Strategy
          • Channel Strategy
      • BigTine
        • Overview
        • Product Portfolio
        • Profitability by Market Segments (Product/Age /Sales Channel/Region)
        • Sales Footprint
        • Strategy Overview
          • Marketing Strategy
          • Product Strategy
          • Channel Strategy
      • PVS Laboratories Limited
        • Overview
        • Product Portfolio
        • Profitability by Market Segments (Product/Age /Sales Channel/Region)
        • Sales Footprint
        • Strategy Overview
          • Marketing Strategy
          • Product Strategy
          • Channel Strategy
      • Advance Aqua Biotechnologies India
        • Overview
        • Product Portfolio
        • Profitability by Market Segments (Product/Age /Sales Channel/Region)
        • Sales Footprint
        • Strategy Overview
          • Marketing Strategy
          • Product Strategy
          • Channel Strategy
      • Kemin Industries, Inc.
        • Overview
        • Product Portfolio
        • Profitability by Market Segments (Product/Age /Sales Channel/Region)
        • Sales Footprint
        • Strategy Overview
          • Marketing Strategy
          • Product Strategy
          • Channel Strategy
      • Darling Ingredients
        • Overview
        • Product Portfolio
        • Profitability by Market Segments (Product/Age /Sales Channel/Region)
        • Sales Footprint
        • Strategy Overview
          • Marketing Strategy
          • Product Strategy
          • Channel Strategy
      • Adisseo
        • Overview
        • Product Portfolio
        • Profitability by Market Segments (Product/Age /Sales Channel/Region)
        • Sales Footprint
        • Strategy Overview
          • Marketing Strategy
          • Product Strategy
          • Channel Strategy
      • Chongqing Mintai New Agrotech Development Group Co., Ltd.
        • Overview
        • Product Portfolio
        • Profitability by Market Segments (Product/Age /Sales Channel/Region)
        • Sales Footprint
        • Strategy Overview
          • Marketing Strategy
          • Product Strategy
          • Channel Strategy
  22. Assumptions & Acronyms Used
  23. Research Methodology

List of Tables

  • Table 1: Global Market Value (USD Billion) Forecast by Region, 2020 to 2035
  • Table 2: Global Market Million Units Forecast by Region, 2020 to 2035
  • Table 3: Global Market Value (USD Billion) Forecast by Composition, 2020 to 2035
  • Table 4: Global Market Million Units Forecast by Composition, 2020 to 2035
  • Table 5: Global Market Value (USD Billion) Forecast by Functionality, 2020 to 2035
  • Table 6: Global Market Million Units Forecast by Functionality, 2020 to 2035
  • Table 7: Global Market Value (USD Billion) Forecast by Livestock, 2020 to 2035
  • Table 8: Global Market Million Units Forecast by Livestock, 2020 to 2035
  • Table 9: Global Market Value (USD Billion) Forecast by Sales Channel, 2020 to 2035
  • Table 10: Global Market Million Units Forecast by Sales Channel, 2020 to 2035
  • Table 11: Global Market Value (USD Billion) Forecast by Packaging Type, 2020 to 2035
  • Table 12: Global Market Million Units Forecast by Packaging Type, 2020 to 2035
  • Table 13: North America Market Value (USD Billion) Forecast by Country, 2020 to 2035
  • Table 14: North America Market Million Units Forecast by Country, 2020 to 2035
  • Table 15: North America Market Value (USD Billion) Forecast by Composition, 2020 to 2035
  • Table 16: North America Market Million Units Forecast by Composition, 2020 to 2035
  • Table 17: North America Market Value (USD Billion) Forecast by Functionality, 2020 to 2035
  • Table 18: North America Market Million Units Forecast by Functionality, 2020 to 2035
  • Table 19: North America Market Value (USD Billion) Forecast by Livestock, 2020 to 2035
  • Table 20: North America Market Million Units Forecast by Livestock, 2020 to 2035
  • Table 21: North America Market Value (USD Billion) Forecast by Sales Channel, 2020 to 2035
  • Table 22: North America Market Million Units Forecast by Sales Channel, 2020 to 2035
  • Table 23: North America Market Value (USD Billion) Forecast by Packaging Type, 2020 to 2035
  • Table 24: North America Market Million Units Forecast by Packaging Type, 2020 to 2035
  • Table 25: Latin America Market Value (USD Billion) Forecast by Country, 2020 to 2035
  • Table 26: Latin America Market Million Units Forecast by Country, 2020 to 2035
  • Table 27: Latin America Market Value (USD Billion) Forecast by Composition, 2020 to 2035
  • Table 28: Latin America Market Million Units Forecast by Composition, 2020 to 2035
  • Table 29: Latin America Market Value (USD Billion) Forecast by Functionality, 2020 to 2035
  • Table 30: Latin America Market Million Units Forecast by Functionality, 2020 to 2035
  • Table 31: Latin America Market Value (USD Billion) Forecast by Livestock, 2020 to 2035
  • Table 32: Latin America Market Million Units Forecast by Livestock, 2020 to 2035
  • Table 33: Latin America Market Value (USD Billion) Forecast by Sales Channel, 2020 to 2035
  • Table 34: Latin America Market Million Units Forecast by Sales Channel, 2020 to 2035
  • Table 35: Latin America Market Value (USD Billion) Forecast by Packaging Type, 2020 to 2035
  • Table 36: Latin America Market Million Units Forecast by Packaging Type, 2020 to 2035
  • Table 37: Western Europe Market Value (USD Billion) Forecast by Country, 2020 to 2035
  • Table 38: Western Europe Market Million Units Forecast by Country, 2020 to 2035
  • Table 39: Western Europe Market Value (USD Billion) Forecast by Composition, 2020 to 2035
  • Table 40: Western Europe Market Million Units Forecast by Composition, 2020 to 2035
  • Table 41: Western Europe Market Value (USD Billion) Forecast by Functionality, 2020 to 2035
  • Table 42: Western Europe Market Million Units Forecast by Functionality, 2020 to 2035
  • Table 43: Western Europe Market Value (USD Billion) Forecast by Livestock, 2020 to 2035
  • Table 44: Western Europe Market Million Units Forecast by Livestock, 2020 to 2035
  • Table 45: Western Europe Market Value (USD Billion) Forecast by Sales Channel, 2020 to 2035
  • Table 46: Western Europe Market Million Units Forecast by Sales Channel, 2020 to 2035
  • Table 47: Western Europe Market Value (USD Billion) Forecast by Packaging Type, 2020 to 2035
  • Table 48: Western Europe Market Million Units Forecast by Packaging Type, 2020 to 2035
  • Table 49: Eastern Europe Market Value (USD Billion) Forecast by Country, 2020 to 2035
  • Table 50: Eastern Europe Market Million Units Forecast by Country, 2020 to 2035
  • Table 51: Eastern Europe Market Value (USD Billion) Forecast by Composition, 2020 to 2035
  • Table 52: Eastern Europe Market Million Units Forecast by Composition, 2020 to 2035
  • Table 53: Eastern Europe Market Value (USD Billion) Forecast by Functionality, 2020 to 2035
  • Table 54: Eastern Europe Market Million Units Forecast by Functionality, 2020 to 2035
  • Table 55: Eastern Europe Market Value (USD Billion) Forecast by Livestock, 2020 to 2035
  • Table 56: Eastern Europe Market Million Units Forecast by Livestock, 2020 to 2035
  • Table 57: Eastern Europe Market Value (USD Billion) Forecast by Sales Channel, 2020 to 2035
  • Table 58: Eastern Europe Market Million Units Forecast by Sales Channel, 2020 to 2035
  • Table 59: Eastern Europe Market Value (USD Billion) Forecast by Packaging Type, 2020 to 2035
  • Table 60: Eastern Europe Market Million Units Forecast by Packaging Type, 2020 to 2035
  • Table 61: East Asia Market Value (USD Billion) Forecast by Country, 2020 to 2035
  • Table 62: East Asia Market Million Units Forecast by Country, 2020 to 2035
  • Table 63: East Asia Market Value (USD Billion) Forecast by Composition, 2020 to 2035
  • Table 64: East Asia Market Million Units Forecast by Composition, 2020 to 2035
  • Table 65: East Asia Market Value (USD Billion) Forecast by Functionality, 2020 to 2035
  • Table 66: East Asia Market Million Units Forecast by Functionality, 2020 to 2035
  • Table 67: East Asia Market Value (USD Billion) Forecast by Livestock, 2020 to 2035
  • Table 68: East Asia Market Million Units Forecast by Livestock, 2020 to 2035
  • Table 69: East Asia Market Value (USD Billion) Forecast by Sales Channel, 2020 to 2035
  • Table 70: East Asia Market Million Units Forecast by Sales Channel, 2020 to 2035
  • Table 71: East Asia Market Value (USD Billion) Forecast by Packaging Type, 2020 to 2035
  • Table 72: East Asia Market Million Units Forecast by Packaging Type, 2020 to 2035
  • Table 73: South Asia & Pacific Market Value (USD Billion) Forecast by Country, 2020 to 2035
  • Table 74: South Asia & Pacific Market Million Units Forecast by Country, 2020 to 2035
  • Table 75: South Asia & Pacific Market Value (USD Billion) Forecast by Composition, 2020 to 2035
  • Table 76: South Asia & Pacific Market Million Units Forecast by Composition, 2020 to 2035
  • Table 77: South Asia & Pacific Market Value (USD Billion) Forecast by Functionality, 2020 to 2035
  • Table 78: South Asia & Pacific Market Million Units Forecast by Functionality, 2020 to 2035
  • Table 79: South Asia & Pacific Market Value (USD Billion) Forecast by Livestock, 2020 to 2035
  • Table 80: South Asia & Pacific Market Million Units Forecast by Livestock, 2020 to 2035
  • Table 81: South Asia & Pacific Market Value (USD Billion) Forecast by Sales Channel, 2020 to 2035
  • Table 82: South Asia & Pacific Market Million Units Forecast by Sales Channel, 2020 to 2035
  • Table 83: South Asia & Pacific Market Value (USD Billion) Forecast by Packaging Type, 2020 to 2035
  • Table 84: South Asia & Pacific Market Million Units Forecast by Packaging Type, 2020 to 2035
  • Table 85: Middle East and Africa Market Value (USD Billion) Forecast by Country, 2020 to 2035
  • Table 86: Middle East and Africa Market Million Units Forecast by Country, 2020 to 2035
  • Table 87: Middle East and Africa Market Value (USD Billion) Forecast by Composition, 2020 to 2035
  • Table 88: Middle East and Africa Market Million Units Forecast by Composition, 2020 to 2035
  • Table 89: Middle East and Africa Market Value (USD Billion) Forecast by Functionality, 2020 to 2035
  • Table 90: Middle East and Africa Market Million Units Forecast by Functionality, 2020 to 2035
  • Table 91: Middle East and Africa Market Value (USD Billion) Forecast by Livestock, 2020 to 2035
  • Table 92: Middle East and Africa Market Million Units Forecast by Livestock, 2020 to 2035
  • Table 93: Middle East and Africa Market Value (USD Billion) Forecast by Sales Channel, 2020 to 2035
  • Table 94: Middle East and Africa Market Million Units Forecast by Sales Channel, 2020 to 2035
  • Table 95: Middle East and Africa Market Value (USD Billion) Forecast by Packaging Type, 2020 to 2035
  • Table 96: Middle East and Africa Market Million Units Forecast by Packaging Type, 2020 to 2035

List of Figures

  • Figure 1: Global Market Million Units Forecast 2020–2035
  • Figure 2: Global Market Pricing Analysis
  • Figure 3: Global Market Value (USD Billion) Forecast 2020–2035
  • Figure 4: Global Market Value Share and BPS Analysis by Composition, 2025 and 2035
  • Figure 5: Global Market Y-o-Y Growth Comparison by Composition, 2025 to 2035
  • Figure 6: Global Market Attractiveness Analysis by Composition
  • Figure 7: Global Market Value Share and BPS Analysis by Functionality, 2025 and 2035
  • Figure 8: Global Market Y-o-Y Growth Comparison by Functionality, 2025 to 2035
  • Figure 9: Global Market Attractiveness Analysis by Functionality
  • Figure 10: Global Market Value Share and BPS Analysis by Livestock, 2025 and 2035
  • Figure 11: Global Market Y-o-Y Growth Comparison by Livestock, 2025 to 2035
  • Figure 12: Global Market Attractiveness Analysis by Livestock
  • Figure 13: Global Market Value Share and BPS Analysis by Sales Channel, 2025 and 2035
  • Figure 14: Global Market Y-o-Y Growth Comparison by Sales Channel, 2025 to 2035
  • Figure 15: Global Market Attractiveness Analysis by Sales Channel
  • Figure 16: Global Market Value Share and BPS Analysis by Packaging Type, 2025 and 2035
  • Figure 17: Global Market Y-o-Y Growth Comparison by Packaging Type, 2025 to 2035
  • Figure 18: Global Market Attractiveness Analysis by Packaging Type
  • Figure 19: Global Market Value (USD Billion) Share and BPS Analysis by Region, 2025 and 2035
  • Figure 20: Global Market Y-o-Y Growth Comparison by Region, 2025 to 2035
  • Figure 21: Global Market Attractiveness Analysis by Region
  • Figure 22: North America Market Incremental $ Opportunity, 2025 to 2035
  • Figure 23: Latin America Market Incremental $ Opportunity, 2025 to 2035
  • Figure 24: Western Europe Market Incremental $ Opportunity, 2025 to 2035
  • Figure 25: Eastern Europe Market Incremental $ Opportunity, 2025 to 2035
  • Figure 26: East Asia Market Incremental $ Opportunity, 2025 to 2035
  • Figure 27: South Asia & Pacific Market Incremental $ Opportunity, 2025 to 2035
  • Figure 28: Middle East and Africa Market Incremental $ Opportunity, 2025 to 2035
  • Figure 29: North America Market Value Share and BPS Analysis by Country, 2025 and 2035
  • Figure 30: North America Market Value Share and BPS Analysis by Composition, 2025 and 2035
  • Figure 31: North America Market Y-o-Y Growth Comparison by Composition, 2025 to 2035
  • Figure 32: North America Market Attractiveness Analysis by Composition
  • Figure 33: North America Market Value Share and BPS Analysis by Functionality, 2025 and 2035
  • Figure 34: North America Market Y-o-Y Growth Comparison by Functionality, 2025 to 2035
  • Figure 35: North America Market Attractiveness Analysis by Functionality
  • Figure 36: North America Market Value Share and BPS Analysis by Livestock, 2025 and 2035
  • Figure 37: North America Market Y-o-Y Growth Comparison by Livestock, 2025 to 2035
  • Figure 38: North America Market Attractiveness Analysis by Livestock
  • Figure 39: North America Market Value Share and BPS Analysis by Sales Channel, 2025 and 2035
  • Figure 40: North America Market Y-o-Y Growth Comparison by Sales Channel, 2025 to 2035
  • Figure 41: North America Market Attractiveness Analysis by Sales Channel
  • Figure 42: North America Market Value Share and BPS Analysis by Packaging Type, 2025 and 2035
  • Figure 43: North America Market Y-o-Y Growth Comparison by Packaging Type, 2025 to 2035
  • Figure 44: North America Market Attractiveness Analysis by Packaging Type
  • Figure 45: Latin America Market Value Share and BPS Analysis by Country, 2025 and 2035
  • Figure 46: Latin America Market Value Share and BPS Analysis by Composition, 2025 and 2035
  • Figure 47: Latin America Market Y-o-Y Growth Comparison by Composition, 2025 to 2035
  • Figure 48: Latin America Market Attractiveness Analysis by Composition
  • Figure 49: Latin America Market Value Share and BPS Analysis by Functionality, 2025 and 2035
  • Figure 50: Latin America Market Y-o-Y Growth Comparison by Functionality, 2025 to 2035
  • Figure 51: Latin America Market Attractiveness Analysis by Functionality
  • Figure 52: Latin America Market Value Share and BPS Analysis by Livestock, 2025 and 2035
  • Figure 53: Latin America Market Y-o-Y Growth Comparison by Livestock, 2025 to 2035
  • Figure 54: Latin America Market Attractiveness Analysis by Livestock
  • Figure 55: Latin America Market Value Share and BPS Analysis by Sales Channel, 2025 and 2035
  • Figure 56: Latin America Market Y-o-Y Growth Comparison by Sales Channel, 2025 to 2035
  • Figure 57: Latin America Market Attractiveness Analysis by Sales Channel
  • Figure 58: Latin America Market Value Share and BPS Analysis by Packaging Type, 2025 and 2035
  • Figure 59: Latin America Market Y-o-Y Growth Comparison by Packaging Type, 2025 to 2035
  • Figure 60: Latin America Market Attractiveness Analysis by Packaging Type
  • Figure 61: Western Europe Market Value Share and BPS Analysis by Country, 2025 and 2035
  • Figure 62: Western Europe Market Value Share and BPS Analysis by Composition, 2025 and 2035
  • Figure 63: Western Europe Market Y-o-Y Growth Comparison by Composition, 2025 to 2035
  • Figure 64: Western Europe Market Attractiveness Analysis by Composition
  • Figure 65: Western Europe Market Value Share and BPS Analysis by Functionality, 2025 and 2035
  • Figure 66: Western Europe Market Y-o-Y Growth Comparison by Functionality, 2025 to 2035
  • Figure 67: Western Europe Market Attractiveness Analysis by Functionality
  • Figure 68: Western Europe Market Value Share and BPS Analysis by Livestock, 2025 and 2035
  • Figure 69: Western Europe Market Y-o-Y Growth Comparison by Livestock, 2025 to 2035
  • Figure 70: Western Europe Market Attractiveness Analysis by Livestock
  • Figure 71: Western Europe Market Value Share and BPS Analysis by Sales Channel, 2025 and 2035
  • Figure 72: Western Europe Market Y-o-Y Growth Comparison by Sales Channel, 2025 to 2035
  • Figure 73: Western Europe Market Attractiveness Analysis by Sales Channel
  • Figure 74: Western Europe Market Value Share and BPS Analysis by Packaging Type, 2025 and 2035
  • Figure 75: Western Europe Market Y-o-Y Growth Comparison by Packaging Type, 2025 to 2035
  • Figure 76: Western Europe Market Attractiveness Analysis by Packaging Type
  • Figure 77: Eastern Europe Market Value Share and BPS Analysis by Country, 2025 and 2035
  • Figure 78: Eastern Europe Market Value Share and BPS Analysis by Composition, 2025 and 2035
  • Figure 79: Eastern Europe Market Y-o-Y Growth Comparison by Composition, 2025 to 2035
  • Figure 80: Eastern Europe Market Attractiveness Analysis by Composition
  • Figure 81: Eastern Europe Market Value Share and BPS Analysis by Functionality, 2025 and 2035
  • Figure 82: Eastern Europe Market Y-o-Y Growth Comparison by Functionality, 2025 to 2035
  • Figure 83: Eastern Europe Market Attractiveness Analysis by Functionality
  • Figure 84: Eastern Europe Market Value Share and BPS Analysis by Livestock, 2025 and 2035
  • Figure 85: Eastern Europe Market Y-o-Y Growth Comparison by Livestock, 2025 to 2035
  • Figure 86: Eastern Europe Market Attractiveness Analysis by Livestock
  • Figure 87: Eastern Europe Market Value Share and BPS Analysis by Sales Channel, 2025 and 2035
  • Figure 88: Eastern Europe Market Y-o-Y Growth Comparison by Sales Channel, 2025 to 2035
  • Figure 89: Eastern Europe Market Attractiveness Analysis by Sales Channel
  • Figure 90: Eastern Europe Market Value Share and BPS Analysis by Packaging Type, 2025 and 2035
  • Figure 91: Eastern Europe Market Y-o-Y Growth Comparison by Packaging Type, 2025 to 2035
  • Figure 92: Eastern Europe Market Attractiveness Analysis by Packaging Type
  • Figure 93: East Asia Market Value Share and BPS Analysis by Country, 2025 and 2035
  • Figure 94: East Asia Market Value Share and BPS Analysis by Composition, 2025 and 2035
  • Figure 95: East Asia Market Y-o-Y Growth Comparison by Composition, 2025 to 2035
  • Figure 96: East Asia Market Attractiveness Analysis by Composition
  • Figure 97: East Asia Market Value Share and BPS Analysis by Functionality, 2025 and 2035
  • Figure 98: East Asia Market Y-o-Y Growth Comparison by Functionality, 2025 to 2035
  • Figure 99: East Asia Market Attractiveness Analysis by Functionality
  • Figure 100: East Asia Market Value Share and BPS Analysis by Livestock, 2025 and 2035
  • Figure 101: East Asia Market Y-o-Y Growth Comparison by Livestock, 2025 to 2035
  • Figure 102: East Asia Market Attractiveness Analysis by Livestock
  • Figure 103: East Asia Market Value Share and BPS Analysis by Sales Channel, 2025 and 2035
  • Figure 104: East Asia Market Y-o-Y Growth Comparison by Sales Channel, 2025 to 2035
  • Figure 105: East Asia Market Attractiveness Analysis by Sales Channel
  • Figure 106: East Asia Market Value Share and BPS Analysis by Packaging Type, 2025 and 2035
  • Figure 107: East Asia Market Y-o-Y Growth Comparison by Packaging Type, 2025 to 2035
  • Figure 108: East Asia Market Attractiveness Analysis by Packaging Type
  • Figure 109: South Asia & Pacific Market Value Share and BPS Analysis by Country, 2025 and 2035
  • Figure 110: South Asia & Pacific Market Value Share and BPS Analysis by Composition, 2025 and 2035
  • Figure 111: South Asia & Pacific Market Y-o-Y Growth Comparison by Composition, 2025 to 2035
  • Figure 112: South Asia & Pacific Market Attractiveness Analysis by Composition
  • Figure 113: South Asia & Pacific Market Value Share and BPS Analysis by Functionality, 2025 and 2035
  • Figure 114: South Asia & Pacific Market Y-o-Y Growth Comparison by Functionality, 2025 to 2035
  • Figure 115: South Asia & Pacific Market Attractiveness Analysis by Functionality
  • Figure 116: South Asia & Pacific Market Value Share and BPS Analysis by Livestock, 2025 and 2035
  • Figure 117: South Asia & Pacific Market Y-o-Y Growth Comparison by Livestock, 2025 to 2035
  • Figure 118: South Asia & Pacific Market Attractiveness Analysis by Livestock
  • Figure 119: South Asia & Pacific Market Value Share and BPS Analysis by Sales Channel, 2025 and 2035
  • Figure 120: South Asia & Pacific Market Y-o-Y Growth Comparison by Sales Channel, 2025 to 2035
  • Figure 121: South Asia & Pacific Market Attractiveness Analysis by Sales Channel
  • Figure 122: South Asia & Pacific Market Value Share and BPS Analysis by Packaging Type, 2025 and 2035
  • Figure 123: South Asia & Pacific Market Y-o-Y Growth Comparison by Packaging Type, 2025 to 2035
  • Figure 124: South Asia & Pacific Market Attractiveness Analysis by Packaging Type
  • Figure 125: Middle East and Africa Market Value Share and BPS Analysis by Country, 2025 and 2035
  • Figure 126: Middle East and Africa Market Value Share and BPS Analysis by Composition, 2025 and 2035
  • Figure 127: Middle East and Africa Market Y-o-Y Growth Comparison by Composition, 2025 to 2035
  • Figure 128: Middle East and Africa Market Attractiveness Analysis by Composition
  • Figure 129: Middle East and Africa Market Value Share and BPS Analysis by Functionality, 2025 and 2035
  • Figure 130: Middle East and Africa Market Y-o-Y Growth Comparison by Functionality, 2025 to 2035
  • Figure 131: Middle East and Africa Market Attractiveness Analysis by Functionality
  • Figure 132: Middle East and Africa Market Value Share and BPS Analysis by Livestock, 2025 and 2035
  • Figure 133: Middle East and Africa Market Y-o-Y Growth Comparison by Livestock, 2025 to 2035
  • Figure 134: Middle East and Africa Market Attractiveness Analysis by Livestock
  • Figure 135: Middle East and Africa Market Value Share and BPS Analysis by Sales Channel, 2025 and 2035
  • Figure 136: Middle East and Africa Market Y-o-Y Growth Comparison by Sales Channel, 2025 to 2035
  • Figure 137: Middle East and Africa Market Attractiveness Analysis by Sales Channel
  • Figure 138: Middle East and Africa Market Value Share and BPS Analysis by Packaging Type, 2025 and 2035
  • Figure 139: Middle East and Africa Market Y-o-Y Growth Comparison by Packaging Type, 2025 to 2035
  • Figure 140: Middle East and Africa Market Attractiveness Analysis by Packaging Type
  • Figure 141: Global Market – Tier Structure Analysis
  • Figure 142: Global Market – Company Share Analysis

Frequently Asked Questions

What is the projected market value of the feed attractants market in 2025?

The projected market value of the feed attractants market in 2025 is USD 7.52 billion.

What is the forecast market value of the feed attractants market by 2035?

The forecast market value of the feed attractants market by 2035 is USD 17.16 billion.

What is the expected CAGR for the feed attractants market from 2025 to 2035?

The expected CAGR for the feed attractants market from 2025 to 2035 is 8.6%.

Which functionality will lead the feed attractants market in 2035?

Behaviour-modification functionality will lead the feed attractants market in 2035, with a 50% share.

Which country is expected to experience the highest growth in the feed attractants market?

India is expected to experience the highest growth in the industry, with a CAGR 10.2%.

Explore Similar Insights

Future Market Insights

Feed Attractants Market