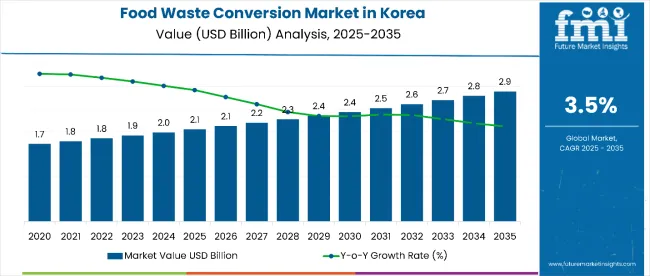
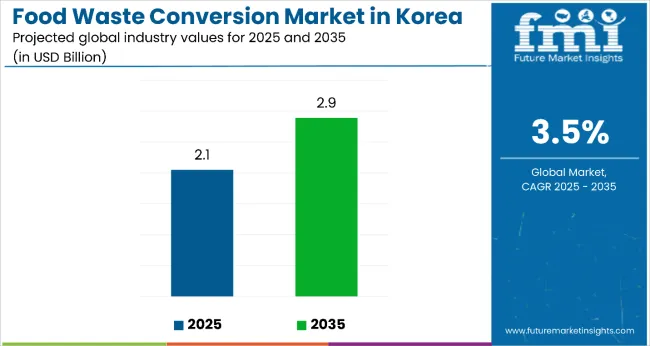
Sales of products from food waste in Korea are estimated at USD 2.1 billion in 2025 and are projected to reach USD 2.9 billion by 2035, reflecting a CAGR of approximately 3.5% over the forecast period.
| Metric | Value |
|---|---|
| Estimated Size (2025E) | USD 2.1 billion |
| Projected Value (2035F) | USD 2.9 billion |
| CAGR (2025 to 2035) | 3.5% |
This growth reflects expanding government support for environmental practices, increasing consumer awareness of ecological responsibility, and growing corporate investment in waste reduction technologies. The rise in demand is linked to regulatory initiatives like the food waste recycling law, technological progress in biorefining and fermentation, and evolving consumer preferences for upcycled food products. Regional development shows concentrated activity in South Gyeongsang, leveraging agricultural resources, North Jeolla focusing on farmer collaboration programs, and Jeju developing tourism-oriented environmental initiatives.
The largest contribution to demand continues to come from food processing applications, which are expected to account for 19% of total sales in 2025, owing to regulatory compliance requirements, cost-effective alternative materials, and enhanced product differentiation capabilities. By source material, citrus fruits represent a significant segment with an 8% share, driven by abundant byproduct availability from citrus processing operations and valuable compound extraction for cosmetics and functional foods.
Consumer adoption is particularly concentrated among environmentally conscious businesses seeking responsible alternatives and consumers demanding eco-friendly products. While processing costs remain considerations, continued research and development investments are improving efficiency and expanding product applications. Regional collaboration patterns are emerging, with South Gyeongsang excelling in agricultural waste utilization, North Jeolla leading in farmer partnership models, and Jeju developing tourism-integrated environmental programs that showcase ecological responsibility.
The food waste segment in Korea is classified into several categories. By source, the key materials include mango, apples, grapes, citrus fruits, carrots, beetroot, and other fruits and vegetables including berries. By end user, the segment spans food processing, beverage processing, cosmetics and personal care, animal feed, and other uses including dietary supplements and nutraceuticals. By region, coverage includes South Gyeongsang, North Jeolla, South Jeolla, Jeju, and the rest of Korea.
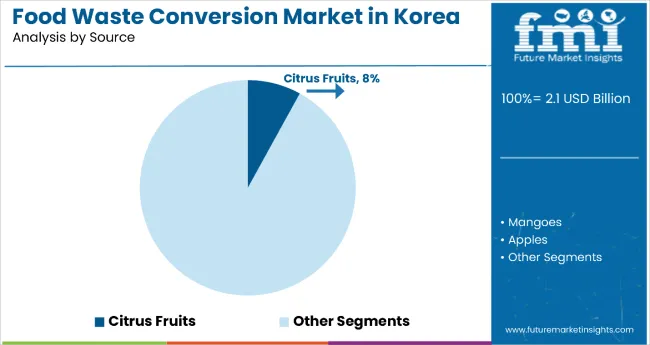
Citrus fruits are projected to drive significant value creation in 2025, supported by abundant byproduct availability from juice processing operations and established extraction technologies for valuable compounds. Other sources, such as mango, apples, and vegetables, are developing steadily, each serving distinct processing applications.
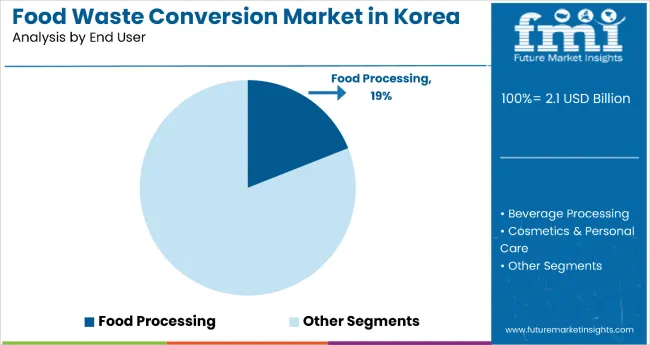
Products from food waste in Korea are utilized across diverse end user applications spanning multiple sectors. Food processing is expected to remain the primary end user in 2025, followed by animal feed and cosmetics applications. Utilization strategies are evolving to match regulatory requirements, with growth coming from both traditional and innovative applications.
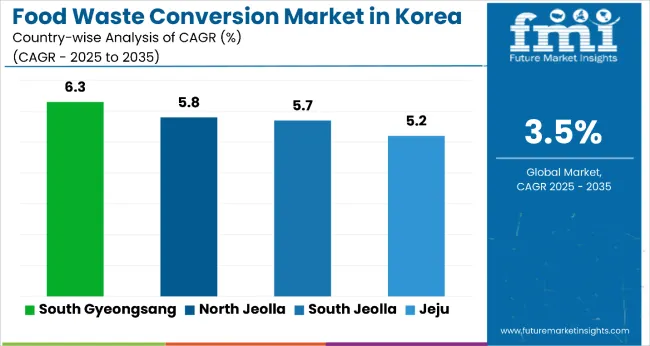
| Regions | CAGR (2025 to 2035) |
|---|---|
| South Gyeongsang | 6.3% |
| North Jeolla | 5.8% |
| South Jeolla | 5.7% |
| Jeju | 5.2% |
Products from food waste development will not progress uniformly across every region. Strong agricultural infrastructure and established waste processing networks in South Gyeongsang provide measurable advantages, while emerging regions develop capabilities from specialized applications and collaborative partnerships. The regional analysis shows distinct development patterns each area is expected to follow based on resource availability, infrastructure development, and economic priorities.
Between 2025 and 2035, South Gyeongsang is projected to record the highest CAGR at 6.3%, outpacing all other Korean regions in products from food waste utilization. This leadership is fueled by the region’s strong agricultural and fisheries base, enabling large-scale byproduct conversion from farming and seafood operations. Government-backed recycling initiatives and investment in processing infrastructure further strengthen its position.
North Jeolla, growing at 5.8%, follows closely, benefiting from structured collaboration between waste processors and farmers. Its emphasis on waste-to-energy projects and public awareness campaigns supports faster adoption, narrowing the growth gap with South Gyeongsang and positioning it as a strong regional contender.
South Jeolla is expected to grow at 5.7%, just behind North Jeolla, with strengths in integrated agricultural processing and responsible farming systems. Its role in supporting traditional farming communities aligns with broader circular economy goals. Jeju, at 5.2%, demonstrates slower growth but stands out for tourism-linked environmental projects, turning waste processing into a showcase for ecological responsibility.
While growth is more modest, its emphasis on hospitality partnerships and eco-entrepreneurship provides niche advantages. The rest of Korea, though not quantified here, is gaining traction through distributed processing networks and localized waste management initiatives, contributing to a balanced national growth outlook.
The products from food waste category serves diverse regional applications across resource utilization, economic development models, and environmental objectives. While motivations vary from waste reduction to economic opportunity to stewardship, development is concentrated across five key regional specializations. Each region brings distinct resource advantages, infrastructure capabilities, and collaboration approaches.
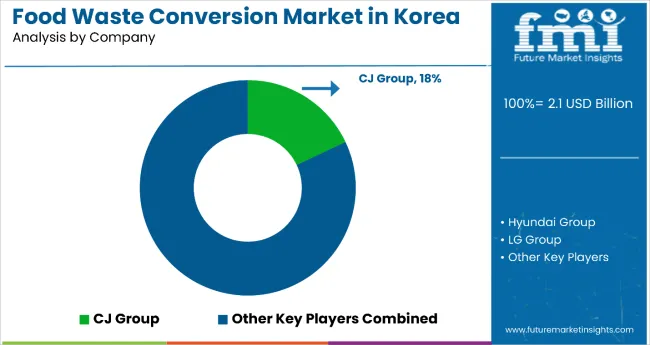
The competitive environment is characterized by a mix of established conglomerates, technology developers, and emerging environmentally focused enterprises. Processing scale and technology capabilities rather than product diversity remain the decisive success factors: the leading companies collectively process significant volumes of food waste annually and maintain comprehensive coverage across multiple application areas.
CJ Group represents a mature participant in food processing and waste management. The company operates comprehensive food processing operations, waste recycling facility development, and technology integration programs. Its approach includes large-scale processing infrastructure development, responsible supply chain integration, and research collaboration supporting circular economy principles while maintaining national coverage through established food operations and distribution networks.
Samsung C&T operates as a technology and infrastructure developer leveraging advanced engineering capabilities and research partnerships. The company focuses on innovative product development from food waste, partnership programs with research institutions, and technology commercialization supporting waste-to-product conversion. Operational capabilities include engineering expertise, technology development resources, and comprehensive project management supporting large-scale facility development.
Hyundai Green Food provides specialized processing solutions and product development services supporting diverse food waste applications. The company leverages food processing expertise and technology integration capabilities to develop comprehensive product lines including compost, fertilizer, and animal feed using advanced processing technologies. Recent initiatives focus on technology diversification and processing efficiency improvement.
Lotte Group develops integrated solutions combining retail operations, processing capabilities, and investment programs supporting food waste utilization. The company provides comprehensive investment programs for processing facility development, technology advancement supporting conversion efficiency, and retail integration enabling product distribution across established consumer networks.
SK Group specializes in technology development and energy applications supporting waste-to-energy conversion and advanced processing technologies. The company provides comprehensive technology solutions, energy system integration, and operational efficiency programs that ensure reliable processing and energy recovery from food waste streams.
Other significant players include Hanwha Group, LG Group, and Doosan Corporation, each focusing on specialized applications including engineering solutions, equipment manufacturing, and system integration. These companies contribute essential capabilities in technology development, operational services, and infrastructure development that support sector advancement across multiple applications and regions.
Academic partnerships through KIFST, KEITI, and KAIST provide ongoing innovation in processing technologies, product development, and efficiency optimization. Government initiatives through regulatory support and development programs expand processing capacity and application development, putting advancement pressure on traditional waste management approaches while supporting comprehensive circular economy implementation.
| Item | Value |
|---|---|
| Quantitative Units (2025) | 2.1 billion |
| Source | Mangoes, Apples, Grapes, Citrus Fruits, Carrots, Beetroot, Berries, Others |
| End User | Food Processing, Beverage Processing, Cosmetics & Personal Care, Dietary Supplements & Nutraceuticals, Animal Feed, Others |
| Regions Covered | South Gyeongsang, North Jeolla, South Jeolla, Jeju, Rest of Korea |
| Key Companies Profiled | ReHarvest, Ecoand, CJ CheilJedang Corp., Jrink Juicery, Misfit Foods, ReGrained LLC, Rise Products, Rubies in the Rubble, Snact Ltd., Toast Ale Ltd., Aeropowder, Bio-bean Ltd., and Circular Systems S.P.C. |
| Additional Attributes | Dollar sales by application and purity grade, regional demand trends, competitive landscape, consumer preferences for natural versus synthetic alternatives, integration with sustainable sourcing practices, innovations in extraction technology and quality standardization for diverse industrial applications |
In 2025, the total sales of products from food waste in Korea will be valued at USD 2.1 billion.
By 2035, the sales of products from food waste in Korea are forecasted to reach USD 2.9 billion, reflecting a CAGR of 3.5%.
Food processing leads the end-use segment with a 19% share in 2025, followed by animal feed and cosmetics applications.
South Gyeongsang and North Jeolla are expected to lead growth, with South Gyeongsang focusing on agricultural and fisheries waste, and North Jeolla on farmer collaboration programs.
Citrus fruits dominate the source material category with an 8% share in 2025.


Full Research Suite comprises of:
Market outlook & trends analysis
Interviews & case studies
Strategic recommendations
Vendor profiles & capabilities analysis
5-year forecasts
8 regions and 60+ country-level data splits
Market segment data splits
12 months of continuous data updates
DELIVERED AS:
PDF EXCEL ONLINE
Products from Food Waste Market Analysis - Size, Growth, and Forecast 2025 to 2035
Products from Food Waste in Japan - Size, Share, and Forecast Outlook 2025 to 2035
USA Products from Food Waste Market Growth – Trends, Demand & Outlook 2025-2035
Teff Products Market
Detox Products Market Analysis - Size, Share, and Forecast Outlook 2025 to 2035
Algae Products Market Analysis - Size, Share, and Forecast Outlook 2025 to 2035
Pulse Products Market Analysis - Size, Share, and Forecast Outlook 2025 to 2035
Dairy Products Market Analysis by Product Type, End Use, Distribution Channel and Region through 2035
Almond Products Market Size and Share Forecast Outlook 2025 to 2035
Bamboo Products Market Analysis – Trends & Growth 2025 to 2035
Luxury Products For Kids Market - Trends, Growth & Forecast 2025 to 2035
Chicory Products Market Size and Share Forecast Outlook 2025 to 2035
Crystal Products Market Size and Share Forecast Outlook 2025 to 2035
Suncare Products Market Size and Share Forecast Outlook 2025 to 2035
Ziplock Products Market Size and Share Forecast Outlook 2025 to 2035
Corn Co-Products Market
Global Moringa Products Market Outlook – Trends, Demand & Forecast 2025–2035
Make-Up Products Packaging Market Size and Share Forecast Outlook 2025 to 2035
Sun Care Products Market Analysis – Growth, Applications & Outlook 2025–2035
Car Care Products Market Trends - Growth, Demand & Analysis 2025 to 2035

Thank you!
You will receive an email from our Business Development Manager. Please be sure to check your SPAM/JUNK folder too.
Chat With
MaRIA