Functional Food Ingredients Market Size and Share Forecast Outlook 2025 to 2035

The functional food ingredients market is projected to grow from USD 12.06 billion in 2025 to USD 23.06 billion by 2035, implying a 6.7% CAGR during the forecast period.
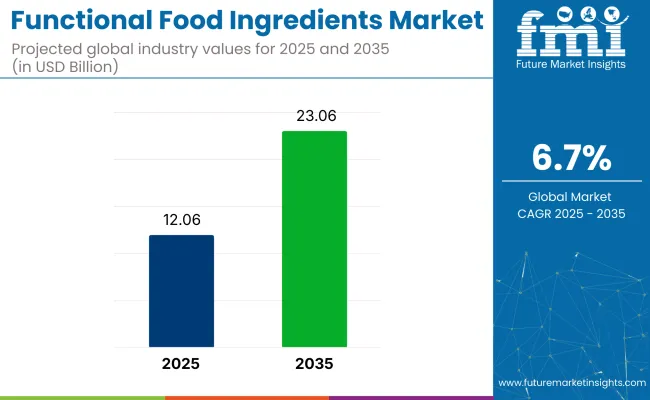
Quick Stats for Functional Food Ingredients Market

  • Market value (2025): USD 12.06 billion
  • Forecast value (2035): USD 23.06 billion
  • Forecast CAGR (2025 to 2035): 6.7%
  • Leading segment in 2035: Probiotics (≈ 37% share)
  • Key growth region: Asia Pacific
  • Leading country: India (CAGR 7.1%)
  • Key players: Kerry Group; Cargill, Incorporated; Archer Daniels Midland (ADM); DuPont Nutrition & Biosciences; Ingredion Incorporated

Functional Food Ingredients Market

Attribute Value
Industry Value (2025) USD 12.06 billion
Industry Value (2035) USD 23.06 billion
CAGR (2025 to 2035) 6.7%

Market progression has been reinforced by nutrition-forward reformulations that combine natural antioxidants, micronutrient fortifiers, and gut-health modifiers within finished foods. Probiotics are forecast to dominate, contributing 36.7% of share in 2025, because of documented benefits in digestive balance and immune modulation. Natural sources dominate input streams as formulators pivot toward botanical extracts, algal concentrates, and bio-fermented cultures that fit clean-label parameters.

Bakery and confectionery applications account for 25.8% of volume in the functional ingredients segment, primarily through the use of fiber-rich prebiotic blends that improve crumb texture and extend shelf life. In parallel, dairy alternatives and infant-nutrition categories are integrating lipid-soluble vitamins, plant-protein concentrates, and long-chain omega fatty acids to meet targeted nutritional profiles while avoiding common allergens.

Scaled manufacturing is supported by precision-controlled fermentation processes used to develop probiotics, alongside enzymatic platforms that enhance the absorption of plant-derived minerals. Technologies like spray-drying and micro encapsulation protect heat-sensitive compounds such as vitamins and polyphenols, making them easier to include in meal-replacement powders, fortified bakery items, and beverage systems.

Ongoing research keeps this category dynamic. A recent arXiv study introduced hierarchical plant-protein microcapsules capable of carrying both hydrophobic and hydrophilic nutraceuticals-broadening delivery options in beverage and supplement formats.

In terms of market overlap, functional ingredients account for 15-20% of the food ingredients market, 10-15% in food processing ingredients, 25-30% in the functional foods segment, 20-25% in health and wellness foods, and 5-10% in the plant-based food category. These shares reflect how health-oriented formulations are becoming integral across multiple product categories.

Analysis of Functional Food Ingredients Market by Top Investment Segments

Growth in 2025 centres on probiotic cultures, bakery-and-confectionery fortification, and natural-source inputs. Each focus area aligns with clinically validated health benefits, processing compatibility, and clean-label preferences, guiding contract manufacturing, formulation R&D, and branded-product launches across North American and European retail channels.
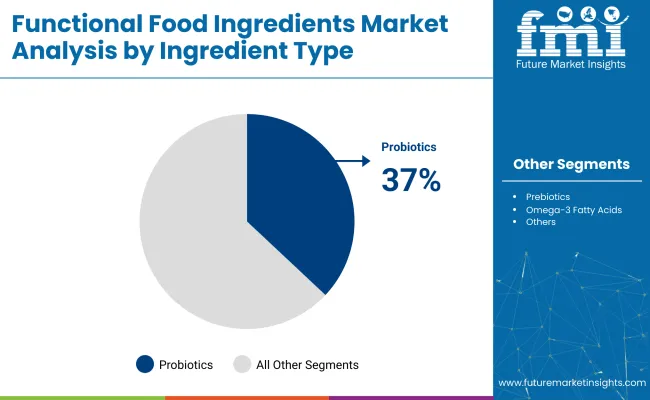
Probiotic Cultures Power Gut-Health Formulation Momentum

Functional Food Ingredients Market By Ingredient Type

Probiotics are projected to account for 36.7% of the functional ingredient market in 2025, supported by growing evidence for strain-specific benefits and better stability across diverse formats. Manufacturers are using encapsulated spores to maintain viability through heat-based processing methods like extrusion and pasteurization.

Strains with registered clinical data are being used to support health claims under FDA-compliant pathways. Cold-chain infrastructure is being upgraded to support live-culture beverages in co-packed formats, while synbiotic combinations with inulin help premium SKUs command higher price points. Shelf-stable probiotic tablets sold online are expanding category access beyond refrigerated channels.
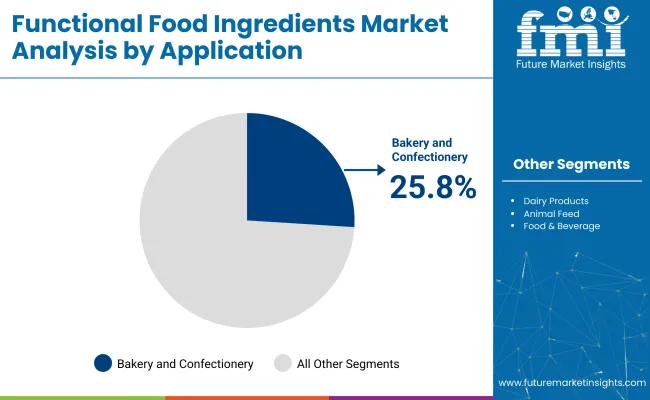
Bakery and Confectionery Integrate Functional Boosts for Everyday Treats

Functional Food Ingredients Market By Application

Bakery and confectionery hold a 25.8% market share in 2025 due to successful use of heat-tolerant functional systems. Probiotic strains now survive par-baking and ambient storage, while seed flours rich in omega fatty acids are improving nutritional value without affecting dough performance.

Formulators are blending is omaltulose with cocoa to lower glycemic impact in confections, and soluble-fiber syrups are improving moisture retention in sugar-reduced muffins. Allergen-free formats are supported by new depositor systems enabling protein bars made with fava concentrates in segregated lines.

Natural Ingredient Sourcing Fuels Clean-Label Product Expansion

Natural ingredients are expected to hold 60% of the market in 2025 as clean-label priorities continue to shape buying behavior. Botanical extracts and fermented concentrates are now replacing synthetic inputs across categories.

Turmeric oleores in standardized at 95% curcuminoids meets potency requirements for anti-inflammatory claims, while acerola juice replaces synthetic ascorbic acid in fruit-based snacks. Pea peptides produced through membrane ultrafiltration offer consistent profiles for protein shakes. Blockchain-linked sourcing is enabling QR-based origin verification, and high-pressure homogenization preserves taste and color in natural drinks without relying on artificial stabilizers.

Top Functional Food Ingredients Market Dynamics

Demand for nutrient-dense convenience food accelerates functional ingredient integration across manufacturing sectors. Cross-category processors seek solutions for cleaner labels and health claims, pushing enzyme, prebiotic, and lipid suppliers to tailor ingredient systems for exacting application environments.

Multipurpose Fortification Demands Catalyse Broad Ingredient Adoption

Adoption of functional proteins, resistant starches, and micro encapsulated omega-3 concentrates is being promoted across food and beverage processing lines to meet claim thresholds for fibre, immune support, and brain health. Retort-stable prebiotic inulin blends permit label-friendly viscosity in functional beverages, while heat-treated chickpea flour enriches dairy alternatives without emulsifier reliance.

Bakery enrichment projects now specify mineral-chelated iron systems that withstand proofing and oven stress. Infant nutrition products incorporate high-purity MCT oils combined with lactose-free carbohydrate matrices to support weight-gain protocols.

  • Meal kit formulators use dry-blended pea-soya protein for texture control.
  • Ready-to-drink coffee adopts plant phytosterols to support cholesterol health claims.
  • Ultra-high-temperature lines incorporate antioxidant tocopherols to limit off-flavor.

Personalised Platforms Unlock Niche Functional Ingredient Pipelines

Direct-to-consumer personal nutrition brands are partnering with contract dietary supplement manufacturers to deliver capsule and sachet formats personalised through digital biomarker feedback. Wellness product formulators now utilise liposomal curcumin and fermented mushroom beta-glucans, offering measurable bio availability surges documented through wearables.

Clinical nutrition sector contracts reward suppliers who provide patient-coded lot traceability for fat-soluble vitamin microbeads blended into enteral feeds. Investors are funding vertically integrated pilot plants producing targeted postbiotic concentrates for subscription refills.
  • DNA-guided supplement packs ship in thirty-day personalised assortments.
  • Liposomal vitamin D3 reaches 90 % dissolution in in-vitro models.
  • Subscription models bundle postbiotic sachets with quarterly microbiome testing.

Top Countries Manufacturing, Formulating, and Commercializing Functional Food Ingredients

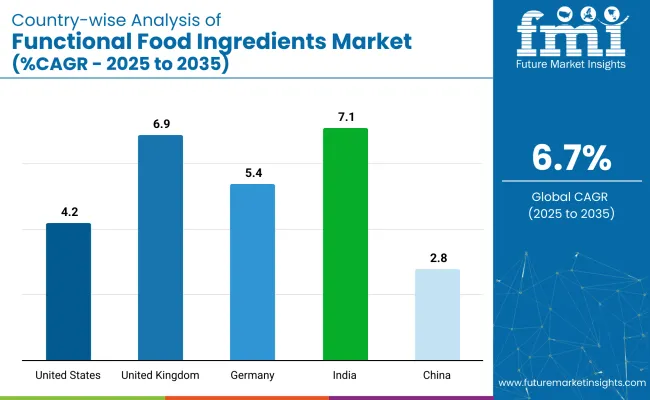
Country Wise Analysis Of Functional Food Ingredients Market

The report covers detailed analysis of 40+ countries and the top five countries have been shared as a reference.

Countries CAGR (2025 to 2035)
United States 4.2 %
United Kingdom 6.9 %
Germany 5.4 %
India 7.1 %
China 2.8 %

The industry is forecasted to grow at a CAGR of 6.7%. India’s momentum is driven by millet fortification, chickpea proteins, and ayurvedic extracts entering packaged snacks. China lags at 2.8 % amid cautious retail spending and slow approvals for imported probiotics.

OECD peers-the United Kingdom (6.9 %), Germany (5.4 %), and the United States (4.2 %)-operate at a 0.63-1.03x clip against the 6.7 % global mean. The United Kingdom benefits from fibre-enrichment targets in bakery chains; Germany advances via gut-health cultures for sports nutrition; the United States sees plateauing pea-protein demand in meal-replacement beverages. As the category adds over USD 5 billion by 2035, high-growth and high-value regions will shape its trajectory.

Growth Analysis of Functional Food Ingredients in the United States

Functional food ingredient demand in the United States is growing with a 4.2% CAGR. It is being led by heightened interest in digestive wellness, muscle repair, and label transparency. Brands are modifying traditional recipes by incorporating plant-based isolates, fermented amino blends, and gut-supportive cultures.

Regulatory alignment has encouraged fiber and omega fortification across meal kits and convenience snacks. Mass retailers are segmenting shelves by functional claims, while sports-nutrition brands continue to diversify into general wellness. Domestic sourcing of ingredients has been prioritized to reinforce supply continuity and local identity. The market is projected to grow at a CAGR of 4.2% from 2025 to 2035.

  • Probiotic-rich spreads and refrigerated dips are replacing synthetic-labeled alternatives across natural retailers
  • Direct-to-consumer brands are using protein personalization tools to build customer-specific blends
  • Updated FDA guidance has pushed fiber-focused cereal innovations into mainstream formats

Future Outlook for Functional Food Ingredient Demand in the United Kingdom

In the United Kingdom, the projected 6.9% CAGR through 2035 reflects a combination of reformulation mandates and retailer pressure to improve product nutrition profiles. High-fat and high-sugar food categories are being redesigned with resistant starches, bioactive fibers, and advanced sweetener alternatives.

Functional waters and nootropic drinks have gained listings in convenience outlets. Locally sourced ingredients are increasingly prioritized to maintain transparency amid import instability. Regulatory nudges, advertising limits, and digital grocery platform adjustments have reinforced the shift toward nutrient-rich packaged options.

  • Front-of-pack scoring systems have accelerated fiber-boosting recipe revisions in cereal and bakery
  • Prebiotic sodas and mushroom-blended teas are occupying wellness shelf space in e-grocery channels
  • Reformulated protein bars with stevia and added botanicals are gaining traction under HFSS compliance

Demand Forecast for Functional Food Ingredients Adoption in Germany

Germany’s functional food ingredient growth at 5.4% CAGR is rooted in clinical validation and structured retail channels. Pharmacies and health shops stock collagen, omega-3s, and flavonoid-rich products, blending pharmaceutical credibility with food convenience.

Regional suppliers have ramped up fermented actives, while bakery and dairy categories have embraced traceable vitamin fortification. Product development across cities such as Cologne and Munich continues to favor clean-label and nutrient-dense profiles. Packaged wellness food has been positioned as both a health intervention and a premium indulgence.

  • Health chains have scaled probiotic yogurts that deliver therapeutic doses through high-shelf standards
  • Omega blends from algae are increasingly used in regional dairy and beverage reformulations
  • Fermented vitamin K2 and flavonoid-based concentrates are enabling low-dose health-positioned foods

Functional Food Ingredient Sales Analysis in India

India’s functional food ingredients market is projected to rise at 7.1% CAGR, reflecting deep integration of botanicals into modern packaged formats. Herbal extracts like moringa, tulsi, and ashwagandha are being infused into snacks, beverages, and gummies aimed at daily wellness.

Domestic protein concentrate production has gained momentum, reducing the cost burden for clean-label manufacturers. Functional ingredient claims have been supported by evolving nutraceutical rules that favor clinically backed formulations. Social influencers and wellness-centric retail sections are expanding consumer access across metros and Tier-II cities.

  • Ayurveda-inspired RTD beverages and protein gummies are now mainstream in organized retail chains
  • Domestic processors are converting pulses into functional protein isolates used in fortified flours
  • Brand partnerships with medical professionals are enabling strong functional benefit narratives

Analysis of Functional Food Ingredients in China

China’s 2.8% CAGR of functional food ingredients reflects a complex regulatory landscape and slow approval cycles for health-positioned products. Fortified foods must comply with stringent certification rules, prompting many companies to explore online cross-border strategies.

Domestic brands in the dairy and traditional Chinese medicine space are using functional fungi, peptides, and probiotics to align with established consumer trust systems. Government-backed campaigns are promoting micronutrient enrichment in daily staples, while ingredient innovation remains concentrated in higher-tier cities.

  • Imported functional snacks and beverages are tested online before seeking domestic certification
  • Traditional Chinese medicine firms blend botanicals and protein peptides in new functional beverage formats
  • Provincial initiatives have introduced functional wheat strains and selenium-enriched staples through public nutrition drives

Key Suppliers in the Industry

The industry is competitive, with top players like Kerry Group, Cargill, Archer Daniels Midland (ADM), and DuPont Nutrition & Biosciences driving innovation through extensive R&D and product diversification. These companies focus on expanding their functional ingredient offerings, targeting health-conscious consumers and enhancing their presence across food, beverage, and dietary supplement sectors.

Ingredion and Tate & Lyle pursue growth by developing tailor-made solutions for specific applications like probiotics and fibers. BASF SE, Royal DSM, and Glanbiahave strategic partnerships, acquisitions, and expanding production capacity. The industryis fragmented, with large players holding good shares while numerous smaller companies innovate in niche regions, intensifying competition.

Recent Industry News

  • Cornell Hemp Webinar series introduced hemp-based protein and fiber ingredients, stressing on novel emulsification and allergen alternatives in February 2025. It stressed on practical adoption for functional Ingredient innovation in clean-label, plant-based formulation.
  • Illinois Bioengineering’s “TastePepAI” AI-platform (Feb 2025) enables de novo design of taste peptides (sweet, salty, umami), expanding functional ingredient protein portfolios and speeding safety-validated flavor development.

Key Players

  • Kerry Group
  • Cargill, Incorporated
  • Archer Daniels Midland (ADM)
  • DuPont Nutrition & Biosciences
  • Ingredion Incorporated
  • Tate & Lyle PLC
  • BASF SE
  • Royal DSM
  • Arla Foods Ingredients
  • Chr. Hansen Holding A/S
  • Glanbia plc
  • FrieslandCampina
  • Roquette Frères
  • Naturex (acquired by Givaudan)
  • Kemin Industries, Inc.
  • Bioriginal Food & Science Corp.
  • Sabinsa Corporation
  • Nutraceutical International Corporation
  • AIDP, Inc.
  • Brenntag Group
  • Others

Report Coverage and Scope Summary

Report Attributes Key Insights
Estimated Market Value (2025) USD 12.06 billion
Projected Market Value (2035) USD 23.06 billion
CAGR (2025 to 2035) 6.7%
Base Year for Estimation 2024
Historical Period 2020 to 2024
Forecast Period 2025 to 2035
Quantitative Units Revenue in USD billion
Ingredient Type Probiotics, Prebiotics, Proteins & Amino Acids, Phytochemicals & Plant Extracts, Omega-3 Fatty Acids, Carotenoids, Fibers & Specialty Carbohydrates
Source Natural, Synthetic
Application Food & Beverage, Dairy Products, Bakery & Confectionery, Animal Feed
Regions North America, Latin America, Europe, East Asia, South Asia, Oceania, Middle East & Africa
Countries Covered United States, Canada, Mexico, Brazil, Argentina, Germany, France, United Kingdom, Italy, Spain, Netherlands, China, India, Japan, South Korea, ANZ, GCC Countries, South Africa
Key Players Kerry Group, Cargill, Incorporated, Archer Daniels Midland (ADM), DuPont Nutrition & Biosciences, Ingredion Incorporated, Tate & Lyle PLC, BASF SE, Royal DSM, Arla Foods Ingredients, Chr. Hansen Holding A/S, Glanbia plc, FrieslandCampina, Roquette Frères, Naturex (acquired by Givaudan), Kemin Industries, Inc., Bioriginal Food & Science Corp., Sabinsa Corporation, Nutraceutical International Corporation, AIDP, Inc., Brenntag Group, Others
Additional Attributes Dollar sales, CAGR trends, ingredient type distribution, size preferences, price range segmentation, competitor dollar sales & market share, regional growth patterns

Key Segments

By Ingredient Type:

Probiotics, prebiotics, proteins and amino acids, phytochemicals and plant extracts, omega-3 fatty acids, carotenoids, fibers and specialty carbohydrates.

By Source:

Natural, synthetic.

By Application:

Food and beverage, dairy products, bakery and confectionery, animal feed.

By Region:

North America, Latin America, Europe, East Asia, South Asia, Oceania, Middle East & Africa.

Table of Content

  1. Executive Summary
    • Global Market Outlook
    • Demand-side Trends
    • Supply-side Trends
    • Technology Roadmap Analysis
    • Analysis and Recommendations
  2. Market Overview
    • Market Coverage / Taxonomy
    • Market Definition / Scope / Limitations
  3. Market Background
    • Market Dynamics
      • Drivers
      • Restraints
      • Opportunity
      • Trends
    • Scenario Forecast
      • Demand in Optimistic Scenario
      • Demand in Likely Scenario
      • Demand in Conservative Scenario
    • Opportunity Map Analysis
    • Product Life Cycle Analysis
    • Supply Chain Analysis
      • Supply Side Participants and their Roles
        • Producers
        • Mid-Level Participants (Traders/ Agents/ Brokers)
        • Wholesalers and Distributors
      • Value Added and Value Created at Node in the Supply Chain
      • List of Raw Material Suppliers
      • List of Existing and Potential Buyer’s
    • Investment Feasibility Matrix
    • Value Chain Analysis
      • Profit Margin Analysis
      • Wholesalers and Distributors
      • Retailers
    • PESTLE and Porter’s Analysis
    • Regulatory Landscape
      • By Key Regions
      • By Key Countries
    • Regional Parent Market Outlook
    • Production and Consumption Statistics
    • Import and Export Statistics
  4. Global Market Analysis 2020 to 2024 and Forecast, 2025 to 2035
    • Historical Market Size Value (USD Billion) & Volume (MT) Analysis, 2020 to 2024
    • Current and Future Market Size Value (USD Billion) & Volume (MT) Projections, 2025 to 2035
      • Y-o-Y Growth Trend Analysis
      • Absolute $ Opportunity Analysis
  5. Global Market Pricing Analysis 2020 to 2024 and Forecast 2025 to 2035
  6. Global Market Analysis 2020 to 2024 and Forecast 2025 to 2035, By Ingredient Type
    • Introduction / Key Findings
    • Historical Market Size Value (USD Billion) & Volume (MT) Analysis By Ingredient Type, 2020 to 2024
    • Current and Future Market Size Value (USD Billion) & Volume (MT) Analysis and Forecast By Ingredient Type, 2025 to 2035
      • Probiotics
      • Prebiotics
      • Proteins and amino acids
      • Phytochemicals and plant extracts
      • Omega-3 fatty acids
      • Carotenoids
      • Fibers and specialty carbohydrates
    • Y-o-Y Growth Trend Analysis By Ingredient Type, 2020 to 2024
    • Absolute $ Opportunity Analysis By Ingredient Type, 2025 to 2035
  7. Global Market Analysis 2020 to 2024 and Forecast 2025 to 2035, By Source
    • Introduction / Key Findings
    • Historical Market Size Value (USD Billion) & Volume (MT) Analysis By Source, 2020 to 2024
    • Current and Future Market Size Value (USD Billion) & Volume (MT) Analysis and Forecast By Source, 2025 to 2035
      • Natural
      • Synthetic
    • Y-o-Y Growth Trend Analysis By Source, 2020 to 2024
    • Absolute $ Opportunity Analysis By Source, 2025 to 2035
  8. Global Market Analysis 2020 to 2024 and Forecast 2025 to 2035, By Application
    • Introduction / Key Findings
    • Historical Market Size Value (USD Billion) & Volume (MT) Analysis By Application, 2020 to 2024
    • Current and Future Market Size Value (USD Billion) & Volume (MT) Analysis and Forecast By Application, 2025 to 2035
      • Food and beverage
      • Dairy products
      • Bakery and confectionery
      • Animal feed
    • Y-o-Y Growth Trend Analysis By Application, 2020 to 2024
    • Absolute $ Opportunity Analysis By Application, 2025 to 2035
  9. Global Market Analysis 2020 to 2024 and Forecast 2025 to 2035, By Region
    • Introduction
    • Historical Market Size Value (USD Billion) & Volume (MT) Analysis By Region, 2020 to 2024
    • Current Market Size Value (USD Billion) & Volume (MT) Analysis and Forecast By Region, 2025 to 2035
      • North America
      • Latin America
      • Western Europe
      • Eastern Europe
      • East Asia
      • South Asia & Pacific
      • Middle East and Africa
    • Market Attractiveness Analysis By Region
  10. North America Market Analysis 2020 to 2024 and Forecast 2025 to 2035, By Country
    • Historical Market Size Value (USD Billion) & Volume (MT) Trend Analysis By Market Taxonomy, 2020 to 2024
    • Market Size Value (USD Billion) & Volume (MT) Forecast By Market Taxonomy, 2025 to 2035
      • By Country
        • USA
        • Canada
        • Mexico
      • By Ingredient Type
      • By Source
      • By Application
    • Market Attractiveness Analysis
      • By Country
      • By Ingredient Type
      • By Source
      • By Application
    • Key Takeaways
  11. Latin America Market Analysis 2020 to 2024 and Forecast 2025 to 2035, By Country
    • Historical Market Size Value (USD Billion) & Volume (MT) Trend Analysis By Market Taxonomy, 2020 to 2024
    • Market Size Value (USD Billion) & Volume (MT) Forecast By Market Taxonomy, 2025 to 2035
      • By Country
        • Brazil
        • Argentina
        • Rest of LATAM
      • By Ingredient Type
      • By Source
      • By Application
    • Market Attractiveness Analysis
      • By Country
      • By Ingredient Type
      • By Source
      • By Application
    • Key Takeaways
  12. Western Europe Market Analysis 2020 to 2024 and Forecast 2025 to 2035, By Country
    • Historical Market Size Value (USD Billion) & Volume (MT) Trend Analysis By Market Taxonomy, 2020 to 2024
    • Market Size Value (USD Billion) & Volume (MT) Forecast By Market Taxonomy, 2025 to 2035
      • By Country
        • Germany
        • Italy
        • France
        • UK
        • Spain
        • BENELUX
        • Nordic
        • Rest of W.Europe
      • By Ingredient Type
      • By Source
      • By Application
    • Market Attractiveness Analysis
      • By Country
      • By Ingredient Type
      • By Source
      • By Application
    • Key Takeaways
  13. Eastern Europe Market Analysis 2020 to 2024 and Forecast 2025 to 2035, By Country
    • Historical Market Size Value (USD Billion) & Volume (MT) Trend Analysis By Market Taxonomy, 2020 to 2024
    • Market Size Value (USD Billion) & Volume (MT) Forecast By Market Taxonomy, 2025 to 2035
      • By Country
        • Russia
        • Hungary
        • Poland
        • Balkan & Baltics
        • Rest of E. Europe
      • By Ingredient Type
      • By Source
      • By Application
    • Market Attractiveness Analysis
      • By Country
      • By Ingredient Type
      • By Source
      • By Application
    • Key Takeaways
  14. East Asia Market Analysis 2020 to 2024 and Forecast 2025 to 2035, By Country
    • Historical Market Size Value (USD Billion) & Volume (MT) Trend Analysis By Market Taxonomy, 2020 to 2024
    • Market Size Value (USD Billion) & Volume (MT) Forecast By Market Taxonomy, 2025 to 2035
      • By Country
        • China
        • Japan
        • South Korea
      • By Ingredient Type
      • By Source
      • By Application
    • Market Attractiveness Analysis
      • By Country
      • By Ingredient Type
      • By Source
      • By Application
    • Key Takeaways
  15. South Asia & Pacific Market Analysis 2020 to 2024 and Forecast 2025 to 2035, By Country
    • Historical Market Size Value (USD Billion) & Volume (MT) Trend Analysis By Market Taxonomy, 2020 to 2024
    • Market Size Value (USD Billion) & Volume (MT) Forecast By Market Taxonomy, 2025 to 2035
      • By Country
        • India
        • Australia & New Zealand
        • ASEAN
        • Rest of SAP
      • By Ingredient Type
      • By Source
      • By Application
    • Market Attractiveness Analysis
      • By Country
      • By Ingredient Type
      • By Source
      • By Application
    • Key Takeaways
  16. Middle East and Africa Market Analysis 2020 to 2024 and Forecast 2025 to 2035, By Country
    • Historical Market Size Value (USD Billion) & Volume (MT) Trend Analysis By Market Taxonomy, 2020 to 2024
    • Market Size Value (USD Billion) & Volume (MT) Forecast By Market Taxonomy, 2025 to 2035
      • By Country
        • GCC Countries
        • Northern Africa
        • South Africa
        • Turkiye
        • Rest of MEA
      • By Ingredient Type
      • By Source
      • By Application
    • Market Attractiveness Analysis
      • By Country
      • By Ingredient Type
      • By Source
      • By Application
    • Key Takeaways
  17. Key Countries Market Analysis
    • USA
      • Pricing Analysis
      • Market Share Analysis, 2024
        • By Ingredient Type
        • By Source
        • By Application
    • Canada
      • Pricing Analysis
      • Market Share Analysis, 2024
        • By Ingredient Type
        • By Source
        • By Application
    • Brazil
      • Pricing Analysis
      • Market Share Analysis, 2024
        • By Ingredient Type
        • By Source
        • By Application
    • Mexico
      • Pricing Analysis
      • Market Share Analysis, 2024
        • By Ingredient Type
        • By Source
        • By Application
    • Argentina
      • Pricing Analysis
      • Market Share Analysis, 2024
        • By Ingredient Type
        • By Source
        • By Application
  18. Market Structure Analysis
    • Competition Dashboard
    • Competition Benchmarking
    • Market Share Analysis of Top Players
      • By Regional
      • By Ingredient Type
      • By Source
      • By Application
  19. Competition Analysis
    • Competition Deep Dive
      • Kerry Group
        • Overview
        • Product Portfolio
        • Profitability by Market Segments (Product/Age /Sales Channel/Region)
        • Sales Footprint
        • Strategy Overview
          • Marketing Strategy
          • Product Strategy
          • Channel Strategy
      • Cargill, Incorporated
        • Overview
        • Product Portfolio
        • Profitability by Market Segments (Product/Age /Sales Channel/Region)
        • Sales Footprint
        • Strategy Overview
          • Marketing Strategy
          • Product Strategy
          • Channel Strategy
      • Archer Daniels Midland (ADM)
        • Overview
        • Product Portfolio
        • Profitability by Market Segments (Product/Age /Sales Channel/Region)
        • Sales Footprint
        • Strategy Overview
          • Marketing Strategy
          • Product Strategy
          • Channel Strategy
      • DuPont Nutrition & Biosciences
        • Overview
        • Product Portfolio
        • Profitability by Market Segments (Product/Age /Sales Channel/Region)
        • Sales Footprint
        • Strategy Overview
          • Marketing Strategy
          • Product Strategy
          • Channel Strategy
      • Ingredion Incorporated
        • Overview
        • Product Portfolio
        • Profitability by Market Segments (Product/Age /Sales Channel/Region)
        • Sales Footprint
        • Strategy Overview
          • Marketing Strategy
          • Product Strategy
          • Channel Strategy
      • Tate & Lyle PLC
        • Overview
        • Product Portfolio
        • Profitability by Market Segments (Product/Age /Sales Channel/Region)
        • Sales Footprint
        • Strategy Overview
          • Marketing Strategy
          • Product Strategy
          • Channel Strategy
      • BASF SE
        • Overview
        • Product Portfolio
        • Profitability by Market Segments (Product/Age /Sales Channel/Region)
        • Sales Footprint
        • Strategy Overview
          • Marketing Strategy
          • Product Strategy
          • Channel Strategy
      • Royal DSM
        • Overview
        • Product Portfolio
        • Profitability by Market Segments (Product/Age /Sales Channel/Region)
        • Sales Footprint
        • Strategy Overview
          • Marketing Strategy
          • Product Strategy
          • Channel Strategy
      • Arla Foods Ingredients
        • Overview
        • Product Portfolio
        • Profitability by Market Segments (Product/Age /Sales Channel/Region)
        • Sales Footprint
        • Strategy Overview
          • Marketing Strategy
          • Product Strategy
          • Channel Strategy
      • Chr. Hansen Holding A/S
        • Overview
        • Product Portfolio
        • Profitability by Market Segments (Product/Age /Sales Channel/Region)
        • Sales Footprint
        • Strategy Overview
          • Marketing Strategy
          • Product Strategy
          • Channel Strategy
      • Glanbia plc
        • Overview
        • Product Portfolio
        • Profitability by Market Segments (Product/Age /Sales Channel/Region)
        • Sales Footprint
        • Strategy Overview
          • Marketing Strategy
          • Product Strategy
          • Channel Strategy
      • FrieslandCampina
        • Overview
        • Product Portfolio
        • Profitability by Market Segments (Product/Age /Sales Channel/Region)
        • Sales Footprint
        • Strategy Overview
          • Marketing Strategy
          • Product Strategy
          • Channel Strategy
      • Roquette Frères
        • Overview
        • Product Portfolio
        • Profitability by Market Segments (Product/Age /Sales Channel/Region)
        • Sales Footprint
        • Strategy Overview
          • Marketing Strategy
          • Product Strategy
          • Channel Strategy
      • Naturex (acquired by Givaudan)
        • Overview
        • Product Portfolio
        • Profitability by Market Segments (Product/Age /Sales Channel/Region)
        • Sales Footprint
        • Strategy Overview
          • Marketing Strategy
          • Product Strategy
          • Channel Strategy
      • Kemin Industries, Inc.
        • Overview
        • Product Portfolio
        • Profitability by Market Segments (Product/Age /Sales Channel/Region)
        • Sales Footprint
        • Strategy Overview
          • Marketing Strategy
          • Product Strategy
          • Channel Strategy
      • Bioriginal Food & Science Corp.
        • Overview
        • Product Portfolio
        • Profitability by Market Segments (Product/Age /Sales Channel/Region)
        • Sales Footprint
        • Strategy Overview
          • Marketing Strategy
          • Product Strategy
          • Channel Strategy
      • Sabinsa Corporation
        • Overview
        • Product Portfolio
        • Profitability by Market Segments (Product/Age /Sales Channel/Region)
        • Sales Footprint
        • Strategy Overview
          • Marketing Strategy
          • Product Strategy
          • Channel Strategy
      • Nutraceutical International Corporation
        • Overview
        • Product Portfolio
        • Profitability by Market Segments (Product/Age /Sales Channel/Region)
        • Sales Footprint
        • Strategy Overview
          • Marketing Strategy
          • Product Strategy
          • Channel Strategy
      • AIDP, Inc.
        • Overview
        • Product Portfolio
        • Profitability by Market Segments (Product/Age /Sales Channel/Region)
        • Sales Footprint
        • Strategy Overview
          • Marketing Strategy
          • Product Strategy
          • Channel Strategy
      • Brenntag Group
        • Overview
        • Product Portfolio
        • Profitability by Market Segments (Product/Age /Sales Channel/Region)
        • Sales Footprint
        • Strategy Overview
          • Marketing Strategy
          • Product Strategy
          • Channel Strategy
  20. Assumptions & Acronyms Used
  21. Research Methodology

List of Tables

  • Table 1: Global Market Value (USD Billion) Forecast by Region, 2020-2035
  • Table 2: Global Market Volume (MT) Forecast by Region, 2020-2035
  • Table 3: Global Market Value (USD Billion) Forecast by Ingredient Type, 2020-2035
  • Table 4: Global Market Volume (MT) Forecast by Ingredient Type, 2020-2035
  • Table 5: Global Market Value (USD Billion) Forecast by Source, 2020-2035
  • Table 6: Global Market Volume (MT) Forecast by Source, 2020-2035
  • Table 7: Global Market Value (USD Billion) Forecast by Application, 2020-2035
  • Table 8: Global Market Volume (MT) Forecast by Application, 2020-2035
  • Table 9: North America Market Value (USD Billion) Forecast by Country, 2020-2035
  • Table 10: North America Market Volume (MT) Forecast by Country, 2020-2035
  • Table 11: North America Market Value (USD Billion) Forecast by Ingredient Type, 2020-2035
  • Table 12: North America Market Volume (MT) Forecast by Ingredient Type, 2020-2035
  • Table 13: North America Market Value (USD Billion) Forecast by Source, 2020-2035
  • Table 14: North America Market Volume (MT) Forecast by Source, 2020-2035
  • Table 15: North America Market Value (USD Billion) Forecast by Application, 2020-2035
  • Table 16: North America Market Volume (MT) Forecast by Application, 2020-2035
  • Table 17: Latin America Market Value (USD Billion) Forecast by Country, 2020-2035
  • Table 18: Latin America Market Volume (MT) Forecast by Country, 2020-2035
  • Table 19: Latin America Market Value (USD Billion) Forecast by Ingredient Type, 2020-2035
  • Table 20: Latin America Market Volume (MT) Forecast by Ingredient Type, 2020-2035
  • Table 21: Latin America Market Value (USD Billion) Forecast by Source, 2020-2035
  • Table 22: Latin America Market Volume (MT) Forecast by Source, 2020-2035
  • Table 23: Latin America Market Value (USD Billion) Forecast by Application, 2020-2035
  • Table 24: Latin America Market Volume (MT) Forecast by Application, 2020-2035
  • Table 25: Western Europe Market Value (USD Billion) Forecast by Country, 2020-2035
  • Table 26: Western Europe Market Volume (MT) Forecast by Country, 2020-2035
  • Table 27: Western Europe Market Value (USD Billion) Forecast by Ingredient Type, 2020-2035
  • Table 28: Western Europe Market Volume (MT) Forecast by Ingredient Type, 2020-2035
  • Table 29: Western Europe Market Value (USD Billion) Forecast by Source, 2020-2035
  • Table 30: Western Europe Market Volume (MT) Forecast by Source, 2020-2035
  • Table 31: Western Europe Market Value (USD Billion) Forecast by Application, 2020-2035
  • Table 32: Western Europe Market Volume (MT) Forecast by Application, 2020-2035
  • Table 33: Eastern Europe Market Value (USD Billion) Forecast by Country, 2020-2035
  • Table 34: Eastern Europe Market Volume (MT) Forecast by Country, 2020-2035
  • Table 35: Eastern Europe Market Value (USD Billion) Forecast by Ingredient Type, 2020-2035
  • Table 36: Eastern Europe Market Volume (MT) Forecast by Ingredient Type, 2020-2035
  • Table 37: Eastern Europe Market Value (USD Billion) Forecast by Source, 2020-2035
  • Table 38: Eastern Europe Market Volume (MT) Forecast by Source, 2020-2035
  • Table 39: Eastern Europe Market Value (USD Billion) Forecast by Application, 2020-2035
  • Table 40: Eastern Europe Market Volume (MT) Forecast by Application, 2020-2035
  • Table 41: East Asia Market Value (USD Billion) Forecast by Country, 2020-2035
  • Table 42: East Asia Market Volume (MT) Forecast by Country, 2020-2035
  • Table 43: East Asia Market Value (USD Billion) Forecast by Ingredient Type, 2020-2035
  • Table 44: East Asia Market Volume (MT) Forecast by Ingredient Type, 2020-2035
  • Table 45: East Asia Market Value (USD Billion) Forecast by Source, 2020-2035
  • Table 46: East Asia Market Volume (MT) Forecast by Source, 2020-2035
  • Table 47: East Asia Market Value (USD Billion) Forecast by Application, 2020-2035
  • Table 48: East Asia Market Volume (MT) Forecast by Application, 2020-2035
  • Table 49: South Asia & Pacific Market Value (USD Billion) Forecast by Country, 2020-2035
  • Table 50: South Asia & Pacific Market Volume (MT) Forecast by Country, 2020-2035
  • Table 51: South Asia & Pacific Market Value (USD Billion) Forecast by Ingredient Type, 2020-2035
  • Table 52: South Asia & Pacific Market Volume (MT) Forecast by Ingredient Type, 2020-2035
  • Table 53: South Asia & Pacific Market Value (USD Billion) Forecast by Source, 2020-2035
  • Table 54: South Asia & Pacific Market Volume (MT) Forecast by Source, 2020-2035
  • Table 55: South Asia & Pacific Market Value (USD Billion) Forecast by Application, 2020-2035
  • Table 56: South Asia & Pacific Market Volume (MT) Forecast by Application, 2020-2035
  • Table 57: Middle East and Africa Market Value (USD Billion) Forecast by Country, 2020-2035
  • Table 58: Middle East and Africa Market Volume (MT) Forecast by Country, 2020-2035
  • Table 59: Middle East and Africa Market Value (USD Billion) Forecast by Ingredient Type, 2020-2035
  • Table 60: Middle East and Africa Market Volume (MT) Forecast by Ingredient Type, 2020-2035
  • Table 61: Middle East and Africa Market Value (USD Billion) Forecast by Source, 2020-2035
  • Table 62: Middle East and Africa Market Volume (MT) Forecast by Source, 2020-2035
  • Table 63: Middle East and Africa Market Value (USD Billion) Forecast by Application, 2020-2035
  • Table 64: Middle East and Africa Market Volume (MT) Forecast by Application, 2020-2035

List of Figures

  • Figure 1: Global Market Volume (MT) Forecast 2020-2035
  • Figure 2: Global Market Pricing Analysis
  • Figure 3: Global Market Value (USD Billion) Forecast 2020-2035
  • Figure 4: Global Market Value Share and BPS Analysis by Ingredient Type, 2025 and 2035
  • Figure 5: Global Market Y-o-Y Growth Comparison by Ingredient Type, 2025-2035
  • Figure 6: Global Market Attractiveness Analysis by Ingredient Type
  • Figure 7: Global Market Value Share and BPS Analysis by Source, 2025 and 2035
  • Figure 8: Global Market Y-o-Y Growth Comparison by Source, 2025-2035
  • Figure 9: Global Market Attractiveness Analysis by Source
  • Figure 10: Global Market Value Share and BPS Analysis by Application, 2025 and 2035
  • Figure 11: Global Market Y-o-Y Growth Comparison by Application, 2025-2035
  • Figure 12: Global Market Attractiveness Analysis by Application
  • Figure 13: Global Market Value (USD Billion) Share and BPS Analysis by Region, 2025 and 2035
  • Figure 14: Global Market Y-o-Y Growth Comparison by Region, 2025-2035
  • Figure 15: Global Market Attractiveness Analysis by Region
  • Figure 16: North America Market Incremental $ Opportunity, 2025-2035
  • Figure 17: Latin America Market Incremental $ Opportunity, 2025-2035
  • Figure 18: Western Europe Market Incremental $ Opportunity, 2025-2035
  • Figure 19: Eastern Europe Market Incremental $ Opportunity, 2025-2035
  • Figure 20: East Asia Market Incremental $ Opportunity, 2025-2035
  • Figure 21: South Asia & Pacific Market Incremental $ Opportunity, 2025-2035
  • Figure 22: Middle East and Africa Market Incremental $ Opportunity, 2025-2035
  • Figure 23: North America Market Value Share and BPS Analysis by Country, 2025 and 2035
  • Figure 24: North America Market Value Share and BPS Analysis by Ingredient Type, 2025 and 2035
  • Figure 25: North America Market Y-o-Y Growth Comparison by Ingredient Type, 2025-2035
  • Figure 26: North America Market Attractiveness Analysis by Ingredient Type
  • Figure 27: North America Market Value Share and BPS Analysis by Source, 2025 and 2035
  • Figure 28: North America Market Y-o-Y Growth Comparison by Source, 2025-2035
  • Figure 29: North America Market Attractiveness Analysis by Source
  • Figure 30: North America Market Value Share and BPS Analysis by Application, 2025 and 2035
  • Figure 31: North America Market Y-o-Y Growth Comparison by Application, 2025-2035
  • Figure 32: North America Market Attractiveness Analysis by Application
  • Figure 33: Latin America Market Value Share and BPS Analysis by Country, 2025 and 2035
  • Figure 34: Latin America Market Value Share and BPS Analysis by Ingredient Type, 2025 and 2035
  • Figure 35: Latin America Market Y-o-Y Growth Comparison by Ingredient Type, 2025-2035
  • Figure 36: Latin America Market Attractiveness Analysis by Ingredient Type
  • Figure 37: Latin America Market Value Share and BPS Analysis by Source, 2025 and 2035
  • Figure 38: Latin America Market Y-o-Y Growth Comparison by Source, 2025-2035
  • Figure 39: Latin America Market Attractiveness Analysis by Source
  • Figure 40: Latin America Market Value Share and BPS Analysis by Application, 2025 and 2035
  • Figure 41: Latin America Market Y-o-Y Growth Comparison by Application, 2025-2035
  • Figure 42: Latin America Market Attractiveness Analysis by Application
  • Figure 43: Western Europe Market Value Share and BPS Analysis by Country, 2025 and 2035
  • Figure 44: Western Europe Market Value Share and BPS Analysis by Ingredient Type, 2025 and 2035
  • Figure 45: Western Europe Market Y-o-Y Growth Comparison by Ingredient Type, 2025-2035
  • Figure 46: Western Europe Market Attractiveness Analysis by Ingredient Type
  • Figure 47: Western Europe Market Value Share and BPS Analysis by Source, 2025 and 2035
  • Figure 48: Western Europe Market Y-o-Y Growth Comparison by Source, 2025-2035
  • Figure 49: Western Europe Market Attractiveness Analysis by Source
  • Figure 50: Western Europe Market Value Share and BPS Analysis by Application, 2025 and 2035
  • Figure 51: Western Europe Market Y-o-Y Growth Comparison by Application, 2025-2035
  • Figure 52: Western Europe Market Attractiveness Analysis by Application
  • Figure 53: Eastern Europe Market Value Share and BPS Analysis by Country, 2025 and 2035
  • Figure 54: Eastern Europe Market Value Share and BPS Analysis by Ingredient Type, 2025 and 2035
  • Figure 55: Eastern Europe Market Y-o-Y Growth Comparison by Ingredient Type, 2025-2035
  • Figure 56: Eastern Europe Market Attractiveness Analysis by Ingredient Type
  • Figure 57: Eastern Europe Market Value Share and BPS Analysis by Source, 2025 and 2035
  • Figure 58: Eastern Europe Market Y-o-Y Growth Comparison by Source, 2025-2035
  • Figure 59: Eastern Europe Market Attractiveness Analysis by Source
  • Figure 60: Eastern Europe Market Value Share and BPS Analysis by Application, 2025 and 2035
  • Figure 61: Eastern Europe Market Y-o-Y Growth Comparison by Application, 2025-2035
  • Figure 62: Eastern Europe Market Attractiveness Analysis by Application
  • Figure 63: East Asia Market Value Share and BPS Analysis by Country, 2025 and 2035
  • Figure 64: East Asia Market Value Share and BPS Analysis by Ingredient Type, 2025 and 2035
  • Figure 65: East Asia Market Y-o-Y Growth Comparison by Ingredient Type, 2025-2035
  • Figure 66: East Asia Market Attractiveness Analysis by Ingredient Type
  • Figure 67: East Asia Market Value Share and BPS Analysis by Source, 2025 and 2035
  • Figure 68: East Asia Market Y-o-Y Growth Comparison by Source, 2025-2035
  • Figure 69: East Asia Market Attractiveness Analysis by Source
  • Figure 70: East Asia Market Value Share and BPS Analysis by Application, 2025 and 2035
  • Figure 71: East Asia Market Y-o-Y Growth Comparison by Application, 2025-2035
  • Figure 72: East Asia Market Attractiveness Analysis by Application
  • Figure 73: South Asia & Pacific Market Value Share and BPS Analysis by Country, 2025 and 2035
  • Figure 74: South Asia & Pacific Market Value Share and BPS Analysis by Ingredient Type, 2025 and 2035
  • Figure 75: South Asia & Pacific Market Y-o-Y Growth Comparison by Ingredient Type, 2025-2035
  • Figure 76: South Asia & Pacific Market Attractiveness Analysis by Ingredient Type
  • Figure 77: South Asia & Pacific Market Value Share and BPS Analysis by Source, 2025 and 2035
  • Figure 78: South Asia & Pacific Market Y-o-Y Growth Comparison by Source, 2025-2035
  • Figure 79: South Asia & Pacific Market Attractiveness Analysis by Source
  • Figure 80: South Asia & Pacific Market Value Share and BPS Analysis by Application, 2025 and 2035
  • Figure 81: South Asia & Pacific Market Y-o-Y Growth Comparison by Application, 2025-2035
  • Figure 82: South Asia & Pacific Market Attractiveness Analysis by Application
  • Figure 83: Middle East and Africa Market Value Share and BPS Analysis by Country, 2025 and 2035
  • Figure 84: Middle East and Africa Market Value Share and BPS Analysis by Ingredient Type, 2025 and 2035
  • Figure 85: Middle East and Africa Market Y-o-Y Growth Comparison by Ingredient Type, 2025-2035
  • Figure 86: Middle East and Africa Market Attractiveness Analysis by Ingredient Type
  • Figure 87: Middle East and Africa Market Value Share and BPS Analysis by Source, 2025 and 2035
  • Figure 88: Middle East and Africa Market Y-o-Y Growth Comparison by Source, 2025-2035
  • Figure 89: Middle East and Africa Market Attractiveness Analysis by Source
  • Figure 90: Middle East and Africa Market Value Share and BPS Analysis by Application, 2025 and 2035
  • Figure 91: Middle East and Africa Market Y-o-Y Growth Comparison by Application, 2025-2035
  • Figure 92: Middle East and Africa Market Attractiveness Analysis by Application
  • Figure 93: Global Market - Tier Structure Analysis
  • Figure 94: Global Market - Company Share Analysis

Frequently Asked Questions

What is the projected valuation of functional food ingredients in 2025?

The projected valuation of functional food ingredients in 2025 is USD 12.06 billion.

What is the forecast valuation for functional food ingredients by 2035?

The forecast valuation for functional food ingredients by 2035 is USD 23.06 billion.

What is the projected CAGR for the functional food ingredients market from 2025 to 2035?

The functional food ingredients market is projected to grow at a CAGR of 6.7% from 2025 to 2035.

What segment is expected to lead the functional food ingredients market in 2035?

Probiotics are expected to lead the functional food ingredients market in 2035, contributing around 37% of the share.

Which country is expected to experience the highest growth?

India is expected to experience the highest growth, with a 7.1% CAGR.

Explore Similar Insights

Future Market Insights

Functional Food Ingredients Market