Functional Chewing Gum Market Size and Share Forecast Outlook 2025 to 2035

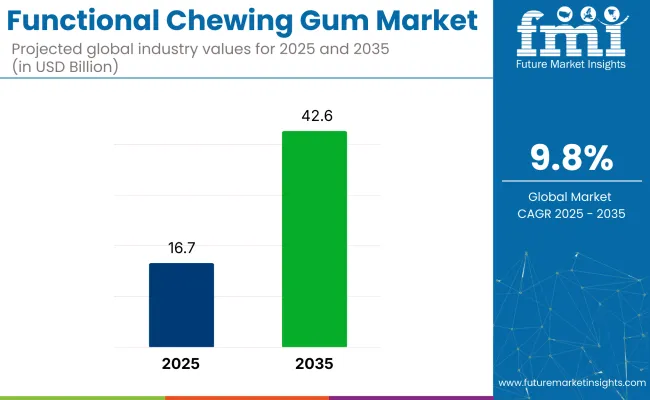
The functional chewing gum market is anticipated to rise from USD 16.7 billion in 2025 to USD 42.6 billion by 2035, reflecting a 9.8% CAGR. Growth is being shaped by time-constrained consumers seeking fast, discreet wellness delivery that bypasses pills, water, and calorie intake.
Quick Stats of Functional Chewing Gum Market

  • Market Value (2025): USD 16.7 billion
  • Forecast Value (2035): USD 42.6 billion
  • Forecast CAGR (2025 to 2035): 9.8%
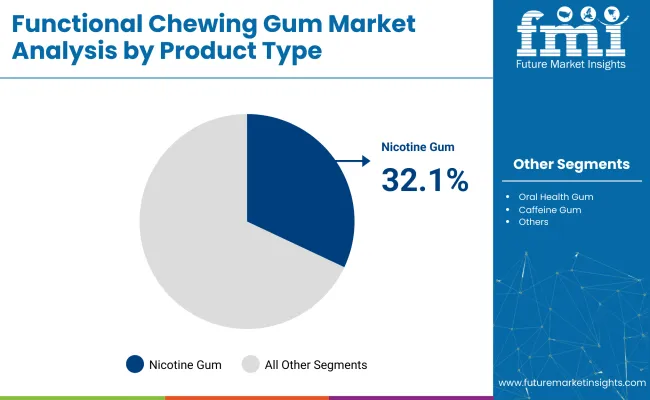
  • Leading Segment in 2025: Nicotine Gum (32.1% share)
  • Key Growth Region: Asia Pacific (India is the fastest growing segment with 7.0% CAGR)
  • Key Players: Mars, Incorporated, Mondelez International, Lotte, Perfetti Van Melle, Cloetta, Hager & Werken, GSK (Nicotinell), Military Energy Gum, ZOFT Gum, Lemon Pharma.

Functional Chewing Gum Market

Attribute Value
Industry Value (2025) USD 16.7 billion
Industry Value (2035) USD 42.6 billion
CAGR (2025 to 2035) 9.8%

Regulatory clearance for actives like nicotine, caffeine, and vitamins has added legitimacy, while endorsements from dental and sports bodies have expanded its acceptance. These shifts have positioned functional gum between impulse and planned routines, with presence growing across pharmacies, gyms, c-stores, and D2C platforms. The format now serves both snack aisles and supplement categories, offering formulation flexibility, habitual repeat usage, and cross-category visibility-core features fueling its future scale.

The industry holds for a projected 11-13% share of the global nutraceuticals market, 4-6% within dietary supplements, and roughly 2-3% of the wider functional foods and beverages category. In the oral care products market, its presence is still nascent at under 2%, though growing through anti-cavity and whitening gums.

Within the broader confectionery space, it represents 6-8%, driven by a shift from sugar-based indulgence to health-positioned formulations. Its cross-category appeal allows it to draw revenue from adjacent sectors without fully displacing traditional delivery systems.

This hybrid identity has created marketing flexibility, enabling brands to position gums as both wellness aids and snack alternatives. That overlap is fueling its inclusion across pharmacy, fitness, and grocery aisles.

Production in the functional chewing gum market is being transformed by repurposing equipment from the pharmaceutical sector. Facilities that once made transdermal patches are now being used to produce thin films, which are cut into small, porous gum pellets.

This change lowers capital costs by about 38% compared to installing traditional gum extrusion lines. It also makes it easier to include heat-sensitive ingredients like probiotics and saffron-based actives with consistent dosing.

Early studies from Nordic clinics show that vitamin B12 delivered through gum can result in 15% higher absorption in the body compared to lozenges with the same dose. This gives brands more room to make health claims while using less of the ingredients.

These upgraded production lines also use laser scoring, which lets manufacturers switch between different product types-like caffeine and melatonin gums-in under 45 minutes. As a result, companies can quickly produce custom batches. This type of backend efficiency is becoming a key driver of profit margins and speed to market.

Analysis of Functional Chewing Gum Market by Top Investment Segments 

Nicotine gum has emerged as the leading product type, driven by its clinical credibility, regulatory backing, and growing use in smoking cessation programs. Online channels dominate sales due to their accessibility, personalization, and ability to directly connect consumers with specialized functional gum offerings.
Nicotine Gum is Projected to Lead Product Type with a 32.1% Market Share

Functional Chewing Gum Market By Product Type

Nicotine gum is expected to hold 32.1% of functional chewing gum revenue in 2025, driven by its well-established use in smoking cessation. Approval from regulatory bodies like the FDA and EMA has positioned it as a medically recognized product, giving it access to pharmacy shelves and even insurance coverage in some markets.
  • Advances in coating and flavor-masking technology have improved taste and ensured controlled release, which increases user compliance.
  • Government-backed anti-smoking campaigns and subsidies for cessation aid continue to support demand in high-income countries.
  • Growing awareness of heart health in middle-income regions is expanding usage through digital pharmacy platforms.

Online Channels is Expected to Lead Sales Channels with 26.8% Share in 2025

Functional Chewing Gum Market By Sales Channel

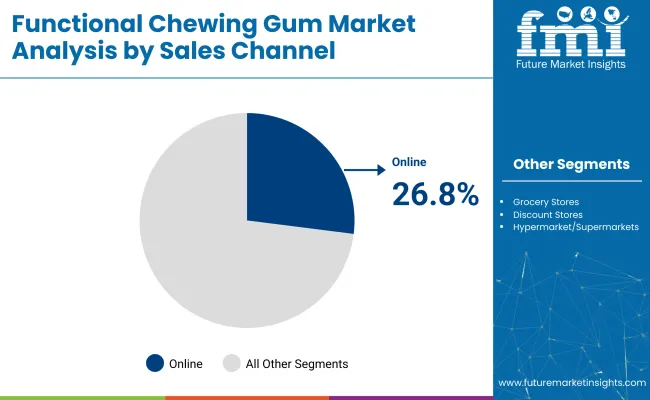
Online platforms are forecasted to account for 26.8% of total sales in 2025, reflecting a change in how consumers prefer to access wellness products. Buyers are moving away from in-store purchases and toward websites that offer clear ingredient information, detailed product comparisons, and targeted claims.

  • Subscription-based models have become especially popular for products like CBD, melatonin, and nootropic gums.
  • Selling online also allows brands to avoid retail markups and speak directly to consumers about dosage and benefits, helping build loyalty and repeat purchases.

Top Functional Chewing Gum Market Dynamics

Functional chewing gum is gaining traction as a credible therapeutic format, supported by regulatory approvals and controlled-release delivery systems. Direct-to-consumer channels and low-touch logistics are accelerating growth through personalized access, efficient fulfillment, and subscription-driven engagement.

Therapeutic Format Gains Credibility Through Clinical and Regulatory Endorsement

Functional chewing gum is evolving into a recognized therapeutic format, supported by clinical data and regulatory approvals. With nicotine and caffeine already approved for gum-based delivery by agencies like the FDA and EMA, the format has moved beyond novelty and into the healthcare space.

This endorsement has enabled wider pharmacy distribution and made reimbursement possible in some markets. As more actives such as melatonin, CBD, and probiotics are formulated into gum, investor focus has shifted from flavor development to science-backed claims. Compliance is being reinforced through controlled-release systems and accurate dosing, validated in absorption studies, which improves user trust and repeat use.

Supply Chain Shift Favors DTC and Low-Touch Digital Distribution

The supply chain for functional chewing gum is adapting to direct-to-consumer demand. Shoppers increasingly want targeted wellness products without going through retail stores. Online platforms enable fast feedback, faster reformulations, and better targeting for goals like focus, stress relief, or sleep.

Brands are using subscription models to drive regular use, and the money saved by skipping retail margins is being redirected into higher-quality ingredients. Lightweight, shelf-stable gum formats offer a lower shipping cost per unit compared to pills or drinks. SEO and influencer-driven marketing are reducing barriers to trial and helping brands scale efficiently online.
Analysis of Top Countries Exporting and Supplying Functional Chewing Gum Globally

Country Wise Analysis Of Functional Chewing Gum Market

The report covers a detailed analysis of 40+ countries and the top five countries have been shared as a reference.

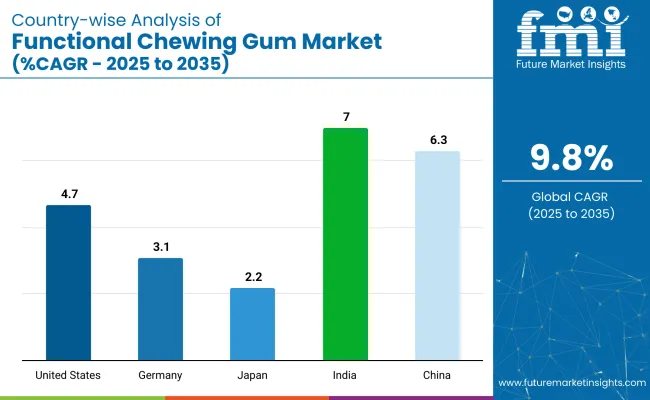
Countries CAGR (2025 to 2035)
United States 4.7%
Germany 3.1%
Japan 2.2%
China 6.3%
India 7.0%

The functional chewing gum industry, forecast to grow globally at a CAGR of 9.8% between 2025 and 2035, is showing divergent growth trajectories across major economies. The United States, an OECD member, is expected to expand at 4.7%, supported by regulatory-backed nicotine gums and growing demand for stress and energy variants across pharmacy, retail, and e-commerce formats.

Germany and Japan, both part of the OECD, are set to grow at 3.1% and 2.2% respectively. In Germany, clean-label and sugar-free formats are gaining traction through trusted pharmacy channels, while Japan is seeing gradual uptake in oral care and memory-support gums among its aging population.

Faster growth is projected in BRICS economies, with China forecast at 6.3% and India at 7.0%. China’s growth stems from digital-first wellness behaviors, where beauty, detox, and cognitive gum formulations are flourishing on platforms like Tmall and JD.com. India’s expansion is fueled by rising demand for Ayurvedic and nicotine-based gums, growing retail reach, and mobile-driven consumer engagement.

The USA Functional Chewing Gum Market Analysis and Growth Outlook

The USA functional chewing gum market is estimated to grow at 4.7% CAGR during the forecast period. Expansion in the USA has been attributed to behavioral health trends, clinical integration of nicotine-replacement therapy, and wide availability through omnichannel retail formats.

Consumers are increasingly choosing gums for energy, stress relief, and immunity boosts in place of traditional supplements. Pharmaceutical chains and health-focused convenience outlets have broadened shelf space for caffeine and melatonin-based gums.

National advertising campaigns have normalized functional gums in fitness, travel, and workplace settings, particularly with discrete and zero-calorie formats. FDA approval of specific actives for chewing gum has legitimized health claims, while post-COVID wellness priorities have reshaped consumer loyalty.

  • Gum adoption aided by integration into health insurance benefits
  • Pharmacies and gyms stocking multiple function-specific SKUs
  • Post-pandemic focus on stress relief and immune support through convenient dosing

Germany Functional Chewing Gum Industry Expansion

Germany’s functional chewing gum industry is expected to register a 3.1% CAGR from 2025 to 2035.Germany’s progress in this segment stems from its dense pharmacy network, public trust in science-backed health products, and strong dental association advocacy for sugar-free formats.

Functional gums that support oral health, vitamin intake, or nicotine withdrawal are positioned as compliant with national health guidelines. Reformhaus and apothecary channels promote gums with botanicals, probiotics, or vegan actives, while local private-label lines have gained traction due to traceability claims and clean-label credentials.

Gum formats have appealed to German consumers seeking alternatives to tablets and lozenges, especially among older demographics wary of swallowing pills. Marketing has leaned on bio availability and low sugar content, aligning with Germany’s preventive-health narrative.

  • Pharmacy-led trust environment favors clinical-format supplements
  • Clean-label and sugar-free credentials resonate with German shoppers
  • Vegan and botanical-based gums gaining shelf space in Reformhaus channels

China Functional Chewing Gum Market Expansion

China’s functional chewing gum market is forecast to expand at a CAGR of 6.3% between 2025 and 2035, rising health awareness among young professionals, coupled with a cultural preference for functional formats in portable packaging, is driving gum uptake. Local e-commerce platforms such as Tmall and JD.com feature a growing range of imported and domestic functional gums for beauty, cognitive enhancement, and weight control.

Collagen-boosting gums and detox blends appeal to urban wellness-conscious consumers, while nicotine gums are gaining traction as smoking rates remain high among men. Regulatory easing for functional ingredients in gum form has encouraged cross-border brand entries, especially from Japan and South Korea. Integration with health-tracking apps and WeChat-based wellness programs has accelerated repeat purchase behavior

  • E-commerce drives functional gum discovery and repurchase
  • Collagen, nootropic, and slimming blends dominate urban demand
  • Government support for health foods expanding formulation scope

Japan Functional Chewing Gum Industry Growth

Japan is projected to see its functional chewing gum market increase at 2.2% CAGR through 2035.Japan’s conservative pace reflects saturation in traditional confectionery and limited consumer exposure to therapeutic gum formats.

However, functional gums are gradually being adopted as a wellness tool among aging populations, particularly for oral care, memory support, and sleep enhancement. Japanese manufacturers are emphasizing dental function, anti-bacterial claims, and probiotic content to align with national dental-care policies.

The country’s high compliance with daily routines has created opportunity for timed gum regimens, morning energy, midday focus, and nighttime relaxation. Distribution has been concentrated in convenience stores, drugstores, and commuter kiosks, with QR-linked traceability gaining attention. Refinement in chewing experience and flavor modulation is expected to shape premium segments.

  • Anti-bacterial and oral health benefits central to product positioning
  • Aging population fuels demand for memory and sleep-support variants
  • C-Store and drugstore formats key to high-frequency purchases

India Functional Chewing Gum Market Insights

India’s functional chewing gum industry is projected to grow at a CAGR of 7.0% during the forecast timeline.India’s growth trajectory stems from increased awareness of functional nutrition, a rise in digital wellness content, and the availability of gums as affordable alternatives to capsules or beverages. Youth-focused formulations, such as caffeine, ginseng, and mood-regulating botanicals, are gaining popularity, particularly in metros and Tier-2 cities.

The country’s high smoking prevalence has also fueled nicotine gum demand, supported by government cessation campaigns and broader pharmacy penetration. Local brands and D2C startups are leveraging Instagram and WhatsApp commerce to engage younger buyers, especially with Ayurvedic and vegan ingredients that align with cultural dietary preferences. Functional gums are also being integrated into fitness centers and workplace wellness kits.

  • Smoking-cessation gums scaled through government and pharma tie-ins.
  • Ayurvedic and plant-based gums tailored for culturally aligned benefits.
  • High engagement from Gen Z via mobile-first marketing and D2C sales.

Leading Functional Chewing Gum Suppliers

The functional chewing gum sector is shaped by global confectionery giants and specialized innovators targeting therapeutic formats, wellness delivery, and nicotine replacement. Companies like Mars, Incorporated, Mondelez International, and Lotte have expanded beyond traditional gum to launch function-specific SKUs for energy, immunity, and oral care.

Perfetti Van Melle and Cloetta leverage extensive retail networks to distribute botanical and vitamin-infused gums across Europe and Asia. Medical-focused brands such as GSK (Nicotinell) and Hager & Werken focus on smoking cessation and dental applications with clinically validated formulations.

Niche entrants like Military Energy Gum, ZOFT Gum, and Lemon Pharma are gaining momentum by offering caffeine-based, CBD-infused, and natural ingredient formats through direct-to-consumer platforms, appealing to younger, health-conscious consumers across North America and Europe.

Recent Functional Chewing Gum Industry News

  • In January 2024, Mars announced a major overhaul of its flagship gum brands (Orbit, Extra, Freedent, Yida) with the launch of the new global brand platform "Chew You Good," repositioning these products into the holistic wellness space

Leading Players

  • Mars, Incorporated
  • Mondelez International
  • Lotte
  • Perfetti Van Melle
  • Cloetta
  • Hager & Werken
  • GSK (Nicotinell)
  • Military Energy Gum
  • ZOFT Gum
  • Lemon Pharma

Report Coverage and Scope Summary

Report Attributes Details
Market Size (2025) USD 16.7 billion
Projected Market Size (2035) USD 42.6 billion
CAGR (2025 to 2035) 9.8%
Base Year for Estimation 2024
Historical Period 2020 to 2024
Projections Period 2025 to 2035
Quantitative Units USD billion for value
Product Type Analyzed (Segment 1) Oral Health Gum, Nicotine Gum, Caffeine Gum, Weight Management Gum, CBD-Infused Gum, Functional Ingredients Gum, Sugar-Free Gum, Memory and Focus Gum.
Sales Channel Analyzed (Segment 2) Hypermarket/Supermarkets, Grocery Stores, Discount Stores, Online Sales.
Regions Covered North America, Europe, Asia Pacific, Middle East & Africa, Latin America
Countries Covered United States, Canada, Germany, United Kingdom, France, Italy, Spain, China, Japan, South Korea, India, Australia, Brazil, Mexico, Argentina, Saudi Arabia, UAE, South Africa
Key Players Mars, Incorporated, Mondelez International, Lotte, Perfetti Van Melle, Cloetta, Hager & Werken, GSK ( Nicotinell ), Military Energy Gum, ZOFT Gum, Lemon Pharma.
Additional Attributes Dollar sales, share by product type, ingredient trends, top-performing regions, consumer demographics, regulatory shifts, sales channel performance, and competitive positioning across formats.

Key Segments

By Product Type:

The industry is segmented into oral health gum, nicotine gum, caffeine gum, weight management gum, CBD-infused gum, functional ingredients gum, sugar-free gum, memory and focus gum.

By Sales Channel:

The industry is segmented into hypermarket/supermarkets, grocery stores, discount stores, online sales.

By Region:

The industry covers regions including North America, Europe, Asia Pacific, Latin America, and the Middle East & Africa.

Table of Content

  1. Executive Summary
    • Global Market Outlook
    • Demand-side Trends
    • Supply-side Trends
    • Technology Roadmap Analysis
    • Analysis and Recommendations
  2. Market Overview
    • Market Coverage/Taxonomy
    • Market Definition/Scope/Limitations
  3. Market Background
    • Market Dynamics
      • Drivers
      • Restraints
      • Opportunity
      • Trends
    • Scenario Forecast
      • Demand in Optimistic Scenario
      • Demand in Likely Scenario
      • Demand in Conservative Scenario
    • Opportunity Map Analysis
    • Product Life Cycle Analysis
    • Supply Chain Analysis
      • Supply Side Participants and their Roles
        • Producers
        • Mid-Level Participants (Traders/ Agents/ Brokers)
        • Wholesalers and Distributors
      • Value Added and Value Created at Node in the Supply Chain
      • List of Raw Material Suppliers
      • List of Existing and Potential Buyer’s
    • Investment Feasibility Matrix
    • Value Chain Analysis
      • Profit Margin Analysis
      • Wholesalers and Distributors
      • Retailers
    • PESTLE and Porter’s Analysis
    • Regulatory Landscape
      • By Key Regions
      • By Key Countries
    • Regional Parent Market Outlook
    • Production and Consumption Statistics
    • Import and Export Statistics
  4. Global Market Analysis 2020 to 2024 and Forecast, 2025 to 2035
    • Historical Market Size Value (USD Billion) & Volume (Metric tons) Analysis, 2020 to 2024
    • Current and Future Market Size Value (USD Billion) & Volume (Metric tons) Projections, 2025 to 2035
      • Y-o-Y Growth Trend Analysis
      • Absolute $ Opportunity Analysis
  5. Global Market Pricing Analysis 2020 to 2024 and Forecast 2025 to 2035
  6. Global Market Analysis 2020 to 2024 and Forecast 2025 to 2035, By Product Type
    • Introduction/Key Findings
    • Historical Market Size Value (USD Billion) & Volume (Metric tons) Analysis By Product Type, 2020 to 2024
    • Current and Future Market Size Value (USD Billion) & Volume (Metric tons) Analysis and Forecast By Product Type, 2025 to 2035
      • Oral Health Gum
      • Nicotine Gum
      • Caffeine Gum
      • Weight Management Gum
      • CBD-infused Gum
      • Functional Ingredients Gum
      • Sugar-free Gum
      • Memory and Focus Gum
    • Y-o-Y Growth Trend Analysis By Product Type, 2020 to 2024
    • Absolute $ Opportunity Analysis By Product Type, 2025 to 2035
  7. Global Market Analysis 2020 to 2024 and Forecast 2025 to 2035, By Sales Channel
    • Introduction/Key Findings
    • Historical Market Size Value (USD Billion) & Volume (Metric tons) Analysis By Sales Channel, 2020 to 2024
    • Current and Future Market Size Value (USD Billion) & Volume (Metric tons) Analysis and Forecast By Sales Channel, 2025 to 2035
      • Hypermarket/ Supermarkets
      • Grocery Stores
      • Discount stores
      • Online Sales
    • Y-o-Y Growth Trend Analysis By Sales Channel, 2020 to 2024
    • Absolute $ Opportunity Analysis By Sales Channel, 2025 to 2035
  8. Global Market Analysis 2020 to 2024 and Forecast 2025 to 2035, By Region
    • Introduction
    • Historical Market Size Value (USD Billion) & Volume (Metric tons) Analysis By Region, 2020 to 2024
    • Current Market Size Value (USD Billion) & Volume (Metric tons) Analysis and Forecast By Region, 2025 to 2035
      • North America
      • Latin America
      • Western Europe
      • Eastern Europe
      • East Asia
      • South Asia & Pacific
      • Middle East and Africa
    • Market Attractiveness Analysis By Region
  9. North America Market Analysis 2020 to 2024 and Forecast 2025 to 2035, By Country
    • Historical Market Size Value (USD Billion) & Volume (Metric tons) Trend Analysis By Market Taxonomy, 2020 to 2024
    • Market Size Value (USD Billion) & Volume (Metric tons) Forecast By Market Taxonomy, 2025 to 2035
      • By Country
        • USA
        • Canada
        • Mexico
      • By Product Type
      • By Sales Channel
    • Market Attractiveness Analysis
      • By Country
      • By Product Type
      • By Sales Channel
    • Key Takeaways
  10. Latin America Market Analysis 2020 to 2024 and Forecast 2025 to 2035, By Country
    • Historical Market Size Value (USD Billion) & Volume (Metric tons) Trend Analysis By Market Taxonomy, 2020 to 2024
    • Market Size Value (USD Billion) & Volume (Metric tons) Forecast By Market Taxonomy, 2025 to 2035
      • By Country
        • Brazil
        • Argentina
        • Rest of LATAM
      • By Product Type
      • By Sales Channel
    • Market Attractiveness Analysis
      • By Country
      • By Product Type
      • By Sales Channel
    • Key Takeaways
  11. Western Europe Market Analysis 2020 to 2024 and Forecast 2025 to 2035, By Country
    • Historical Market Size Value (USD Billion) & Volume (Metric tons) Trend Analysis By Market Taxonomy, 2020 to 2024
    • Market Size Value (USD Billion) & Volume (Metric tons) Forecast By Market Taxonomy, 2025 to 2035
      • By Country
        • Germany
        • Italy
        • France
        • UK
        • Spain
        • BENELUX
        • Nordic
        • Rest of W.Europe
      • By Product Type
      • By Sales Channel
    • Market Attractiveness Analysis
      • By Country
      • By Product Type
      • By Sales Channel
    • Key Takeaways
  12. Eastern Europe Market Analysis 2020 to 2024 and Forecast 2025 to 2035, By Country
    • Historical Market Size Value (USD Billion) & Volume (Metric tons) Trend Analysis By Market Taxonomy, 2020 to 2024
    • Market Size Value (USD Billion) & Volume (Metric tons) Forecast By Market Taxonomy, 2025 to 2035
      • By Country
        • Russia
        • Hungary
        • Poland
        • Balkan & Baltics
        • Rest of E. Europe
      • By Product Type
      • By Sales Channel
    • Market Attractiveness Analysis
      • By Country
      • By Product Type
      • By Sales Channel
    • Key Takeaways
  13. East Asia Market Analysis 2020 to 2024 and Forecast 2025 to 2035, By Country
    • Historical Market Size Value (USD Billion) & Volume (Metric tons) Trend Analysis By Market Taxonomy, 2020 to 2024
    • Market Size Value (USD Billion) & Volume (Metric tons) Forecast By Market Taxonomy, 2025 to 2035
      • By Country
        • China
        • Japan
        • South Korea
      • By Product Type
      • By Sales Channel
    • Market Attractiveness Analysis
      • By Country
      • By Product Type
      • By Sales Channel
    • Key Takeaways
  14. South Asia & Pacific Market Analysis 2020 to 2024 and Forecast 2025 to 2035, By Country
    • Historical Market Size Value (USD Billion) & Volume (Metric tons) Trend Analysis By Market Taxonomy, 2020 to 2024
    • Market Size Value (USD Billion) & Volume (Metric tons) Forecast By Market Taxonomy, 2025 to 2035
      • By Country
        • India
        • Australia & New Zealand
        • ASEAN
        • Rest of SAP
      • By Product Type
      • By Sales Channel
    • Market Attractiveness Analysis
      • By Country
      • By Product Type
      • By Sales Channel
    • Key Takeaways
  15. Middle East and Africa Market Analysis 2020 to 2024 and Forecast 2025 to 2035, By Country
    • Historical Market Size Value (USD Billion) & Volume (Metric tons) Trend Analysis By Market Taxonomy, 2020 to 2024
    • Market Size Value (USD Billion) & Volume (Metric tons) Forecast By Market Taxonomy, 2025 to 2035
      • By Country
        • GCC Countries
        • Northern Africa
        • South Africa
        • Turkiye
        • Rest of MEA
      • By Product Type
      • By Sales Channel
    • Market Attractiveness Analysis
      • By Country
      • By Product Type
      • By Sales Channel
    • Key Takeaways
  16. Key Countries Market Analysis
    • USA
      • Pricing Analysis
      • Market Share Analysis, 2024
        • By Product Type
        • By Sales Channel
    • Canada
      • Pricing Analysis
      • Market Share Analysis, 2024
        • By Product Type
        • By Sales Channel
    • Brazil
      • Pricing Analysis
      • Market Share Analysis, 2024
        • By Product Type
        • By Sales Channel
    • Mexico
      • Pricing Analysis
      • Market Share Analysis, 2024
        • By Product Type
        • By Sales Channel
    • Argentina
      • Pricing Analysis
      • Market Share Analysis, 2024
        • By Product Type
        • By Sales Channel
  17. Market Structure Analysis
    • Competition Dashboard
    • Competition Benchmarking
    • Market Share Analysis of Top Players
      • By Regional
      • By Product Type
      • By Sales Channel
  18. Competition Analysis
    • Competition Deep Dive
      • Mars, Incorporated
        • Overview
        • Product Portfolio
        • Profitability by Market Segments (Product/Age /Sales Channel/Region)
        • Sales Footprint
        • Strategy Overview
          • Marketing Strategy
          • Product Strategy
          • Channel Strategy
      • Mondelez International
        • Overview
        • Product Portfolio
        • Profitability by Market Segments (Product/Age /Sales Channel/Region)
        • Sales Footprint
        • Strategy Overview
          • Marketing Strategy
          • Product Strategy
          • Channel Strategy
      • Lotte
        • Overview
        • Product Portfolio
        • Profitability by Market Segments (Product/Age /Sales Channel/Region)
        • Sales Footprint
        • Strategy Overview
          • Marketing Strategy
          • Product Strategy
          • Channel Strategy
      • Perfetti Van Melle
        • Overview
        • Product Portfolio
        • Profitability by Market Segments (Product/Age /Sales Channel/Region)
        • Sales Footprint
        • Strategy Overview
          • Marketing Strategy
          • Product Strategy
          • Channel Strategy
      • Cloetta
        • Overview
        • Product Portfolio
        • Profitability by Market Segments (Product/Age /Sales Channel/Region)
        • Sales Footprint
        • Strategy Overview
          • Marketing Strategy
          • Product Strategy
          • Channel Strategy
      • Hager & Werken
        • Overview
        • Product Portfolio
        • Profitability by Market Segments (Product/Age /Sales Channel/Region)
        • Sales Footprint
        • Strategy Overview
          • Marketing Strategy
          • Product Strategy
          • Channel Strategy
      • GSK (Nicotinell)
        • Overview
        • Product Portfolio
        • Profitability by Market Segments (Product/Age /Sales Channel/Region)
        • Sales Footprint
        • Strategy Overview
          • Marketing Strategy
          • Product Strategy
          • Channel Strategy
      • Military Energy Gum
        • Overview
        • Product Portfolio
        • Profitability by Market Segments (Product/Age /Sales Channel/Region)
        • Sales Footprint
        • Strategy Overview
          • Marketing Strategy
          • Product Strategy
          • Channel Strategy
      • ZOFT Gum
        • Overview
        • Product Portfolio
        • Profitability by Market Segments (Product/Age /Sales Channel/Region)
        • Sales Footprint
        • Strategy Overview
          • Marketing Strategy
          • Product Strategy
          • Channel Strategy
      • Lemon Pharma
        • Overview
        • Product Portfolio
        • Profitability by Market Segments (Product/Age /Sales Channel/Region)
        • Sales Footprint
        • Strategy Overview
          • Marketing Strategy
          • Product Strategy
          • Channel Strategy
  19. Assumptions & Acronyms Used
  20. Research Methodology

List of Tables

  • Table 1: Global Market Value (USD Billion) Forecast by Region, 2020-2035
  • Table 2: Global Market Volume (Metric tons) Forecast by Region, 2020-2035
  • Table 3: Global Market Value (USD Billion) Forecast by Product Type, 2020-2035
  • Table 4: Global Market Volume (Metric tons) Forecast by Product Type, 2020-2035
  • Table 5: Global Market Value (USD Billion) Forecast by Sales Channel, 2020-2035
  • Table 6: Global Market Volume (Metric tons) Forecast by Sales Channel, 2020-2035
  • Table 7: North America Market Value (USD Billion) Forecast by Country, 2020-2035
  • Table 8: North America Market Volume (Metric tons) Forecast by Country, 2020-2035
  • Table 9: North America Market Value (USD Billion) Forecast by Product Type, 2020-2035
  • Table 10: North America Market Volume (Metric tons) Forecast by Product Type, 2020-2035
  • Table 11: North America Market Value (USD Billion) Forecast by Sales Channel, 2020-2035
  • Table 12: North America Market Volume (Metric tons) Forecast by Sales Channel, 2020-2035
  • Table 13: Latin America Market Value (USD Billion) Forecast by Country, 2020-2035
  • Table 14: Latin America Market Volume (Metric tons) Forecast by Country, 2020-2035
  • Table 15: Latin America Market Value (USD Billion) Forecast by Product Type, 2020-2035
  • Table 16: Latin America Market Volume (Metric tons) Forecast by Product Type, 2020-2035
  • Table 17: Latin America Market Value (USD Billion) Forecast by Sales Channel, 2020-2035
  • Table 18: Latin America Market Volume (Metric tons) Forecast by Sales Channel, 2020-2035
  • Table 19: Western Europe Market Value (USD Billion) Forecast by Country, 2020-2035
  • Table 20: Western Europe Market Volume (Metric tons) Forecast by Country, 2020-2035
  • Table 21: Western Europe Market Value (USD Billion) Forecast by Product Type, 2020-2035
  • Table 22: Western Europe Market Volume (Metric tons) Forecast by Product Type, 2020-2035
  • Table 23: Western Europe Market Value (USD Billion) Forecast by Sales Channel, 2020-2035
  • Table 24: Western Europe Market Volume (Metric tons) Forecast by Sales Channel, 2020-2035
  • Table 25: Eastern Europe Market Value (USD Billion) Forecast by Country, 2020-2035
  • Table 26: Eastern Europe Market Volume (Metric tons) Forecast by Country, 2020-2035
  • Table 27: Eastern Europe Market Value (USD Billion) Forecast by Product Type, 2020-2035
  • Table 28: Eastern Europe Market Volume (Metric tons) Forecast by Product Type, 2020-2035
  • Table 29: Eastern Europe Market Value (USD Billion) Forecast by Sales Channel, 2020-2035
  • Table 30: Eastern Europe Market Volume (Metric tons) Forecast by Sales Channel, 2020-2035
  • Table 31: East Asia Market Value (USD Billion) Forecast by Country, 2020-2035
  • Table 32: East Asia Market Volume (Metric tons) Forecast by Country, 2020-2035
  • Table 33: East Asia Market Value (USD Billion) Forecast by Product Type, 2020-2035
  • Table 34: East Asia Market Volume (Metric tons) Forecast by Product Type, 2020-2035
  • Table 35: East Asia Market Value (USD Billion) Forecast by Sales Channel, 2020-2035
  • Table 36: East Asia Market Volume (Metric tons) Forecast by Sales Channel, 2020-2035
  • Table 37: South Asia & Pacific Market Value (USD Billion) Forecast by Country, 2020-2035
  • Table 38: South Asia & Pacific Market Volume (Metric tons) Forecast by Country, 2020-2035
  • Table 39: South Asia & Pacific Market Value (USD Billion) Forecast by Product Type, 2020-2035
  • Table 40: South Asia & Pacific Market Volume (Metric tons) Forecast by Product Type, 2020-2035
  • Table 41: South Asia & Pacific Market Value (USD Billion) Forecast by Sales Channel, 2020-2035
  • Table 42: South Asia & Pacific Market Volume (Metric tons) Forecast by Sales Channel, 2020-2035
  • Table 43: Middle East and Africa Market Value (USD Billion) Forecast by Country, 2020-2035
  • Table 44: Middle East and Africa Market Volume (Metric tons) Forecast by Country, 2020-2035
  • Table 45: Middle East and Africa Market Value (USD Billion) Forecast by Product Type, 2020-2035
  • Table 46: Middle East and Africa Market Volume (Metric tons) Forecast by Product Type, 2020-2035
  • Table 47: Middle East and Africa Market Value (USD Billion) Forecast by Sales Channel, 2020-2035
  • Table 48: Middle East and Africa Market Volume (Metric tons) Forecast by Sales Channel, 2020-2035

List of Figures

  • Figure 1: Global Market Volume (Metric tons) Forecast 2020-2035
  • Figure 2: Global Market Pricing Analysis
  • Figure 3: Global Market Value (USD Billion) Forecast 2020-2035
  • Figure 4: Global Market Value Share and BPS Analysis by Product Type, 2025 and 2035
  • Figure 5: Global Market Y-o-Y Growth Comparison by Product Type, 2025-2035
  • Figure 6: Global Market Attractiveness Analysis by Product Type
  • Figure 7: Global Market Value Share and BPS Analysis by Sales Channel, 2025 and 2035
  • Figure 8: Global Market Y-o-Y Growth Comparison by Sales Channel, 2025-2035
  • Figure 9: Global Market Attractiveness Analysis by Sales Channel
  • Figure 10: Global Market Value (USD Billion) Share and BPS Analysis by Region, 2025 and 2035
  • Figure 11: Global Market Y-o-Y Growth Comparison by Region, 2025-2035
  • Figure 12: Global Market Attractiveness Analysis by Region
  • Figure 13: North America Market Incremental $ Opportunity, 2025-2035
  • Figure 14: Latin America Market Incremental $ Opportunity, 2025-2035
  • Figure 15: Western Europe Market Incremental $ Opportunity, 2025-2035
  • Figure 16: Eastern Europe Market Incremental $ Opportunity, 2025-2035
  • Figure 17: East Asia Market Incremental $ Opportunity, 2025-2035
  • Figure 18: South Asia & Pacific Market Incremental $ Opportunity, 2025-2035
  • Figure 19: Middle East and Africa Market Incremental $ Opportunity, 2025-2035
  • Figure 20: North America Market Value Share and BPS Analysis by Country, 2025 and 2035
  • Figure 21: North America Market Value Share and BPS Analysis by Product Type, 2025 and 2035
  • Figure 22: North America Market Y-o-Y Growth Comparison by Product Type, 2025-2035
  • Figure 23: North America Market Attractiveness Analysis by Product Type
  • Figure 24: North America Market Value Share and BPS Analysis by Sales Channel, 2025 and 2035
  • Figure 25: North America Market Y-o-Y Growth Comparison by Sales Channel, 2025-2035
  • Figure 26: North America Market Attractiveness Analysis by Sales Channel
  • Figure 27: Latin America Market Value Share and BPS Analysis by Country, 2025 and 2035
  • Figure 28: Latin America Market Value Share and BPS Analysis by Product Type, 2025 and 2035
  • Figure 29: Latin America Market Y-o-Y Growth Comparison by Product Type, 2025-2035
  • Figure 30: Latin America Market Attractiveness Analysis by Product Type
  • Figure 31: Latin America Market Value Share and BPS Analysis by Sales Channel, 2025 and 2035
  • Figure 32: Latin America Market Y-o-Y Growth Comparison by Sales Channel, 2025-2035
  • Figure 33: Latin America Market Attractiveness Analysis by Sales Channel
  • Figure 34: Western Europe Market Value Share and BPS Analysis by Country, 2025 and 2035
  • Figure 35: Western Europe Market Value Share and BPS Analysis by Product Type, 2025 and 2035
  • Figure 36: Western Europe Market Y-o-Y Growth Comparison by Product Type, 2025-2035
  • Figure 37: Western Europe Market Attractiveness Analysis by Product Type
  • Figure 38: Western Europe Market Value Share and BPS Analysis by Sales Channel, 2025 and 2035
  • Figure 39: Western Europe Market Y-o-Y Growth Comparison by Sales Channel, 2025-2035
  • Figure 40: Western Europe Market Attractiveness Analysis by Sales Channel
  • Figure 41: Eastern Europe Market Value Share and BPS Analysis by Country, 2025 and 2035
  • Figure 42: Eastern Europe Market Value Share and BPS Analysis by Product Type, 2025 and 2035
  • Figure 43: Eastern Europe Market Y-o-Y Growth Comparison by Product Type, 2025-2035
  • Figure 44: Eastern Europe Market Attractiveness Analysis by Product Type
  • Figure 45: Eastern Europe Market Value Share and BPS Analysis by Sales Channel, 2025 and 2035
  • Figure 46: Eastern Europe Market Y-o-Y Growth Comparison by Sales Channel, 2025-2035
  • Figure 47: Eastern Europe Market Attractiveness Analysis by Sales Channel
  • Figure 48: East Asia Market Value Share and BPS Analysis by Country, 2025 and 2035
  • Figure 49: East Asia Market Value Share and BPS Analysis by Product Type, 2025 and 2035
  • Figure 50: East Asia Market Y-o-Y Growth Comparison by Product Type, 2025-2035
  • Figure 51: East Asia Market Attractiveness Analysis by Product Type
  • Figure 52: East Asia Market Value Share and BPS Analysis by Sales Channel, 2025 and 2035
  • Figure 53: East Asia Market Y-o-Y Growth Comparison by Sales Channel, 2025-2035
  • Figure 54: East Asia Market Attractiveness Analysis by Sales Channel
  • Figure 55: South Asia & Pacific Market Value Share and BPS Analysis by Country, 2025 and 2035
  • Figure 56: South Asia & Pacific Market Value Share and BPS Analysis by Product Type, 2025 and 2035
  • Figure 57: South Asia & Pacific Market Y-o-Y Growth Comparison by Product Type, 2025-2035
  • Figure 58: South Asia & Pacific Market Attractiveness Analysis by Product Type
  • Figure 59: South Asia & Pacific Market Value Share and BPS Analysis by Sales Channel, 2025 and 2035
  • Figure 60: South Asia & Pacific Market Y-o-Y Growth Comparison by Sales Channel, 2025-2035
  • Figure 61: South Asia & Pacific Market Attractiveness Analysis by Sales Channel
  • Figure 62: Middle East and Africa Market Value Share and BPS Analysis by Country, 2025 and 2035
  • Figure 63: Middle East and Africa Market Value Share and BPS Analysis by Product Type, 2025 and 2035
  • Figure 64: Middle East and Africa Market Y-o-Y Growth Comparison by Product Type, 2025-2035
  • Figure 65: Middle East and Africa Market Attractiveness Analysis by Product Type
  • Figure 66: Middle East and Africa Market Value Share and BPS Analysis by Sales Channel, 2025 and 2035
  • Figure 67: Middle East and Africa Market Y-o-Y Growth Comparison by Sales Channel, 2025-2035
  • Figure 68: Middle East and Africa Market Attractiveness Analysis by Sales Channel
  • Figure 69: Global Market - Tier Structure Analysis
  • Figure 70: Global Market - Company Share Analysis

Frequently Asked Questions

What is the estimated market size of the functional chewing gum industry in 2025?

The industry is valued at USD 16.7 billion in 2025.

What is the projected industry size of the functional chewing gum industry by 2035?

It is forecasted to reach USD 42.6 billion by 2035.

What is the expected CAGR for the functional chewing gum industry between 2025 and 2035?

The industry is anticipated to grow at a CAGR of 9.8% during this period.

Which segment is expected to lead the functional chewing gum market in 2025?

Nicotine gum are projected to lead the market with a 32.1% share in 2025.

Which region is expected to witness the highest growth in the functional chewing gum market?

Asia Pacific, particularly India, is expected to be the key growth region with a projected growth rate of 7.0%.

Explore Similar Insights

Future Market Insights

Functional Chewing Gum Market