Functional Flour Market Size, Share, and Forecast Outlook 2025 to 2035

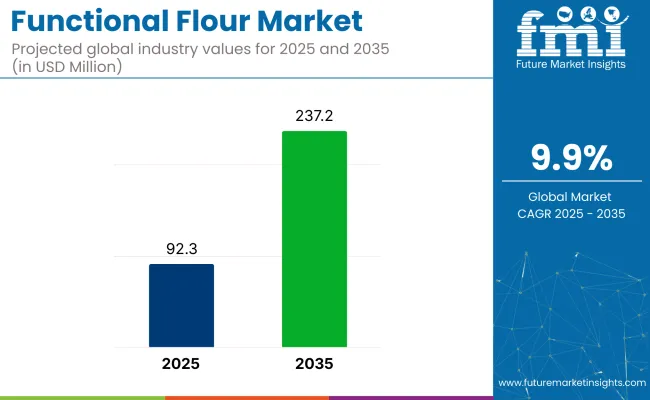
The functional flour market has been projected to advance from USD 92.3 million in 2025 to USD 237.2 million by 2035, delivering a 9.9% CAGR during the period. Gluten-free functional flour is expected to command 65.2% of 2025 sales, its share supported by rising coeliac-safe and clean-label claims across baked snacks and meal kits.
Quick Stats for Functional Flour Market

  • Industry value (2025): USD 92.3 million
  • Forecast value (2035): USD 237.2 million
  • Forecast CAGR (2025 to 2035): 9.9%
  • Leading segment in 2035: Gluten-free functional flour (65.2% share)
  • Key growth region: Asia Pacific (India)
  • Key players: Cargill; General Mills; Archer Daniels Midland Company; Associated British Foods; The Hain Celestial Group Inc.; Sunopta Inc.

Functional Flour Market

Attribute Value
Market Size in 2025 USD 92.3 million
Market Size in 2035 USD 237.2 million
CAGR (2025 to 2035) 9.9%

High-protein and fiber-enriched variants are set to hold the balance, propelled by consumer interest in macronutrient density without textural compromise.

In a March 2023 interview with AgFunderNews, Dr. Tom Simmons, Founder and CEO of The Supplant Company, stated, “On a wheat plant, two-thirds of the above-ground biomass is not currently used [for human food]. If you think about the energy and inputs needed to grow it, and the carbon emissions, it doesn’t make sense that we’re wasting the high-fiber, low-calorie part of the crop.” This reflects their approach to upcycling wheat plant by-products.

The functional flour market has different shares in its parent markets. In the food ingredients market, it accounts for around 4-6%, driven by increasing consumer demand for functional foods that provide added nutritional benefits. Within the bakery ingredients market, the share is approximately 5-7%, as these flours improve texture, nutrition, and shelf life in baked goods.

The gluten-free products market sees a share of 3-5%, influenced by the rise in gluten-free diets and the need for alternatives. In the health and wellness food market, the flour contributes about 4-6%, as consumers seek healthier, fiber-rich options. The plant-based food market holds a share of 2-4%, as they are used in plant-based products for improved nutritional profiles.

Analysis of Functional Flour Market by Top Investment Segments

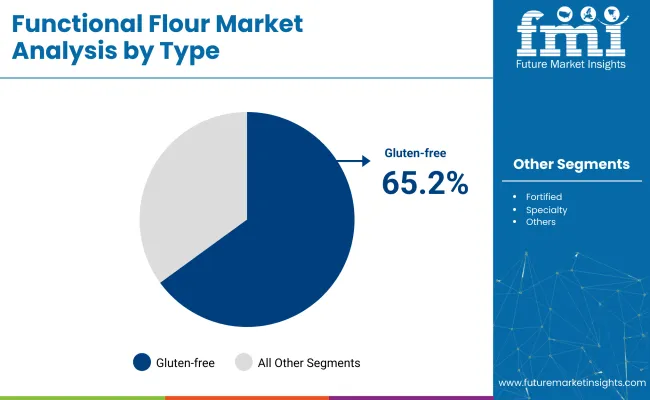
The industry is expected to see strong growth, with gluten-free functional flour leading with 65.2% of the industry share in 2025. High-protein and fiber-enriched flour will hold 34.8%, while bakery products will dominate end-use applications with 50% industry share.

Gluten-free functional flour supports allergen management initiatives with 65.2% industry share

Gluten-free functional flour is projected to capture 65.2% of the industry share in 2025. Its growth is driven by the need for celiac-safe claims and cross-contact protocols, especially among multinational snack producers. Heat-treated rice and sorghum fractions deliver batter viscosity similar to wheat at 30% hydration, while particle-size standardization ensures smooth texture in high-ratio cake mixes.

Enzymatic dextrinization improves water-holding capacity, extending the shelf life of soft cookies by two days. Fortification with calcium and B-vitamins compensates for the nutrients lost when wheat is removed from formulations. Dedicated mill lines in Kansas and Minnesota lower contamination risks, ensuring GFSI audit clearance.
  • Heat-treated rice and sorghum ensure similar batter viscosity to wheat-based flour
  • Enzymatic dextrinization extends shelf life of soft cookies by two days
  • Dedicated mill lines lower contamination risks and support GFSI audit compliance

Functional Flour Market Analysis By Type

High-protein and fiber-enriched flour elevates nutrient density targets with 34.8% industry share

High-protein and fiber-enriched flour is expected to account for 34.8% of the industry share in 2025. This segment reflects growing consumer demand for satiety-enhancing ingredients and glycemic moderation in meal-replacement products. Pea-protein concentrates elevate protein content to 28g per 100g, meeting fortification goals for ready-to-eat cereals.

Resistant starches, which cut postprandial glucose spikes, are gaining traction with claims for "reduced glycemic response" by the European Food Safety Authority (EFSA). Extrusion-activated fibers improve dough gas retention, maintaining loaf volume without added gluten. Fine oat bran boosts beta-glucan content, supporting "heart-health" claims under FDA guidelines.

  • Pea-protein concentrates enhance protein content to 28g per 100g
  • Resistant starches cut glucose spikes, qualifying for reduced glycemic response claims
  • Oat bran integration boosts beta-glucan content, supporting heart-health claims

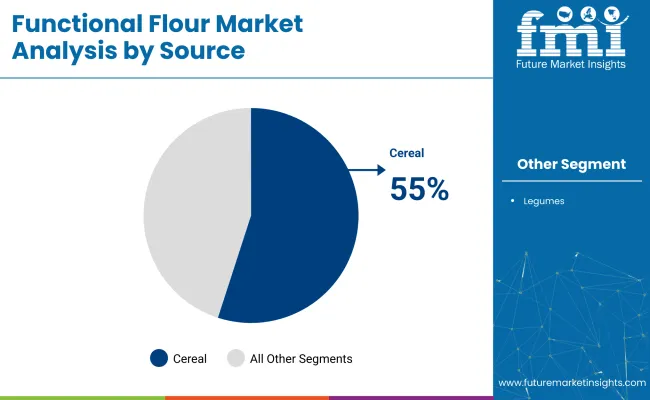
Cereal sources provide milling and supply-chain continuity with 55% industry share

Cereal-derived flours are projected to account for 55% of the industry share in 2025. The segment benefits from established agronomic networks and existing roller-mill compatibility, minimizing capital upgrades. Hard-red winter wheat streams are heat-treated to stabilize future blends by deactivating amylase, which ensures better blend storage. Barley-based flours supply intrinsic beta-glucans, reducing reliance on isolated hydrocolloids.

Sorghum sourcing contracts mitigate the risk of corn price volatility in the Midwest. Malting-grade rye fractions contribute natural enzymes that enhance dough elasticity in artisan breads, while integrated grain silos use real-time NIR sensors to maintain protein targets with ±0.2% accuracy.
  • Heat-treated wheat stabilizes blend storage by deactivating amylase
  • Barley-based flours supply beta-glucans, reducing hydrocolloid dependency
  • Real-time NIR sensors maintain protein targets for consistent batching

Functional Flour Market Analysis By Source

Bakery products command functional flour consumption patterns with 50% share

Bakery products are expected to hold 50% of the industry share in 2025, driven by demand for crumb tenderness, shelf-life extension, and clean-label formulations. The flours replace DATEM emulsifiers in sandwich loaves while ensuring slice cohesion after toasting. Muffin batter viscosity stability reduces pan-top variance, improving weight consistency by 5%.

Gluten-free pizza bases benefit from starch-optimized flour blends, reducing chew-force by 25%. Sugar-reduced brownies retain moisture due to improved hydration from modified cereal starches. Frozen par-baked baguettes remain intact at −20°C, thanks to enzyme-activated flour matrices that prevent surface cracking during storage.

  • Functional flours replace DATEM emulsifiers in bakery products without compromising texture
  • Modified starches retain moisture in sugar-reduced baked goods
  • Enzyme-activated flour prevents cracking in frozen par-baked products

Top Functional Flour Market Dynamics

Label compliance pressures and digestibility claims are increasing demand in specialized food categories. At the same time, niche demand for gluten-free meal kits and therapeutic formulations is opening new commercialization channels in export-focused regions.

Regulatory Push for Clean-Label Texturizers Accelerating Use in RTE

Processed food manufacturers are substituting modified starches with the flours to meet EU and USA clean-label guidelines. Functional rice and lentil flours are used as thickeners and stabilizers in sauces, soups, and frozen entrees. Ingredients previously labeled with E-numbers are being replaced to allow for declarations like “whole lentil flour” or “pre-gelatinized rice flour.”

Suppliers such as Limagrain and Ingredion have developed flours with thermal stability and shear resistance for high-output processing lines. Microwaveable soups and shelf-stable sauces now specify flour-based texturizers to avoid labeling complications and regulatory scrutiny.

  • E-numbered starches are being replaced by thermally stable pulse or cereal flours.
  • Frozen RTE categories rely on flours for thickening without emulsifiers or gums.
  • Labeling rules have pushed USA and EU brands to switch to flour inputs for viscosity control.

Gluten-Free Medical and Meal Kit Formats Opening New Channels

Functional flours are gaining traction in prescription meal kits and therapeutic diets targeting gluten intolerance and metabolic disorders. In Japan, rice and amaranth-based flours are being included in pre-cooked diabetic meal trays. USA DTC brands like Modify Health and Epicured have integrated resistant starch flours into FODMAP-compliant menus.

Hospitals are sourcing stabilized flours with validated glycemic profiles for institutional foodservice use. Exporters targeting medical supply chains and clinical nutrition providers are now developing heat-treated, low-viscosity flours that maintain texture under extended hold and reheat conditions.
  • Diabetic and FODMAP diets use the flours with measured glycemic response.
  • Meal kit brands demand reheatable gluten-free flours with consistent texture under chill-chain transit.
  • Hospital foodservice buyers prioritize validated flour profiles for controlled metabolic responses.

Top Countries Manufacturing, Supplying, and Distributing Functional Flour

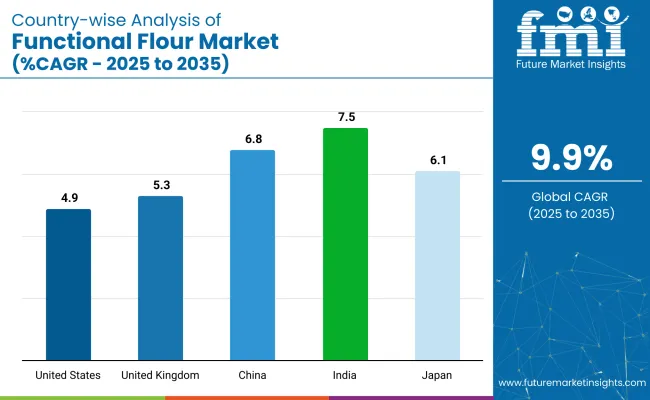
Country Wise Analysis Of Functional Flour Market Cagr 2025 To 2035

Countries CAGR (2025 to 2035)
United States 4.9%
United Kingdom 5.3%
China 6.8%
Japan 6.1%
India 7.5%

The industry demand is projected to rise at a 9.9% CAGR from 2025 to 2035. Of the five profiled countries out of 40 covered, India leads at 7.5%, followed by China at 6.8%, and Japan at 6.1%, while the United Kingdom posts 5.3% and the United States records 4.9%.

These rates translate to a growth premium of +9% for India, +6% for China, and -7% for the United States versus the baseline, while the United Kingdom and Japan show moderate growth. Divergence reflects local catalysts: rising health awareness and demand for functional ingredients in India and China, while more mature industries in the United States, the United Kingdom, and Japan exhibit slower growth driven by industry saturation and established consumption patterns.
Growth Analysis of Functional Flour Market in the United States

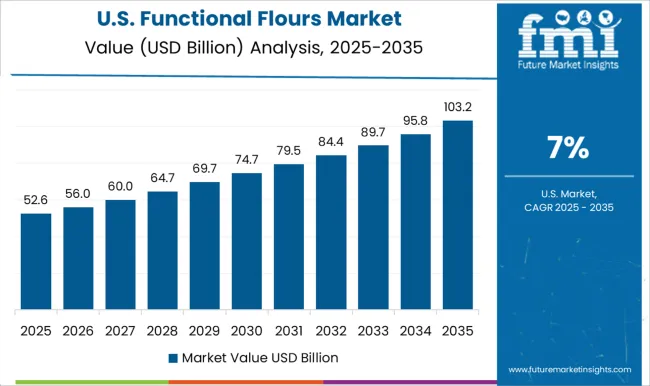
The industry in the United States is set to record a CAGR of 4.9% from 2025 to 2035. FDA proposals requiring declared resistant-starch values and USDA whole-grain rules in school meals have driven reformulation toward wheat-legume blends.

Minnesota and North Dakota value-added grants offset the cost of extrusion lines that raise protein digestibility in pea and chickpea flours. Large bakers now pilot high-amylose wheat flour in cafeteria bread contracts to meet fiber targets without texture loss.

  • FDA draft labeling mandates coverage of total resistant starch in finished baked goods.
  • USDA crediting favors high-amylose wheat flour for National School Lunch Program bids.
  • Minnesota grants subsidize rural extrusion installations processing legume flours.

Future Outlook for Functional Flour Market in the United Kingdom

Sales of the flours in the United Kingdom are projected to grow at a CAGR of 5.3% through 2035. DEFRA’s fiber-enrichment roadmap prioritizes barley- and oat-based flours for private-label bread, while HFSS guidelines trim refined wheat in packaged snacks.

Innovate UK funds enzyme-activated, low-GI wheat blends destined for public-sector catering. Major retailers commit to 50% whole-grain share in own-brand bakery by 2030, raising demand for the flours with declared β-glucan content.

  • Fiber roadmap embeds the flour targets in retailer reformulation pledges.
  • HFSS thresholds cut refined wheat use in biscuit and cake recipes.
  • Innovate UK trials develop enzyme-treated low-GI flours for school-meal tenders.

Demand Forecast for Functional Flour Market in China

Demand for the flours in China is estimated to rise at a CAGR of 6.8% between 2025 and 2035. National Standard GB 14880 now permits micronutrient fortification, accelerating adoption of vitamin-enriched sorghum blends.

Hainan Free Trade Port tariff waivers lower the landed cost of cassava-based resistant-starch concentrates, supporting growth in low-GI bakery formats. Guangdong science grants underwrite extrusion pilot plants converting mung-bean flour into noodle bases for metropolitan school canteens.
  • GB 14880 amendment sets vitamin targets met by sorghum-wheat composite flours.
  • Hainan tariff relief cheapens cassava resistant-starch inputs for functional blends.
  • Provincial grants fund mung-bean flour pilot lines for institutional catering.

Functional Flour Market Growth Outlook in Japan

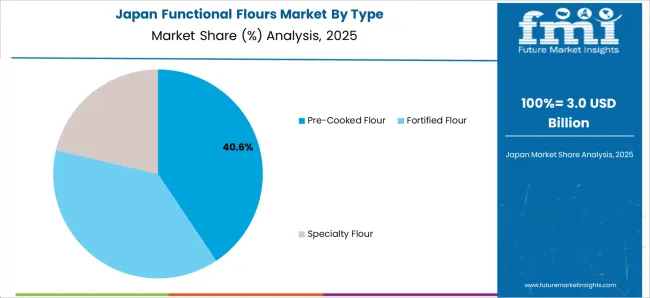
The industry in Japan is projected to expand at a CAGR of 6.1% from 2025 to 2035. FOSHU labeling enables cholesterol-control claims on barley β-glucan flours, prompting branded launches.

MAFF’s Smart Food System program subsidizes dry-milling of high-amylose rice for gluten-free mixes, while Hokkaido retrofits roller mills to supply protein-fortified wheat flours to elder-care kitchens. Retailers highlight low-GI seals on rice-flour breads positioned for diabetic consumers.

  • FOSHU approval grants cholesterol-health claims to β-glucan flour packs.
  • Smart Food subsidies support high-amylose rice-flour lines for domestic brands.
  • Hokkaido grants modernize mills producing protein-enriched wheat flour for care facilities.

Analysis of Functional Flour Market in India

The industry in India is forecast to grow at a CAGR of 7.5% through 2035. FSSAI’s Eat Right program endorses millet-fortified flour, lifting demand for pearl- and finger-millet blends in snacks and flatbreads.

Production-Linked Incentive bonuses reimburse pneumatic conveying systems that handle heat-sensitive coarse-grain flours in Rajasthan and Karnataka. National Mission on Millets funds glycemic-index trials, enabling diabetic-health claims on sorghum-based rotis and bakery mixes.

  • Eat Right initiative drives millet-flour fortification in packaged foods.
  • PLI incentives offset capital costs for millet-flour pneumatic handling.
  • Government-backed GI trials validate sorghum flour for diabetic diets.

Leading Suppliers of Functional Flour

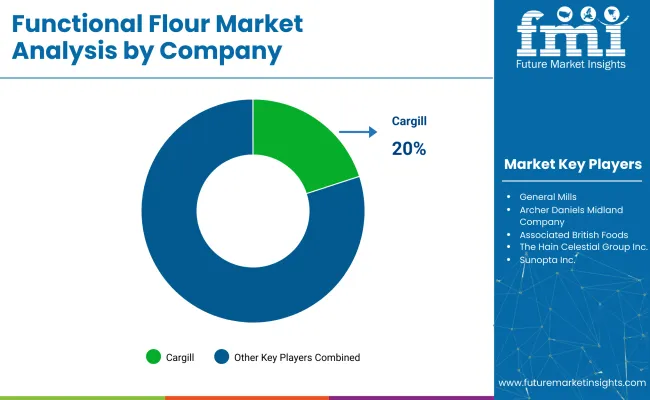
Leading Company - Cargill, Incorporated Industry Share - 20%
Functional Flour Market Analysis By Company

The industry is highly competitive, with key players like Cargill, General Mills, and Archer Daniels Midland Company dominating through extensive product ranges and global reach. These companies focus on expanding their portfolios to include the flours that cater to the growing demand for gluten-free, high-protein, and low-carb options.

Associated British Foods and The Hain Celestial Group utilize strategic acquisitions and R&D to enhance their industry presence in health-oriented food sectors. Smaller players such as Maticnjak and Shipton Mill differentiate through niche products and regional appeal. The industry remains fragmented, with large companies holding significant shares while specialized firms target specific consumer preferences and regional demands.

Recent Industry News

  • Ardent Mills introduced Ancient Grains Plus Baking Flour Blend; the gluten-free mix of chickpeas and heritage grains raises protein, lowers isolate dependence, provides mild taste, letting bakers reach stronger protein targets while maintaining existing process conditions unchanged.
  • Bay State Milling launched PurelySown Purity Protocol Gluten-Free Oats; the Saskatchewan-processed flakes contain under 5 ppm gluten, satisfy celiac requirements, and come in groats, rolled and old-fashioned forms, expanding the company’s specialty portfolio for gluten-sensitive product formulations.

Report Coverage and Scope Summary

Report Attributes Key Insights
Estimated Industry Value (2025) USD 92.3 million
Projected Industry Value (2035) USD 237.2 million
CAGR (2025 to 2035) 9.9%
Base Year for Estimation 2024
Historical Period 2020 to 2024
Forecast Period 2025 to 2035
Quantitative Units Revenue in USD million, metric ton for volume
Source Cereal-based, Legume-based
Type Fortified, Gluten-free, Specialty, Other Functional Flours
Application Bakery Products, Soups and Sauces, Ready-to-eat, Other Applications
Regions North America, Latin America, Western Europe, Eastern Europe, East Asia, South Asia & Pacific, Central Asia, Russia and Belarus, Balkan & Baltic Countries, Middle East and Africa
Countries Covered United States, Canada, Mexico, Brazil, Argentina, Germany, France, United Kingdom, Italy, Spain, Netherlands, China, India, Japan, South Korea, ANZ, GCC Countries, South Africa
Key Players Cargill, General Mills, Archer Daniels Midland Company, Associated British Foods, The Hain Celestial Group Inc., Sunopta Inc., Maticnjak, Shipton Mill, Bos’s Red Mill, Other Emerging Players
Additional Attributes Dollar sales, CAGR trends, product type distribution, size preferences, price range segmentation, competitor dollar sales & industry share, regional growth patterns

Key Players

  • Cargill
  • General Mills
  • Archer Daniels Midland Company
  • Associated British Foods
  • The Hain Celestial Group Inc.
  • Sunopta Inc.
  • Maticnjak
  • Shipton Mill
  • Bos’s Red Mill

Top Investment Segments Studied in the Functional Flour Market 

By Source:

By source, the industry is bifurcated into cereals and legumes.

By Type:

By type, the industry has been categorized into fortified, gluten-free, specialty, and other functional flours.

By Application:

By application, the industry is segmented into bakery products, soups and sauces, ready-to-eat products, and other applications.

By Region:

By region, the industry is studied across North America, Latin America, Western Europe, Eastern Europe, East Asia, South Asia & Pacific, Central Asia, Russia and Belarus, Balkan & Baltic Countries, and Middle East & Africa.

Table of Content

  1. Executive Summary
    • Global Market Outlook
    • Demand-side Trends
    • Supply-side Trends
    • Technology Roadmap Analysis
    • Analysis and Recommendations
  2. Market Overview
    • Market Coverage / Taxonomy
    • Market Definition / Scope / Limitations
  3. Market Background
    • Market Dynamics
      • Drivers
      • Restraints
      • Opportunity
      • Trends
    • Scenario Forecast
      • Demand in Optimistic Scenario
      • Demand in Likely Scenario
      • Demand in Conservative Scenario
    • Opportunity Map Analysis
    • Product Life Cycle Analysis
    • Supply Chain Analysis
      • Supply Side Participants and their Roles
        • Producers
        • Mid-Level Participants (Traders/ Agents/ Brokers)
        • Wholesalers and Distributors
      • Value Added and Value Created at Node in the Supply Chain
      • List of Raw Material Suppliers
      • List of Existing and Potential Buyer’s
    • Investment Feasibility Matrix
    • Value Chain Analysis
      • Profit Margin Analysis
      • Wholesalers and Distributors
      • Retailers
    • PESTLE and Porter’s Analysis
    • Regulatory Landscape
      • By Key Regions
      • By Key Countries
    • Regional Parent Market Outlook
    • Production and Consumption Statistics
    • Import and Export Statistics
  4. Global Market Analysis 2020 to 2024 and Forecast, 2025 to 2035
    • Historical Market Size Value (USD Million) & Volume (MT) Analysis, 2020 to 2024
    • Current and Future Market Size Value (USD Million) & Volume (MT) Projections, 2025 to 2035
      • Y-o-Y Growth Trend Analysis
      • Absolute $ Opportunity Analysis
  5. Global Market Pricing Analysis 2020 to 2024 and Forecast 2025 to 2035
  6. Global Market Analysis 2020 to 2024 and Forecast 2025 to 2035, By Type
    • Introduction / Key Findings
    • Historical Market Size Value (USD Million) & Volume (MT) Analysis By Type, 2020 to 2024
    • Current and Future Market Size Value (USD Million) & Volume (MT) Analysis and Forecast By Type, 2025 to 2035
      • Fortified functional flours
      • Gluten-free functional flours
      • Specialty functional flours
      • Other
    • Y-o-Y Growth Trend Analysis By Type, 2020 to 2024
    • Absolute $ Opportunity Analysis By Type, 2025 to 2035
  7. Global Market Analysis 2020 to 2024 and Forecast 2025 to 2035, By Application
    • Introduction / Key Findings
    • Historical Market Size Value (USD Million) & Volume (MT) Analysis By Application, 2020 to 2024
    • Current and Future Market Size Value (USD Million) & Volume (MT) Analysis and Forecast By Application, 2025 to 2035
      • Bakery products
      • Soups and sauces
      • Ready-to-eat products
      • Other
    • Y-o-Y Growth Trend Analysis By Application, 2020 to 2024
    • Absolute $ Opportunity Analysis By Application, 2025 to 2035
  8. Global Market Analysis 2020 to 2024 and Forecast 2025 to 2035, By Source
    • Introduction / Key Findings
    • Historical Market Size Value (USD Million) & Volume (MT) Analysis By Source, 2020 to 2024
    • Current and Future Market Size Value (USD Million) & Volume (MT) Analysis and Forecast By Source, 2025 to 2035
      • Cereals
      • Legumes
    • Y-o-Y Growth Trend Analysis By Source, 2020 to 2024
    • Absolute $ Opportunity Analysis By Source, 2025 to 2035
  9. Global Market Analysis 2020 to 2024 and Forecast 2025 to 2035, By Region
    • Introduction
    • Historical Market Size Value (USD Million) & Volume (MT) Analysis By Region, 2020 to 2024
    • Current Market Size Value (USD Million) & Volume (MT) Analysis and Forecast By Region, 2025 to 2035
      • North America
      • Latin America
      • Western Europe
      • Eastern Europe
      • East Asia
      • South Asia & Pacific
      • Middle East and Africa
    • Market Attractiveness Analysis By Region
  10. North America Market Analysis 2020 to 2024 and Forecast 2025 to 2035, By Country
    • Historical Market Size Value (USD Million) & Volume (MT) Trend Analysis By Market Taxonomy, 2020 to 2024
    • Market Size Value (USD Million) & Volume (MT) Forecast By Market Taxonomy, 2025 to 2035
      • By Country
        • USA
        • Canada
        • Mexico
      • By Type
      • By Application
      • By Source
    • Market Attractiveness Analysis
      • By Country
      • By Type
      • By Application
      • By Source
    • Key Takeaways
  11. Latin America Market Analysis 2020 to 2024 and Forecast 2025 to 2035, By Country
    • Historical Market Size Value (USD Million) & Volume (MT) Trend Analysis By Market Taxonomy, 2020 to 2024
    • Market Size Value (USD Million) & Volume (MT) Forecast By Market Taxonomy, 2025 to 2035
      • By Country
        • Brazil
        • Argentina
        • Rest of LATAM
      • By Type
      • By Application
      • By Source
    • Market Attractiveness Analysis
      • By Country
      • By Type
      • By Application
      • By Source
    • Key Takeaways
  12. Western Europe Market Analysis 2020 to 2024 and Forecast 2025 to 2035, By Country
    • Historical Market Size Value (USD Million) & Volume (MT) Trend Analysis By Market Taxonomy, 2020 to 2024
    • Market Size Value (USD Million) & Volume (MT) Forecast By Market Taxonomy, 2025 to 2035
      • By Country
        • Germany
        • Italy
        • France
        • UK
        • Spain
        • BENELUX
        • Nordic
        • Rest of W.Europe
      • By Type
      • By Application
      • By Source
    • Market Attractiveness Analysis
      • By Country
      • By Type
      • By Application
      • By Source
    • Key Takeaways
  13. Eastern Europe Market Analysis 2020 to 2024 and Forecast 2025 to 2035, By Country
    • Historical Market Size Value (USD Million) & Volume (MT) Trend Analysis By Market Taxonomy, 2020 to 2024
    • Market Size Value (USD Million) & Volume (MT) Forecast By Market Taxonomy, 2025 to 2035
      • By Country
        • Russia
        • Hungary
        • Poland
        • Balkan & Baltics
        • Rest of E. Europe
      • By Type
      • By Application
      • By Source
    • Market Attractiveness Analysis
      • By Country
      • By Type
      • By Application
      • By Source
    • Key Takeaways
  14. East Asia Market Analysis 2020 to 2024 and Forecast 2025 to 2035, By Country
    • Historical Market Size Value (USD Million) & Volume (MT) Trend Analysis By Market Taxonomy, 2020 to 2024
    • Market Size Value (USD Million) & Volume (MT) Forecast By Market Taxonomy, 2025 to 2035
      • By Country
        • China
        • Japan
        • South Korea
      • By Type
      • By Application
      • By Source
    • Market Attractiveness Analysis
      • By Country
      • By Type
      • By Application
      • By Source
    • Key Takeaways
  15. South Asia & Pacific Market Analysis 2020 to 2024 and Forecast 2025 to 2035, By Country
    • Historical Market Size Value (USD Million) & Volume (MT) Trend Analysis By Market Taxonomy, 2020 to 2024
    • Market Size Value (USD Million) & Volume (MT) Forecast By Market Taxonomy, 2025 to 2035
      • By Country
        • India
        • Australia & New Zealand
        • ASEAN
        • Rest of SAP
      • By Type
      • By Application
      • By Source
    • Market Attractiveness Analysis
      • By Country
      • By Type
      • By Application
      • By Source
    • Key Takeaways
  16. Middle East and Africa Market Analysis 2020 to 2024 and Forecast 2025 to 2035, By Country
    • Historical Market Size Value (USD Million) & Volume (MT) Trend Analysis By Market Taxonomy, 2020 to 2024
    • Market Size Value (USD Million) & Volume (MT) Forecast By Market Taxonomy, 2025 to 2035
      • By Country
        • GCC Countries
        • Northern Africa
        • South Africa
        • Turkiye
        • Rest of MEA
      • By Type
      • By Application
      • By Source
    • Market Attractiveness Analysis
      • By Country
      • By Type
      • By Application
      • By Source
    • Key Takeaways
  17. Key Countries Market Analysis
    • USA
      • Pricing Analysis
      • Market Share Analysis, 2024
        • By Type
        • By Application
        • By Source
    • Canada
      • Pricing Analysis
      • Market Share Analysis, 2024
        • By Type
        • By Application
        • By Source
    • Brazil
      • Pricing Analysis
      • Market Share Analysis, 2024
        • By Type
        • By Application
        • By Source
    • Mexico
      • Pricing Analysis
      • Market Share Analysis, 2024
        • By Type
        • By Application
        • By Source
    • Argentina
      • Pricing Analysis
      • Market Share Analysis, 2024
        • By Type
        • By Application
        • By Source
  18. Market Structure Analysis
    • Competition Dashboard
    • Competition Benchmarking
    • Market Share Analysis of Top Players
      • By Regional
      • By Type
      • By Application
      • By Source
  19. Competition Analysis
    • Competition Deep Dive
      • Cargill
        • Overview
        • Product Portfolio
        • Profitability by Market Segments (Product/Age /Sales Channel/Region)
        • Sales Footprint
        • Strategy Overview
          • Marketing Strategy
          • Product Strategy
          • Channel Strategy
      • General Mills
        • Overview
        • Product Portfolio
        • Profitability by Market Segments (Product/Age /Sales Channel/Region)
        • Sales Footprint
        • Strategy Overview
          • Marketing Strategy
          • Product Strategy
          • Channel Strategy
      • Archer Daniels Midland Company
        • Overview
        • Product Portfolio
        • Profitability by Market Segments (Product/Age /Sales Channel/Region)
        • Sales Footprint
        • Strategy Overview
          • Marketing Strategy
          • Product Strategy
          • Channel Strategy
      • Associated British Foods
        • Overview
        • Product Portfolio
        • Profitability by Market Segments (Product/Age /Sales Channel/Region)
        • Sales Footprint
        • Strategy Overview
          • Marketing Strategy
          • Product Strategy
          • Channel Strategy
      • The Hain Celestial Group Inc.
        • Overview
        • Product Portfolio
        • Profitability by Market Segments (Product/Age /Sales Channel/Region)
        • Sales Footprint
        • Strategy Overview
          • Marketing Strategy
          • Product Strategy
          • Channel Strategy
      • Sunopta Inc.
        • Overview
        • Product Portfolio
        • Profitability by Market Segments (Product/Age /Sales Channel/Region)
        • Sales Footprint
        • Strategy Overview
          • Marketing Strategy
          • Product Strategy
          • Channel Strategy
      • Maticnjak
        • Overview
        • Product Portfolio
        • Profitability by Market Segments (Product/Age /Sales Channel/Region)
        • Sales Footprint
        • Strategy Overview
          • Marketing Strategy
          • Product Strategy
          • Channel Strategy
      • Shipton Mill
        • Overview
        • Product Portfolio
        • Profitability by Market Segments (Product/Age /Sales Channel/Region)
        • Sales Footprint
        • Strategy Overview
          • Marketing Strategy
          • Product Strategy
          • Channel Strategy
      • Bos’s Red Mill
        • Overview
        • Product Portfolio
        • Profitability by Market Segments (Product/Age /Sales Channel/Region)
        • Sales Footprint
        • Strategy Overview
          • Marketing Strategy
          • Product Strategy
          • Channel Strategy
      • Other Emerging Players
        • Overview
        • Product Portfolio
        • Profitability by Market Segments (Product/Age /Sales Channel/Region)
        • Sales Footprint
        • Strategy Overview
          • Marketing Strategy
          • Product Strategy
          • Channel Strategy
  20. Assumptions & Acronyms Used
  21. Research Methodology

List of Tables

  • Table 1: Global Market Value (USD Million) Forecast by Region, 2020 to 2035
  • Table 2: Global Market Volume (MT) Forecast by Region, 2020 to 2035
  • Table 3: Global Market Value (USD Million) Forecast by Type, 2020 to 2035
  • Table 4: Global Market Volume (MT) Forecast by Type, 2020 to 2035
  • Table 5: Global Market Value (USD Million) Forecast by Application, 2020 to 2035
  • Table 6: Global Market Volume (MT) Forecast by Application, 2020 to 2035
  • Table 7: Global Market Value (USD Million) Forecast by Source, 2020 to 2035
  • Table 8: Global Market Volume (MT) Forecast by Source, 2020 to 2035
  • Table 9: North America Market Value (USD Million) Forecast by Country, 2020 to 2035
  • Table 10: North America Market Volume (MT) Forecast by Country, 2020 to 2035
  • Table 11: North America Market Value (USD Million) Forecast by Type, 2020 to 2035
  • Table 12: North America Market Volume (MT) Forecast by Type, 2020 to 2035
  • Table 13: North America Market Value (USD Million) Forecast by Application, 2020 to 2035
  • Table 14: North America Market Volume (MT) Forecast by Application, 2020 to 2035
  • Table 15: North America Market Value (USD Million) Forecast by Source, 2020 to 2035
  • Table 16: North America Market Volume (MT) Forecast by Source, 2020 to 2035
  • Table 17: Latin America Market Value (USD Million) Forecast by Country, 2020 to 2035
  • Table 18: Latin America Market Volume (MT) Forecast by Country, 2020 to 2035
  • Table 19: Latin America Market Value (USD Million) Forecast by Type, 2020 to 2035
  • Table 20: Latin America Market Volume (MT) Forecast by Type, 2020 to 2035
  • Table 21: Latin America Market Value (USD Million) Forecast by Application, 2020 to 2035
  • Table 22: Latin America Market Volume (MT) Forecast by Application, 2020 to 2035
  • Table 23: Latin America Market Value (USD Million) Forecast by Source, 2020 to 2035
  • Table 24: Latin America Market Volume (MT) Forecast by Source, 2020 to 2035
  • Table 25: Western Europe Market Value (USD Million) Forecast by Country, 2020 to 2035
  • Table 26: Western Europe Market Volume (MT) Forecast by Country, 2020 to 2035
  • Table 27: Western Europe Market Value (USD Million) Forecast by Type, 2020 to 2035
  • Table 28: Western Europe Market Volume (MT) Forecast by Type, 2020 to 2035
  • Table 29: Western Europe Market Value (USD Million) Forecast by Application, 2020 to 2035
  • Table 30: Western Europe Market Volume (MT) Forecast by Application, 2020 to 2035
  • Table 31: Western Europe Market Value (USD Million) Forecast by Source, 2020 to 2035
  • Table 32: Western Europe Market Volume (MT) Forecast by Source, 2020 to 2035
  • Table 33: Eastern Europe Market Value (USD Million) Forecast by Country, 2020 to 2035
  • Table 34: Eastern Europe Market Volume (MT) Forecast by Country, 2020 to 2035
  • Table 35: Eastern Europe Market Value (USD Million) Forecast by Type, 2020 to 2035
  • Table 36: Eastern Europe Market Volume (MT) Forecast by Type, 2020 to 2035
  • Table 37: Eastern Europe Market Value (USD Million) Forecast by Application, 2020 to 2035
  • Table 38: Eastern Europe Market Volume (MT) Forecast by Application, 2020 to 2035
  • Table 39: Eastern Europe Market Value (USD Million) Forecast by Source, 2020 to 2035
  • Table 40: Eastern Europe Market Volume (MT) Forecast by Source, 2020 to 2035
  • Table 41: East Asia Market Value (USD Million) Forecast by Country, 2020 to 2035
  • Table 42: East Asia Market Volume (MT) Forecast by Country, 2020 to 2035
  • Table 43: East Asia Market Value (USD Million) Forecast by Type, 2020 to 2035
  • Table 44: East Asia Market Volume (MT) Forecast by Type, 2020 to 2035
  • Table 45: East Asia Market Value (USD Million) Forecast by Application, 2020 to 2035
  • Table 46: East Asia Market Volume (MT) Forecast by Application, 2020 to 2035
  • Table 47: East Asia Market Value (USD Million) Forecast by Source, 2020 to 2035
  • Table 48: East Asia Market Volume (MT) Forecast by Source, 2020 to 2035
  • Table 49: South Asia & Pacific Market Value (USD Million) Forecast by Country, 2020 to 2035
  • Table 50: South Asia & Pacific Market Volume (MT) Forecast by Country, 2020 to 2035
  • Table 51: South Asia & Pacific Market Value (USD Million) Forecast by Type, 2020 to 2035
  • Table 52: South Asia & Pacific Market Volume (MT) Forecast by Type, 2020 to 2035
  • Table 53: South Asia & Pacific Market Value (USD Million) Forecast by Application, 2020 to 2035
  • Table 54: South Asia & Pacific Market Volume (MT) Forecast by Application, 2020 to 2035
  • Table 55: South Asia & Pacific Market Value (USD Million) Forecast by Source, 2020 to 2035
  • Table 56: South Asia & Pacific Market Volume (MT) Forecast by Source, 2020 to 2035
  • Table 57: Middle East and Africa Market Value (USD Million) Forecast by Country, 2020 to 2035
  • Table 58: Middle East and Africa Market Volume (MT) Forecast by Country, 2020 to 2035
  • Table 59: Middle East and Africa Market Value (USD Million) Forecast by Type, 2020 to 2035
  • Table 60: Middle East and Africa Market Volume (MT) Forecast by Type, 2020 to 2035
  • Table 61: Middle East and Africa Market Value (USD Million) Forecast by Application, 2020 to 2035
  • Table 62: Middle East and Africa Market Volume (MT) Forecast by Application, 2020 to 2035
  • Table 63: Middle East and Africa Market Value (USD Million) Forecast by Source, 2020 to 2035
  • Table 64: Middle East and Africa Market Volume (MT) Forecast by Source, 2020 to 2035

List of Figures

  • Figure 1: Global Market Volume (MT) Forecast 2020 to 2035
  • Figure 2: Global Market Pricing Analysis
  • Figure 3: Global Market Value (USD Million) Forecast 2020 to 2035
  • Figure 4: Global Market Value Share and BPS Analysis by Type, 2025 and 2035
  • Figure 5: Global Market Y-o-Y Growth Comparison by Type, 2025 to 2035
  • Figure 6: Global Market Attractiveness Analysis by Type
  • Figure 7: Global Market Value Share and BPS Analysis by Application, 2025 and 2035
  • Figure 8: Global Market Y-o-Y Growth Comparison by Application, 2025 to 2035
  • Figure 9: Global Market Attractiveness Analysis by Application
  • Figure 10: Global Market Value Share and BPS Analysis by Source, 2025 and 2035
  • Figure 11: Global Market Y-o-Y Growth Comparison by Source, 2025 to 2035
  • Figure 12: Global Market Attractiveness Analysis by Source
  • Figure 13: Global Market Value (USD Million) Share and BPS Analysis by Region, 2025 and 2035
  • Figure 14: Global Market Y-o-Y Growth Comparison by Region, 2025 to 2035
  • Figure 15: Global Market Attractiveness Analysis by Region
  • Figure 16: North America Market Incremental $ Opportunity, 2025 to 2035
  • Figure 17: Latin America Market Incremental $ Opportunity, 2025 to 2035
  • Figure 18: Western Europe Market Incremental $ Opportunity, 2025 to 2035
  • Figure 19: Eastern Europe Market Incremental $ Opportunity, 2025 to 2035
  • Figure 20: East Asia Market Incremental $ Opportunity, 2025 to 2035
  • Figure 21: South Asia & Pacific Market Incremental $ Opportunity, 2025 to 2035
  • Figure 22: Middle East and Africa Market Incremental $ Opportunity, 2025 to 2035
  • Figure 23: North America Market Value Share and BPS Analysis by Country, 2025 and 2035
  • Figure 24: North America Market Value Share and BPS Analysis by Type, 2025 and 2035
  • Figure 25: North America Market Y-o-Y Growth Comparison by Type, 2025 to 2035
  • Figure 26: North America Market Attractiveness Analysis by Type
  • Figure 27: North America Market Value Share and BPS Analysis by Application, 2025 and 2035
  • Figure 28: North America Market Y-o-Y Growth Comparison by Application, 2025 to 2035
  • Figure 29: North America Market Attractiveness Analysis by Application
  • Figure 30: North America Market Value Share and BPS Analysis by Source, 2025 and 2035
  • Figure 31: North America Market Y-o-Y Growth Comparison by Source, 2025 to 2035
  • Figure 32: North America Market Attractiveness Analysis by Source
  • Figure 33: Latin America Market Value Share and BPS Analysis by Country, 2025 and 2035
  • Figure 34: Latin America Market Value Share and BPS Analysis by Type, 2025 and 2035
  • Figure 35: Latin America Market Y-o-Y Growth Comparison by Type, 2025 to 2035
  • Figure 36: Latin America Market Attractiveness Analysis by Type
  • Figure 37: Latin America Market Value Share and BPS Analysis by Application, 2025 and 2035
  • Figure 38: Latin America Market Y-o-Y Growth Comparison by Application, 2025 to 2035
  • Figure 39: Latin America Market Attractiveness Analysis by Application
  • Figure 40: Latin America Market Value Share and BPS Analysis by Source, 2025 and 2035
  • Figure 41: Latin America Market Y-o-Y Growth Comparison by Source, 2025 to 2035
  • Figure 42: Latin America Market Attractiveness Analysis by Source
  • Figure 43: Western Europe Market Value Share and BPS Analysis by Country, 2025 and 2035
  • Figure 44: Western Europe Market Value Share and BPS Analysis by Type, 2025 and 2035
  • Figure 45: Western Europe Market Y-o-Y Growth Comparison by Type, 2025 to 2035
  • Figure 46: Western Europe Market Attractiveness Analysis by Type
  • Figure 47: Western Europe Market Value Share and BPS Analysis by Application, 2025 and 2035
  • Figure 48: Western Europe Market Y-o-Y Growth Comparison by Application, 2025 to 2035
  • Figure 49: Western Europe Market Attractiveness Analysis by Application
  • Figure 50: Western Europe Market Value Share and BPS Analysis by Source, 2025 and 2035
  • Figure 51: Western Europe Market Y-o-Y Growth Comparison by Source, 2025 to 2035
  • Figure 52: Western Europe Market Attractiveness Analysis by Source
  • Figure 53: Eastern Europe Market Value Share and BPS Analysis by Country, 2025 and 2035
  • Figure 54: Eastern Europe Market Value Share and BPS Analysis by Type, 2025 and 2035
  • Figure 55: Eastern Europe Market Y-o-Y Growth Comparison by Type, 2025 to 2035
  • Figure 56: Eastern Europe Market Attractiveness Analysis by Type
  • Figure 57: Eastern Europe Market Value Share and BPS Analysis by Application, 2025 and 2035
  • Figure 58: Eastern Europe Market Y-o-Y Growth Comparison by Application, 2025 to 2035
  • Figure 59: Eastern Europe Market Attractiveness Analysis by Application
  • Figure 60: Eastern Europe Market Value Share and BPS Analysis by Source, 2025 and 2035
  • Figure 61: Eastern Europe Market Y-o-Y Growth Comparison by Source, 2025 to 2035
  • Figure 62: Eastern Europe Market Attractiveness Analysis by Source
  • Figure 63: East Asia Market Value Share and BPS Analysis by Country, 2025 and 2035
  • Figure 64: East Asia Market Value Share and BPS Analysis by Type, 2025 and 2035
  • Figure 65: East Asia Market Y-o-Y Growth Comparison by Type, 2025 to 2035
  • Figure 66: East Asia Market Attractiveness Analysis by Type
  • Figure 67: East Asia Market Value Share and BPS Analysis by Application, 2025 and 2035
  • Figure 68: East Asia Market Y-o-Y Growth Comparison by Application, 2025 to 2035
  • Figure 69: East Asia Market Attractiveness Analysis by Application
  • Figure 70: East Asia Market Value Share and BPS Analysis by Source, 2025 and 2035
  • Figure 71: East Asia Market Y-o-Y Growth Comparison by Source, 2025 to 2035
  • Figure 72: East Asia Market Attractiveness Analysis by Source
  • Figure 73: South Asia & Pacific Market Value Share and BPS Analysis by Country, 2025 and 2035
  • Figure 74: South Asia & Pacific Market Value Share and BPS Analysis by Type, 2025 and 2035
  • Figure 75: South Asia & Pacific Market Y-o-Y Growth Comparison by Type, 2025 to 2035
  • Figure 76: South Asia & Pacific Market Attractiveness Analysis by Type
  • Figure 77: South Asia & Pacific Market Value Share and BPS Analysis by Application, 2025 and 2035
  • Figure 78: South Asia & Pacific Market Y-o-Y Growth Comparison by Application, 2025 to 2035
  • Figure 79: South Asia & Pacific Market Attractiveness Analysis by Application
  • Figure 80: South Asia & Pacific Market Value Share and BPS Analysis by Source, 2025 and 2035
  • Figure 81: South Asia & Pacific Market Y-o-Y Growth Comparison by Source, 2025 to 2035
  • Figure 82: South Asia & Pacific Market Attractiveness Analysis by Source
  • Figure 83: Middle East and Africa Market Value Share and BPS Analysis by Country, 2025 and 2035
  • Figure 84: Middle East and Africa Market Value Share and BPS Analysis by Type, 2025 and 2035
  • Figure 85: Middle East and Africa Market Y-o-Y Growth Comparison by Type, 2025 to 2035
  • Figure 86: Middle East and Africa Market Attractiveness Analysis by Type
  • Figure 87: Middle East and Africa Market Value Share and BPS Analysis by Application, 2025 and 2035
  • Figure 88: Middle East and Africa Market Y-o-Y Growth Comparison by Application, 2025 to 2035
  • Figure 89: Middle East and Africa Market Attractiveness Analysis by Application
  • Figure 90: Middle East and Africa Market Value Share and BPS Analysis by Source, 2025 and 2035
  • Figure 91: Middle East and Africa Market Y-o-Y Growth Comparison by Source, 2025 to 2035
  • Figure 92: Middle East and Africa Market Attractiveness Analysis by Source
  • Figure 93: Global Market - Tier Structure Analysis
  • Figure 94: Global Market - Company Share Analysis

Frequently Asked Questions

What is the projected size of the functional flour market in 2025?

The industry is expected to be valued at USD 92.3 million in 2025.

What is the projected size of the functional flour market in 2035?

The industry is projected to reach USD 237.2 million by 2035.

What is the expected CAGR for the functional flour market from 2025 to 2035?

The industry is expected to grow at a CAGR of 9.9% from 2025 to 2035.

What segment is expected to hold the largest market share in 2035?

The gluten-free segment is expected to hold around 65.2% of the industry share in 2035.

Which country is expected to experience the highest growth in the functional flour market?

India is expected to be the key growth region, with a CAGR of 7.5%.

Explore Similar Insights

Future Market Insights

Functional Flour Market