Multifunctional Adhesive Tape Market Size and Share Forecast Outlook 2025 to 2035

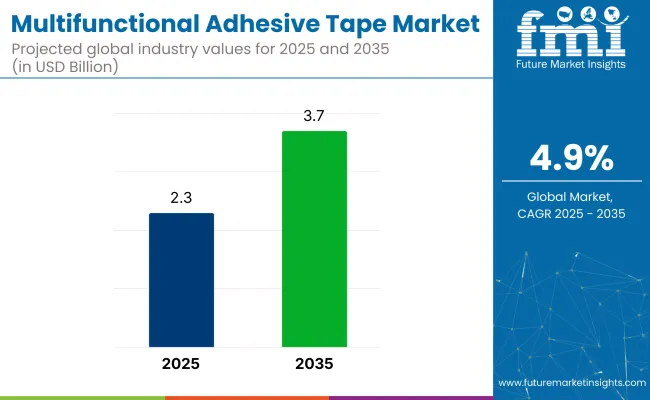
The multifunctional adhesive tape market is projected to grow from USD 2.3 billion in 2025 to USD 3.7 billion by 2035, registering a CAGR of 4.9%.
Quick Stats for Multifunctional Adhesive Tape Market

  • Market Value (2025): USD 2.3 billion
  • Forecast (2035): USD 3.7 billion
  • CAGR (2025 to 2035): 4.9%
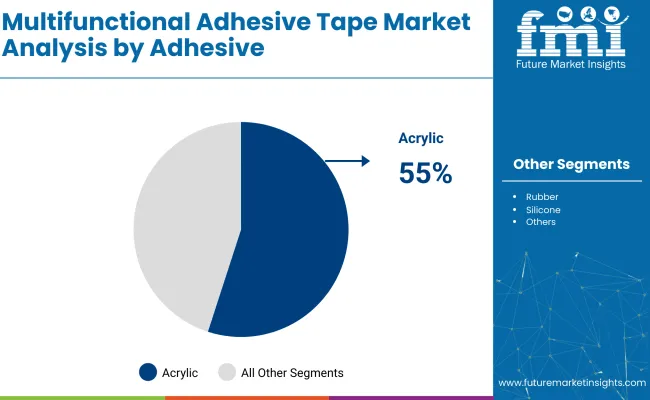
  • Leading Segment in 2035: Acrylic Adhesives (55% share)
  • Key Growth Region: United Kingdom (6.1% CAGR)
  • Key Players: 3M Tapes, tesa SE, Avery Dennison Performance Tapes, Lohmann Tape Group, VIBAC Group

Multifunctional Adhesive Tape Market

This growth is driven by the rising demand for adhesive solutions in industries such as electronics, automotive, and construction, with key trends including automation, electrification, and green architecture. Multifunctional adhesive tapes are used for a variety of applications due to their versatility, such as bonding, sealing, insulating, and protecting components. As industries focus on optimizing performance and reducing material use, adhesive tapes are increasingly seen as efficient, cost-effective solutions.

The industry holds varying shares within its parent markets. In the adhesives and sealants market, it accounts for approximately 3-5%, as adhesive tapes are just one type within the broader category of bonding agents. Within the packaging market, the share is higher at about 8-10%, driven by the extensive use of adhesive tapes for sealing, labeling, and protection.

In the construction and building materials market, multifunctional adhesive tapes represent around 2-3%, with applications in insulation, sealing, and temporary fixes. In the automotive market, its share is around 4-6%, used for assembly, sealing, and noise reduction. Within the consumer electronics market, multifunctional adhesive tapes hold about 3-4%, as they are critical for assembling and securing components in devices like smartphones and laptops.

In 2024, Mitch Butier, President and CEO of Avery Dennison, highlighted the company’s focus on eco-friendly packaging solutions, stating, “Sustainability is a core business driver, and advancing recyclable tape technology is essential to meet customer expectations.” This emphasis on sustainability reflects the increasing demand for eco-friendly materials in the multifunctional adhesive tape industry, with companies prioritizing recyclable technologies to align with customer expectations and environmental goals. The statement reinforces the industry's shift towards innovative solutions in adhesive tape applications.

Analyzing Multifunctional Adhesive Tape Market by Top Investment Segments

The multifunctional tape industry is experiencing strong investment in adhesives, backing materials, and end-use applications. With rising performance expectations in construction, electronics, and healthcare, manufacturers are focusing on acrylic adhesives, polyethylene backing materials, and electrical insulation tapes to meet evolving mechanical, thermal, and environmental demands.

Acrylic adhesives lead to multifunctional tape adoption in 2025

Acrylic adhesives are projected to dominate the multifunctional tape industry, holding a 55% share in 2025. Their superior aging resistance, UV stability, and ability to bond with various surfaces make them the go-to choice for diverse applications. These adhesives are extensively used in automotive trim assembly, appliance bonding, and outdoor signage.

Companies like 3M and tesa SE are focusing on developing low-VOC, high-tack acrylic tapes designed for harsh environments. Compared to rubber and silicone adhesives, acrylics strike a better balance between strength and flexibility, making them ideal for high-speed manufacturing lines, cleanroom environments, and medical packaging.
  • Strong performance in harsh and outdoor environments
  • Preferred for automotive, appliance, and signage applications
  • Ideal for high-speed manufacturing and cleanroom environments

Multifunctional Adhesive Tape Market Analysis By Adhesive

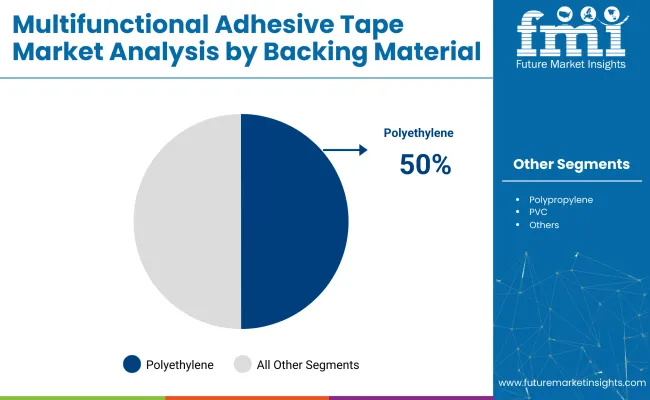
Polyethylene backing holds 50% market share in 2025

Polyethylene (PE) is the dominant backing material in the multifunctional tape industry, projected to capture 50% of the industry in 2025. Its excellent flexibility, moisture resistance, and mechanical strength make it ideal for use in various applications like construction masking, cable insulation, and protective sealing in humid or corrosive environments.

Companies such as Berry Global, Intertape Polymer Group, and Lintec Corporation offer a wide range of PE-backed tapes for automotive painting, HVAC, and industrial applications. PE's recyclability and compatibility with water-based adhesives further enhance its position as an eco-friendly material.
  • Widely used in construction, cable insulation, and industrial applications
  • Supports the growth of eco-friendly tapes due to recyclability
  • Compatible with water-based adhesives for anecological solution

Multifunctional Adhesive Tape Market Analysis By Backing Material

Electrical insulation dominates the end-use segment with a 45% share

The electrical insulation segment is set to dominate the multifunctional tape industry, accounting for 45% of the industry share in 2025. The rapid expansion of electric vehicles, renewable energy systems, and digital infrastructure is driving demand for heat-resistant, dielectric tapes.

Companies like Nitto Denko, Henkel, and Saint-Gobain manufacture multilayer insulation tapes that can endure high voltages, temperature extremes, and chemical exposure, replacing mechanical fasteners in wire harnessing and PCB assembly. Stringent regulations across Europe and the USA are also pushing OEMs to adopt high-spec adhesive tapes, ensuring consistent performance and durability in the energy and electronics sectors.

  • Driven by demand in electric vehicles and renewable energy
  • Multilayer insulation tapes replace mechanical fasteners in key applications
  • Regulatory standards in energy and electronics boost industry adoption

Top Multifunctional Adhesive Tape Market Dynamics

The industry is growing due to innovations in adhesive formulations, such as pressure-sensitive and UV-curable adhesives. However, challenges like raw material price fluctuations and environmental regulations are restraining growth, particularly for smaller companies adapting to eco-friendly solutions.

Technological Advancements in Adhesive Formulations Are Driving Market Growth

The industry is gaining momentum due to innovations in adhesive technologies, such as pressure-sensitive and UV-curable adhesives, enhancing bonding strength, surface adaptability, and resistance to temperature extremes. Companies like Avery Dennison and Henkel are focusing on developing low-VOC, solvent-free acrylic adhesives for industries like electronics, automotive, and healthcare.

The trend of miniaturization and automation in electronics is driving demand for thinner, multifunctional tapes, while smart tapes integrated with sensors or RFID tags are broadening the applications of tapes in logistics and healthcare.

  • Innovations in pressure-sensitive and UV-curable adhesives enhance performance and adaptability.
  • Companies are developing low-VOC, solvent-free adhesives for high-demand sectors like automotive and electronics.
  • The miniaturization and automation in electronics are driving demand for multifunctional, thin tapes.

Raw Material Price Fluctuations and Environmental Regulations Restrain Growth

The industry faces challenges due to raw material price fluctuations, especially for petroleum-based adhesives and synthetic films. Price volatility, driven by global crude oil trends, affects production costs and overall pricing strategies. Furthermore, increasing global pressure to reduce plastic waste and comply with circular economy goals is pushing manufacturers to find recyclable and biodegradable alternatives.

Many SMEs encounter challenges in adopting eco-friendly formulations without sacrificing performance. Regulatory frameworks, such as the EU Green Deal and the USA EPA guidelines, add additional pressure on manufacturers.
  • Price volatility in raw materials like petroleum-based adhesives and synthetic films impacts margins.
  • Environmental regulations, such as the EU Green Deal, push for more sustainable alternatives.
  • SMEs face challenges in scaling eco-friendly formulations without compromising product performance.

Analyzing Top Countries Manufacturing, Distributing, and Supplying Multifunctional Adhesive Tapes

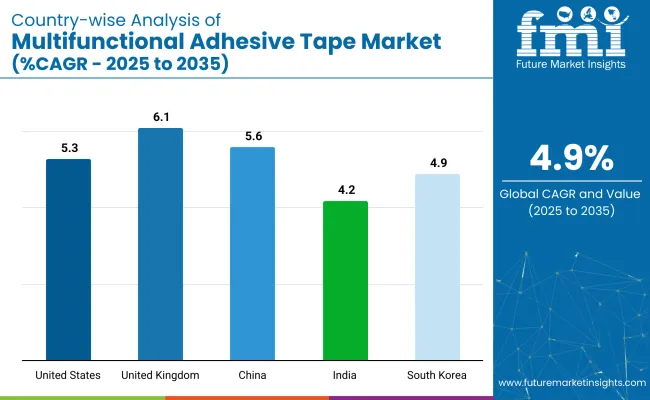
Country Wise Analysis Of Multifunctional Adhesive Tape Market

Countries CAGR (2025 to 2035)
United States 5.3%
United Kingdom 6.1%
China 5.6%
India 4.2%
South Korea 4.9%

The global industry is projected to grow at a CAGR of 4.9% from 2025 to 2035. The United States, with a CAGR of 5.3%, shows steady growth, driven by increasing demand for adhesive tapes in various industries, including automotive, electronics, and construction. The United Kingdom, at 6.1%, demonstrates a slightly higher growth rate, supported by the growing use of multifunctional adhesive tapes in manufacturing, packaging, and consumer goods.

China, with a CAGR of 5.6%, reflects strong growth due to its expanding industrial base, increasing production activities, and rising demand for advanced materials in multiple sectors. India, with a CAGR of 4.2%, shows more moderate growth, influenced by the increasing adoption of adhesive tapes in the automotive and packaging industries.

South Korea, at 4.9%, experiences stable growth, with a focus on innovation and technological advancements in adhesive tape products. While OECD countries show moderate growth, China emerges as the fastest-growing industry, indicating that emerging economies are becoming key drivers of the global industry's expansion.

The report covers in-depth analysis of 40+ countries and the five top-performing OECD and BRICS countries are highlighted below.

United States Multifunctional Adhesive Tape Market Growth

The United States industry is set to grow at a 5.3% CAGR from 2025 to 2035. This growth is driven by increasing demand for advanced tapes in industries such as automotive, aerospace, and energy infrastructure.

Companies like 3M, Shurtape Technologies, and Saint-Gobain are leading the development of specialized tapes that offer heat resistance, electrical insulation, and structural performance. Additionally, low-VOC adhesives and recyclable backing materials are gaining traction, particularly in the healthcare and electronics sectors, reflecting a shift towards more eco-conscious materials.

  • Growth driven by the automotive, aerospace, and energy sectors
  • Increase in the development of heat and electrical performance tapes
  • Growing adoption of low-VOC adhesives and recyclable materials

United Kingdom Multifunctional Adhesive Tape Industry Analysis

The United Kingdom industry is projected to grow at a 6.1% CAGR from 2025 to 2035. Key drivers include the construction sector’s shift towards green and renewable energy solutions, as well as rising demand in medical device manufacturing.

Leading suppliers like Scapa Group PLC and tesa SE are advancing eco-friendly tapes using solvent-free adhesives and PE/paper-backed solutions. The growing focus on recyclable and biodegradable packaging materials, along with the expansion of electric vehicle production, is pushing innovation forward.

  • Growth fueled by green construction and renewable energy demand
  • Advancements in eco-friendly and solvent-free tape solutions
  • Shift towards recyclable and biodegradable packaging materials

China Multifunctional Adhesive Tape Production and Exports

The China industry is expected to grow at a 5.6% CAGR from 2025 to 2035. As the largest global producer of low-cost adhesive tapes, China is expanding its manufacturing base to cater to both domestic and international demand in packaging, automotive, and consumer electronics.

Companies such as Cactus Tape and G-Tape are investing in PE and BOPP tapes while integrating acrylic and hot-melt adhesives. Automation in manufacturing and government-driven investments in infrastructure are fueling this industry, while environmental regulations are encouraging the use of water-based adhesives.

  • Leading producer of low-cost adhesive tapes for global markets
  • Increasing integration of acrylic and hot-melt adhesive technologies
  • Automation and investments in water-based adhesives are driving growth

India Multifunctional Adhesive Tape Market Growth

The industry in India is projected to grow at a 4.2% CAGR from 2025 to 2035. Growth is driven by rising demand in sectors such as construction, consumer goods, and healthcare packaging. Companies like Pro Tapes & Specialties, Bostik, and Henkel are expanding their local presence to offer cost-effective solutions.

Government initiatives, such as “Make in India”, are fostering domestic manufacturing. While challenges such as limited automation and the need for high-performance materials persist, the industry is expected to benefit from localized innovations and a growing export industry.

  • Growth driven by demand in construction and healthcare packaging
  • Government support for local manufacturing through initiatives like “Make in India”
  • Localized innovations and rising export opportunities support industry growth

South Korea Multifunctional Adhesive Tape Market Growth

The industry in South Korea is expected to grow at a 4.9% CAGR from 2025 to 2035. Strong demand in the electronics, semiconductor, and battery sectors is driving industry growth. Companies like Nitto Denko and Lintec Corporation are supplying high-precision tapes for critical applications such as anti-static, EMI shielding, and thermal conductivity.

Additionally, government investments in clean energy and smart mobility technologies are contributing to growth. The increasing use of low-outgassing adhesives in cleanroom environments to meet environmental and health standards is further driving industry expansion.
  • Rising demand for high-precision tapes in electronics and semiconductors
  • Government investments in clean energy and smart mobility
  • Growing use of low-outgassing adhesives in cleanroom environments

Leading Multifunctional Adhesive Tape Market Suppliers

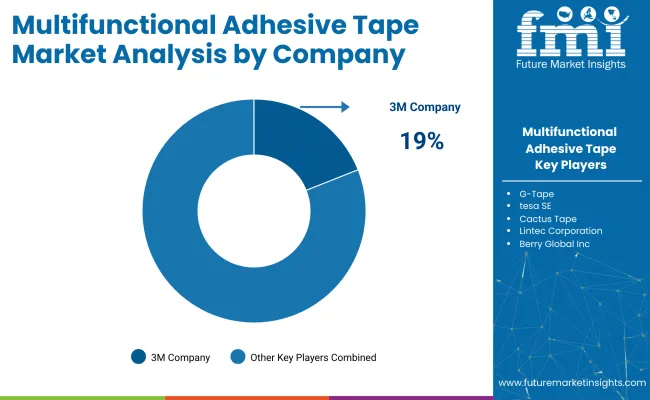
Multifunctional Adhesive Tape Market Analysis By Company

The global industry features a competitive landscape with dominant players, key players, and emerging players. Dominant players such as 3M Tapes, tesa SE, and Avery Dennison Performance Tapes lead the industry with extensive product portfolios, strong R&D capabilities, and robust distribution networks across automotive, electronics, and industrial sectors. Key players including Lohmann Tape Group, VIBAC Group, and PR International Ltd. offer specialized solutions tailored to specific applications and regional industries.

Emerging players, such as JIANGYIN MEIYUAN INDUSTRIES CORPORATION, Wingtai (Zhongshan) Co., Ltd., and Flexibond Industries Pvt. Ltd., focus on innovative technologies and cost-effective solutions, expanding their presence in the global industry.

Recent Multifunctional Adhesive Tape Industry News

  • In December 2024, Ahlstrom launched Master Tape® Cristal, a transparent, paper-based tape backing made entirely from renewable materials. Certified recyclable and compostable, it offers a green alternative to plastic-based tapes.
  • In May 2025, Bostik confirmed a USD 27 million investment in its Middleton, MA plant to scale production of multifunctional adhesives and sealants for industrial industrys. Both developments underscore the industry’s push toward eco-friendly, high-performance bonding solutions. These announcements are officially verified through Ahlstrom’s and Bostik’s press releases, reflecting a strategic shift in the adhesive tape industry toward circular materials and next-generation manufacturing capabilities.

Leading Players

  • 3M Tapes
  • tesa SE
  • Avery Dennison Performance Tapes
  • Lohmann Tape Group
  • PAL Adhesive Products (PALBond®)
  • VIBAC Group
  • PR International Ltd.
  • JIANGYIN MEIYUAN INDUSTRIES CORPORATION
  • Wingtai (Zhongshan) Co., Ltd.
  • Flexibond Industries Pvt. Ltd.

Report Scope

Report Attributes Details
Current Total Industry Size (2025) USD 2.3 billion
Projected Industry Size (2035) USD 3.7 billion
CAGR (2025 to 2035) 4.9%
Base Year for Estimation 2024
Historical Period 2020 to 2024
Projections Period 2025 to 2035
Quantitative Units USD billion for value and million square meters for volume
Adhesive Types Analyzed Acrylic, Rubber, Silicone, Hot Melt, Others
Backing Material Types Analyzed Polyethylene (PE), Polypropylene (PP), PVC (Polyvinyl Chloride), Paper, Fabric, Others
End-Use Segmentation Electrical Insulation, Automotive, Packaging, Construction, Healthcare, Consumer Goods, Electronics, Others
Regions Covered North America, Latin America, Western Europe, Eastern Europe, East Asia, South Asia, Middle East & Africa (MEA)
Countries Covered United States, Canada, Mexico, Brazil, Argentina, Germany, France, United Kingdom, Italy, Spain, Netherlands, China, India, Japan, South Korea, Australia, New Zealand, GCC Countries, South Africa
Leading Players in the Industry 3M Tapes (USA), tesa SE (Germany), Avery Dennison Performance Tapes, Lohmann Tape Group (Germany), PAL Adhesive Products (United Kingdom), VIBAC Group, PR International Ltd., Jiangyin Meiyuan Industries Corporation, Wingtai (Zhongshan) Co., Ltd., and Flexibond Industries Pvt. Ltd. (India).
Additional Attributes Dollar sales by adhesive type, backing material, and end-use, increasing demand for eco-friendly and engineered tapes, trends in industrial and automotive applications, regional variations in tape adoption, and innovations in specialty and high-performance tapes.

Multifunctional Adhesive Tape Market Analyzed by Key Investment Segments

By Adhesive:

By adhesive, the industry is segmented into acrylic, rubber, silicone, hot melt, and others.

By Backing Material:

By backing material, the industry includes polyethylene (PE), polypropylene (PP), PVC (Polyvinyl Chloride), paper, fabric, and others.

By End-use:

By end-use, industry is segmented into electrical insulation, automotive, packaging, construction, healthcare, consumer goods, electronics, and others.

By Region:

The key regions analyzed in this industry include North America, Latin America, Western Europe, Eastern Europe, East Asia, South Asia, the Middle East and Africa (MEA).

Table of Content

  1. Executive Summary
    • Global Market Outlook
    • Demand-side Trends
    • Supply-side Trends
    • Technology Roadmap Analysis
    • Analysis and Recommendations
  2. Market Overview
    • Market Coverage / Taxonomy
    • Market Definition / Scope / Limitations
  3. Market Background
    • Market Dynamics
      • Drivers
      • Restraints
      • Opportunity
      • Trends
    • Scenario Forecast
      • Demand in Optimistic Scenario
      • Demand in Likely Scenario
      • Demand in Conservative Scenario
    • Opportunity Map Analysis
    • Product Life Cycle Analysis
    • Supply Chain Analysis
      • Supply Side Participants and their Roles
        • Producers
        • Mid-Level Participants (Traders/ Agents/ Brokers)
        • Wholesalers and Distributors
      • Value Added and Value Created at Node in the Supply Chain
      • List of Raw Material Suppliers
      • List of Existing and Potential Buyer’s
    • Investment Feasibility Matrix
    • Value Chain Analysis
      • Profit Margin Analysis
      • Wholesalers and Distributors
      • Retailers
    • PESTLE and Porter’s Analysis
    • Regulatory Landscape
      • By Key Regions
      • By Key Countries
    • Regional Parent Market Outlook
    • Production and Consumption Statistics
    • Import and Export Statistics
  4. Global Market Analysis 2020 to 2024 and Forecast, 2025 to 2035
    • Historical Market Size Value (USD Billion) & Volume (Million sq. mt.) Analysis, 2020 to 2024
    • Current and Future Market Size Value (USD Billion) & Volume (Million sq. mt.) Projections, 2025 to 2035
      • Y-o-Y Growth Trend Analysis
      • Absolute $ Opportunity Analysis
  5. Global Market Pricing Analysis 2020 to 2024 and Forecast 2025 to 2035
  6. Global Market Analysis 2020 to 2024 and Forecast 2025 to 2035, By Adhesive
    • Introduction / Key Findings
    • Historical Market Size Value (USD Billion) & Volume (Million sq. mt.) Analysis By Adhesive, 2020 to 2024
    • Current and Future Market Size Value (USD Billion) & Volume (Million sq. mt.) Analysis and Forecast By Adhesive, 2025 to 2035
      • Acrylic
      • Rubber
      • Silicone
      • Hot Melt
      • Others
    • Y-o-Y Growth Trend Analysis By Adhesive, 2020 to 2024
    • Absolute $ Opportunity Analysis By Adhesive, 2025 to 2035
  7. Global Market Analysis 2020 to 2024 and Forecast 2025 to 2035, By Backing Material
    • Introduction / Key Findings
    • Historical Market Size Value (USD Billion) & Volume (Million sq. mt.) Analysis By Backing Material, 2020 to 2024
    • Current and Future Market Size Value (USD Billion) & Volume (Million sq. mt.) Analysis and Forecast By Backing Material, 2025 to 2035
      • Polyethylene (PE)
      • Polypropylene (PP)
      • PVC (Polyvinyl Chloride)
      • Paper
      • Fabric
      • Others
    • Y-o-Y Growth Trend Analysis By Backing Material, 2020 to 2024
    • Absolute $ Opportunity Analysis By Backing Material, 2025 to 2035
  8. Global Market Analysis 2020 to 2024 and Forecast 2025 to 2035, By End-use
    • Introduction / Key Findings
    • Historical Market Size Value (USD Billion) & Volume (Million sq. mt.) Analysis By End-use, 2020 to 2024
    • Current and Future Market Size Value (USD Billion) & Volume (Million sq. mt.) Analysis and Forecast By End-use, 2025 to 2035
      • Electrical Insulation
      • Automotive
      • Packaging
      • Construction
      • Healthcare
      • Consumer Goods
      • Electronics
      • Others
    • Y-o-Y Growth Trend Analysis By End-use, 2020 to 2024
    • Absolute $ Opportunity Analysis By End-use, 2025 to 2035
  9. Global Market Analysis 2020 to 2024 and Forecast 2025 to 2035, By Region
    • Introduction
    • Historical Market Size Value (USD Billion) & Volume (Million sq. mt.) Analysis By Region, 2020 to 2024
    • Current Market Size Value (USD Billion) & Volume (Million sq. mt.) Analysis and Forecast By Region, 2025 to 2035
      • North America
      • Latin America
      • Western Europe
      • Eastern Europe
      • East Asia
      • South Asia & Pacific
      • Middle East and Africa
    • Market Attractiveness Analysis By Region
  10. North America Market Analysis 2020 to 2024 and Forecast 2025 to 2035, By Country
    • Historical Market Size Value (USD Billion) & Volume (Million sq. mt.) Trend Analysis By Market Taxonomy, 2020 to 2024
    • Market Size Value (USD Billion) & Volume (Million sq. mt.) Forecast By Market Taxonomy, 2025 to 2035
      • By Country
        • USA
        • Canada
        • Mexico
      • By Adhesive
      • By Backing Material
      • By End-use
    • Market Attractiveness Analysis
      • By Country
      • By Adhesive
      • By Backing Material
      • By End-use
    • Key Takeaways
  11. Latin America Market Analysis 2020 to 2024 and Forecast 2025 to 2035, By Country
    • Historical Market Size Value (USD Billion) & Volume (Million sq. mt.) Trend Analysis By Market Taxonomy, 2020 to 2024
    • Market Size Value (USD Billion) & Volume (Million sq. mt.) Forecast By Market Taxonomy, 2025 to 2035
      • By Country
        • Brazil
        • Argentina
        • Rest of LATAM
      • By Adhesive
      • By Backing Material
      • By End-use
    • Market Attractiveness Analysis
      • By Country
      • By Adhesive
      • By Backing Material
      • By End-use
    • Key Takeaways
  12. Western Europe Market Analysis 2020 to 2024 and Forecast 2025 to 2035, By Country
    • Historical Market Size Value (USD Billion) & Volume (Million sq. mt.) Trend Analysis By Market Taxonomy, 2020 to 2024
    • Market Size Value (USD Billion) & Volume (Million sq. mt.) Forecast By Market Taxonomy, 2025 to 2035
      • By Country
        • Germany
        • Italy
        • France
        • UK
        • Spain
        • BENELUX
        • Nordic
        • Rest of W. Europe
      • By Adhesive
      • By Backing Material
      • By End-use
    • Market Attractiveness Analysis
      • By Country
      • By Adhesive
      • By Backing Material
      • By End-use
    • Key Takeaways
  13. Eastern Europe Market Analysis 2020 to 2024 and Forecast 2025 to 2035, By Country
    • Historical Market Size Value (USD Billion) & Volume (Million sq. mt.) Trend Analysis By Market Taxonomy, 2020 to 2024
    • Market Size Value (USD Billion) & Volume (Million sq. mt.) Forecast By Market Taxonomy, 2025 to 2035
      • By Country
        • Russia
        • Hungary
        • Poland
        • Balkan & Baltics
        • Rest of E. Europe
      • By Adhesive
      • By Backing Material
      • By End-use
    • Market Attractiveness Analysis
      • By Country
      • By Adhesive
      • By Backing Material
      • By End-use
    • Key Takeaways
  14. East Asia Market Analysis 2020 to 2024 and Forecast 2025 to 2035, By Country
    • Historical Market Size Value (USD Billion) & Volume (Million sq. mt.) Trend Analysis By Market Taxonomy, 2020 to 2024
    • Market Size Value (USD Billion) & Volume (Million sq. mt.) Forecast By Market Taxonomy, 2025 to 2035
      • By Country
        • China
        • Japan
        • South Korea
      • By Adhesive
      • By Backing Material
      • By End-use
    • Market Attractiveness Analysis
      • By Country
      • By Adhesive
      • By Backing Material
      • By End-use
    • Key Takeaways
  15. South Asia & Pacific Market Analysis 2020 to 2024 and Forecast 2025 to 2035, By Country
    • Historical Market Size Value (USD Billion) & Volume (Million sq. mt.) Trend Analysis By Market Taxonomy, 2020 to 2024
    • Market Size Value (USD Billion) & Volume (Million sq. mt.) Forecast By Market Taxonomy, 2025 to 2035
      • By Country
        • India
        • Australia & New Zealand
        • ASEAN
        • Rest of SAP
      • By Adhesive
      • By Backing Material
      • By End-use
    • Market Attractiveness Analysis
      • By Country
      • By Adhesive
      • By Backing Material
      • By End-use
    • Key Takeaways
  16. Middle East and Africa Market Analysis 2020 to 2024 and Forecast 2025 to 2035, By Country
    • Historical Market Size Value (USD Billion) & Volume (Million sq. mt.) Trend Analysis By Market Taxonomy, 2020 to 2024
    • Market Size Value (USD Billion) & Volume (Million sq. mt.) Forecast By Market Taxonomy, 2025 to 2035
      • By Country
        • GCC Countries
        • Northern Africa
        • South Africa
        • Turkiye
        • Rest of MEA
      • By Adhesive
      • By Backing Material
      • By End-use
    • Market Attractiveness Analysis
      • By Country
      • By Adhesive
      • By Backing Material
      • By End-use
    • Key Takeaways
  17. Key Countries Market Analysis
    • USA
      • Pricing Analysis
      • Market Share Analysis, 2024
        • By Adhesive
        • By Backing Material
        • By End-use
    • Canada
      • Pricing Analysis
      • Market Share Analysis, 2024
        • By Adhesive
        • By Backing Material
        • By End-use
    • Brazil
      • Pricing Analysis
      • Market Share Analysis, 2024
        • By Adhesive
        • By Backing Material
        • By End-use
    • Mexico
      • Pricing Analysis
      • Market Share Analysis, 2024
        • By Adhesive
        • By Backing Material
        • By End-use
    • Argentina
      • Pricing Analysis
      • Market Share Analysis, 2024
        • By Adhesive
        • By Backing Material
        • By End-use
  18. Market Structure Analysis
    • Competition Dashboard
    • Competition Benchmarking
    • Market Share Analysis of Top Players
      • By Regional
      • By Adhesive
      • By Backing Material
      • By End-use
  19. Competition Analysis
    • Competition Deep Dive
      • 3M Tapes
        • Overview
        • Product Portfolio
        • Profitability by Market Segments (Product/Age /Sales Channel/Region)
        • Sales Footprint
        • Strategy Overview
          • Marketing Strategy
          • Product Strategy
          • Channel Strategy
      • tesa SE
        • Overview
        • Product Portfolio
        • Profitability by Market Segments (Product/Age /Sales Channel/Region)
        • Sales Footprint
        • Strategy Overview
          • Marketing Strategy
          • Product Strategy
          • Channel Strategy
      • Avery Dennison Performance Tapes
        • Overview
        • Product Portfolio
        • Profitability by Market Segments (Product/Age /Sales Channel/Region)
        • Sales Footprint
        • Strategy Overview
          • Marketing Strategy
          • Product Strategy
          • Channel Strategy
      • Lohmann Tape Group
        • Overview
        • Product Portfolio
        • Profitability by Market Segments (Product/Age /Sales Channel/Region)
        • Sales Footprint
        • Strategy Overview
          • Marketing Strategy
          • Product Strategy
          • Channel Strategy
      • PAL Adhesive Products (PALBond®)
        • Overview
        • Product Portfolio
        • Profitability by Market Segments (Product/Age /Sales Channel/Region)
        • Sales Footprint
        • Strategy Overview
          • Marketing Strategy
          • Product Strategy
          • Channel Strategy
      • VIBAC Group
        • Overview
        • Product Portfolio
        • Profitability by Market Segments (Product/Age /Sales Channel/Region)
        • Sales Footprint
        • Strategy Overview
          • Marketing Strategy
          • Product Strategy
          • Channel Strategy
      • PR International Ltd.
        • Overview
        • Product Portfolio
        • Profitability by Market Segments (Product/Age /Sales Channel/Region)
        • Sales Footprint
        • Strategy Overview
          • Marketing Strategy
          • Product Strategy
          • Channel Strategy
      • JIANGYIN MEIYUAN INDUSTRIES CORPORATION
        • Overview
        • Product Portfolio
        • Profitability by Market Segments (Product/Age /Sales Channel/Region)
        • Sales Footprint
        • Strategy Overview
          • Marketing Strategy
          • Product Strategy
          • Channel Strategy
      • Wingtai (Zhongshan) Co., Ltd.
        • Overview
        • Product Portfolio
        • Profitability by Market Segments (Product/Age /Sales Channel/Region)
        • Sales Footprint
        • Strategy Overview
          • Marketing Strategy
          • Product Strategy
          • Channel Strategy
      • Flexibond Industries Pvt. Ltd.
        • Overview
        • Product Portfolio
        • Profitability by Market Segments (Product/Age /Sales Channel/Region)
        • Sales Footprint
        • Strategy Overview
          • Marketing Strategy
          • Product Strategy
          • Channel Strategy
  20. Assumptions & Acronyms Used
  21. Research Methodology

List of Tables

  • Table 1: Global Market Value (USD Billion) Forecast by Region, 2020 to 2035
  • Table 2: Global Market Volume (Million sq. mt.) Forecast by Region, 2020 to 2035
  • Table 3: Global Market Value (USD Billion) Forecast by Adhesive, 2020 to 2035
  • Table 4: Global Market Volume (Million sq. mt.) Forecast by Adhesive, 2020 to 2035
  • Table 5: Global Market Value (USD Billion) Forecast by Backing Material, 2020 to 2035
  • Table 6: Global Market Volume (Million sq. mt.) Forecast by Backing Material, 2020 to 2035
  • Table 7: Global Market Value (USD Billion) Forecast by End-use, 2020 to 2035
  • Table 8: Global Market Volume (Million sq. mt.) Forecast by End-use, 2020 to 2035
  • Table 9: North America Market Value (USD Billion) Forecast by Country, 2020 to 2035
  • Table 10: North America Market Volume (Million sq. mt.) Forecast by Country, 2020 to 2035
  • Table 11: North America Market Value (USD Billion) Forecast by Adhesive, 2020 to 2035
  • Table 12: North America Market Volume (Million sq. mt.) Forecast by Adhesive, 2020 to 2035
  • Table 13: North America Market Value (USD Billion) Forecast by Backing Material, 2020 to 2035
  • Table 14: North America Market Volume (Million sq. mt.) Forecast by Backing Material, 2020 to 2035
  • Table 15: North America Market Value (USD Billion) Forecast by End-use, 2020 to 2035
  • Table 16: North America Market Volume (Million sq. mt.) Forecast by End-use, 2020 to 2035
  • Table 17: Latin America Market Value (USD Billion) Forecast by Country, 2020 to 2035
  • Table 18: Latin America Market Volume (Million sq. mt.) Forecast by Country, 2020 to 2035
  • Table 19: Latin America Market Value (USD Billion) Forecast by Adhesive, 2020 to 2035
  • Table 20: Latin America Market Volume (Million sq. mt.) Forecast by Adhesive, 2020 to 2035
  • Table 21: Latin America Market Value (USD Billion) Forecast by Backing Material, 2020 to 2035
  • Table 22: Latin America Market Volume (Million sq. mt.) Forecast by Backing Material, 2020 to 2035
  • Table 23: Latin America Market Value (USD Billion) Forecast by End-use, 2020 to 2035
  • Table 24: Latin America Market Volume (Million sq. mt.) Forecast by End-use, 2020 to 2035
  • Table 25: Western Europe Market Value (USD Billion) Forecast by Country, 2020 to 2035
  • Table 26: Western Europe Market Volume (Million sq. mt.) Forecast by Country, 2020 to 2035
  • Table 27: Western Europe Market Value (USD Billion) Forecast by Adhesive, 2020 to 2035
  • Table 28: Western Europe Market Volume (Million sq. mt.) Forecast by Adhesive, 2020 to 2035
  • Table 29: Western Europe Market Value (USD Billion) Forecast by Backing Material, 2020 to 2035
  • Table 30: Western Europe Market Volume (Million sq. mt.) Forecast by Backing Material, 2020 to 2035
  • Table 31: Western Europe Market Value (USD Billion) Forecast by End-use, 2020 to 2035
  • Table 32: Western Europe Market Volume (Million sq. mt.) Forecast by End-use, 2020 to 2035
  • Table 33: Eastern Europe Market Value (USD Billion) Forecast by Country, 2020 to 2035
  • Table 34: Eastern Europe Market Volume (Million sq. mt.) Forecast by Country, 2020 to 2035
  • Table 35: Eastern Europe Market Value (USD Billion) Forecast by Adhesive, 2020 to 2035
  • Table 36: Eastern Europe Market Volume (Million sq. mt.) Forecast by Adhesive, 2020 to 2035
  • Table 37: Eastern Europe Market Value (USD Billion) Forecast by Backing Material, 2020 to 2035
  • Table 38: Eastern Europe Market Volume (Million sq. mt.) Forecast by Backing Material, 2020 to 2035
  • Table 39: Eastern Europe Market Value (USD Billion) Forecast by End-use, 2020 to 2035
  • Table 40: Eastern Europe Market Volume (Million sq. mt.) Forecast by End-use, 2020 to 2035
  • Table 41: East Asia Market Value (USD Billion) Forecast by Country, 2020 to 2035
  • Table 42: East Asia Market Volume (Million sq. mt.) Forecast by Country, 2020 to 2035
  • Table 43: East Asia Market Value (USD Billion) Forecast by Adhesive, 2020 to 2035
  • Table 44: East Asia Market Volume (Million sq. mt.) Forecast by Adhesive, 2020 to 2035
  • Table 45: East Asia Market Value (USD Billion) Forecast by Backing Material, 2020 to 2035
  • Table 46: East Asia Market Volume (Million sq. mt.) Forecast by Backing Material, 2020 to 2035
  • Table 47: East Asia Market Value (USD Billion) Forecast by End-use, 2020 to 2035
  • Table 48: East Asia Market Volume (Million sq. mt.) Forecast by End-use, 2020 to 2035
  • Table 49: South Asia & Pacific Market Value (USD Billion) Forecast by Country, 2020 to 2035
  • Table 50: South Asia & Pacific Market Volume (Million sq. mt.) Forecast by Country, 2020 to 2035
  • Table 51: South Asia & Pacific Market Value (USD Billion) Forecast by Adhesive, 2020 to 2035
  • Table 52: South Asia & Pacific Market Volume (Million sq. mt.) Forecast by Adhesive, 2020 to 2035
  • Table 53: South Asia & Pacific Market Value (USD Billion) Forecast by Backing Material, 2020 to 2035
  • Table 54: South Asia & Pacific Market Volume (Million sq. mt.) Forecast by Backing Material, 2020 to 2035
  • Table 55: South Asia & Pacific Market Value (USD Billion) Forecast by End-use, 2020 to 2035
  • Table 56: South Asia & Pacific Market Volume (Million sq. mt.) Forecast by End-use, 2020 to 2035
  • Table 57: Middle East and Africa Market Value (USD Billion) Forecast by Country, 2020 to 2035
  • Table 58: Middle East and Africa Market Volume (Million sq. mt.) Forecast by Country, 2020 to 2035
  • Table 59: Middle East and Africa Market Value (USD Billion) Forecast by Adhesive, 2020 to 2035
  • Table 60: Middle East and Africa Market Volume (Million sq. mt.) Forecast by Adhesive, 2020 to 2035
  • Table 61: Middle East and Africa Market Value (USD Billion) Forecast by Backing Material, 2020 to 2035
  • Table 62: Middle East and Africa Market Volume (Million sq. mt.) Forecast by Backing Material, 2020 to 2035
  • Table 63: Middle East and Africa Market Value (USD Billion) Forecast by End-use, 2020 to 2035
  • Table 64: Middle East and Africa Market Volume (Million sq. mt.) Forecast by End-use, 2020 to 2035

List of Figures

  • Figure 1: Global Market Volume (Million sq. mt.) Forecast 2020 to 2035
  • Figure 2: Global Market Pricing Analysis
  • Figure 3: Global Market Value (USD Billion) Forecast 2020 to 2035
  • Figure 4: Global Market Value Share and BPS Analysis by Adhesive, 2025 and 2035
  • Figure 5: Global Market Y-o-Y Growth Comparison by Adhesive, 2025 to 2035
  • Figure 6: Global Market Attractiveness Analysis by Adhesive
  • Figure 7: Global Market Value Share and BPS Analysis by Backing Material, 2025 and 2035
  • Figure 8: Global Market Y-o-Y Growth Comparison by Backing Material, 2025 to 2035
  • Figure 9: Global Market Attractiveness Analysis by Backing Material
  • Figure 10: Global Market Value Share and BPS Analysis by End-use, 2025 and 2035
  • Figure 11: Global Market Y-o-Y Growth Comparison by End-use, 2025 to 2035
  • Figure 12: Global Market Attractiveness Analysis by End-use
  • Figure 13: Global Market Value (USD Billion) Share and BPS Analysis by Region, 2025 and 2035
  • Figure 14: Global Market Y-o-Y Growth Comparison by Region, 2025 to 2035
  • Figure 15: Global Market Attractiveness Analysis by Region
  • Figure 16: North America Market Incremental $ Opportunity, 2025 to 2035
  • Figure 17: Latin America Market Incremental $ Opportunity, 2025 to 2035
  • Figure 18: Western Europe Market Incremental $ Opportunity, 2025 to 2035
  • Figure 19: Eastern Europe Market Incremental $ Opportunity, 2025 to 2035
  • Figure 20: East Asia Market Incremental $ Opportunity, 2025 to 2035
  • Figure 21: South Asia & Pacific Market Incremental $ Opportunity, 2025 to 2035
  • Figure 22: Middle East and Africa Market Incremental $ Opportunity, 2025 to 2035
  • Figure 23: North America Market Value Share and BPS Analysis by Country, 2025 and 2035
  • Figure 24: North America Market Value Share and BPS Analysis by Adhesive, 2025 and 2035
  • Figure 25: North America Market Y-o-Y Growth Comparison by Adhesive, 2025 to 2035
  • Figure 26: North America Market Attractiveness Analysis by Adhesive
  • Figure 27: North America Market Value Share and BPS Analysis by Backing Material, 2025 and 2035
  • Figure 28: North America Market Y-o-Y Growth Comparison by Backing Material, 2025 to 2035
  • Figure 29: North America Market Attractiveness Analysis by Backing Material
  • Figure 30: North America Market Value Share and BPS Analysis by End-use, 2025 and 2035
  • Figure 31: North America Market Y-o-Y Growth Comparison by End-use, 2025 to 2035
  • Figure 32: North America Market Attractiveness Analysis by End-use
  • Figure 33: Latin America Market Value Share and BPS Analysis by Country, 2025 and 2035
  • Figure 34: Latin America Market Value Share and BPS Analysis by Adhesive, 2025 and 2035
  • Figure 35: Latin America Market Y-o-Y Growth Comparison by Adhesive, 2025 to 2035
  • Figure 36: Latin America Market Attractiveness Analysis by Adhesive
  • Figure 37: Latin America Market Value Share and BPS Analysis by Backing Material, 2025 and 2035
  • Figure 38: Latin America Market Y-o-Y Growth Comparison by Backing Material, 2025 to 2035
  • Figure 39: Latin America Market Attractiveness Analysis by Backing Material
  • Figure 40: Latin America Market Value Share and BPS Analysis by End-use, 2025 and 2035
  • Figure 41: Latin America Market Y-o-Y Growth Comparison by End-use, 2025 to 2035
  • Figure 42: Latin America Market Attractiveness Analysis by End-use
  • Figure 43: Western Europe Market Value Share and BPS Analysis by Country, 2025 and 2035
  • Figure 44: Western Europe Market Value Share and BPS Analysis by Adhesive, 2025 and 2035
  • Figure 45: Western Europe Market Y-o-Y Growth Comparison by Adhesive, 2025 to 2035
  • Figure 46: Western Europe Market Attractiveness Analysis by Adhesive
  • Figure 47: Western Europe Market Value Share and BPS Analysis by Backing Material, 2025 and 2035
  • Figure 48: Western Europe Market Y-o-Y Growth Comparison by Backing Material, 2025 to 2035
  • Figure 49: Western Europe Market Attractiveness Analysis by Backing Material
  • Figure 50: Western Europe Market Value Share and BPS Analysis by End-use, 2025 and 2035
  • Figure 51: Western Europe Market Y-o-Y Growth Comparison by End-use, 2025 to 2035
  • Figure 52: Western Europe Market Attractiveness Analysis by End-use
  • Figure 53: Eastern Europe Market Value Share and BPS Analysis by Country, 2025 and 2035
  • Figure 54: Eastern Europe Market Value Share and BPS Analysis by Adhesive, 2025 and 2035
  • Figure 55: Eastern Europe Market Y-o-Y Growth Comparison by Adhesive, 2025 to 2035
  • Figure 56: Eastern Europe Market Attractiveness Analysis by Adhesive
  • Figure 57: Eastern Europe Market Value Share and BPS Analysis by Backing Material, 2025 and 2035
  • Figure 58: Eastern Europe Market Y-o-Y Growth Comparison by Backing Material, 2025 to 2035
  • Figure 59: Eastern Europe Market Attractiveness Analysis by Backing Material
  • Figure 60: Eastern Europe Market Value Share and BPS Analysis by End-use, 2025 and 2035
  • Figure 61: Eastern Europe Market Y-o-Y Growth Comparison by End-use, 2025 to 2035
  • Figure 62: Eastern Europe Market Attractiveness Analysis by End-use
  • Figure 63: East Asia Market Value Share and BPS Analysis by Country, 2025 and 2035
  • Figure 64: East Asia Market Value Share and BPS Analysis by Adhesive, 2025 and 2035
  • Figure 65: East Asia Market Y-o-Y Growth Comparison by Adhesive, 2025 to 2035
  • Figure 66: East Asia Market Attractiveness Analysis by Adhesive
  • Figure 67: East Asia Market Value Share and BPS Analysis by Backing Material, 2025 and 2035
  • Figure 68: East Asia Market Y-o-Y Growth Comparison by Backing Material, 2025 to 2035
  • Figure 69: East Asia Market Attractiveness Analysis by Backing Material
  • Figure 70: East Asia Market Value Share and BPS Analysis by End-use, 2025 and 2035
  • Figure 71: East Asia Market Y-o-Y Growth Comparison by End-use, 2025 to 2035
  • Figure 72: East Asia Market Attractiveness Analysis by End-use
  • Figure 73: South Asia & Pacific Market Value Share and BPS Analysis by Country, 2025 and 2035
  • Figure 74: South Asia & Pacific Market Value Share and BPS Analysis by Adhesive, 2025 and 2035
  • Figure 75: South Asia & Pacific Market Y-o-Y Growth Comparison by Adhesive, 2025 to 2035
  • Figure 76: South Asia & Pacific Market Attractiveness Analysis by Adhesive
  • Figure 77: South Asia & Pacific Market Value Share and BPS Analysis by Backing Material, 2025 and 2035
  • Figure 78: South Asia & Pacific Market Y-o-Y Growth Comparison by Backing Material, 2025 to 2035
  • Figure 79: South Asia & Pacific Market Attractiveness Analysis by Backing Material
  • Figure 80: South Asia & Pacific Market Value Share and BPS Analysis by End-use, 2025 and 2035
  • Figure 81: South Asia & Pacific Market Y-o-Y Growth Comparison by End-use, 2025 to 2035
  • Figure 82: South Asia & Pacific Market Attractiveness Analysis by End-use
  • Figure 83: Middle East and Africa Market Value Share and BPS Analysis by Country, 2025 and 2035
  • Figure 84: Middle East and Africa Market Value Share and BPS Analysis by Adhesive, 2025 and 2035
  • Figure 85: Middle East and Africa Market Y-o-Y Growth Comparison by Adhesive, 2025 to 2035
  • Figure 86: Middle East and Africa Market Attractiveness Analysis by Adhesive
  • Figure 87: Middle East and Africa Market Value Share and BPS Analysis by Backing Material, 2025 and 2035
  • Figure 88: Middle East and Africa Market Y-o-Y Growth Comparison by Backing Material, 2025 to 2035
  • Figure 89: Middle East and Africa Market Attractiveness Analysis by Backing Material
  • Figure 90: Middle East and Africa Market Value Share and BPS Analysis by End-use, 2025 and 2035
  • Figure 91: Middle East and Africa Market Y-o-Y Growth Comparison by End-use, 2025 to 2035
  • Figure 92: Middle East and Africa Market Attractiveness Analysis by End-use
  • Figure 93: Global Market - Tier Structure Analysis
  • Figure 94: Global Market - Company Share Analysis

Frequently Asked Questions

What is the projected size for multifunctional adhesive tape market by 2035?

The industry is expected to reach USD 3.7 billion by 2035.

What is the forecasted CAGR from 2025 to 2035 for the multifunctional adhesive tape market?

The industry is projected to grow at a CAGR of 4.9%.

Which adhesive type holds the highest industry share in the multifunctional adhesive tape market?

Acrylic adhesives lead with a 55% share in 2025 due to versatility and durability.

What is the top end-use segment in 2025 in the multifunctional adhesive tape market?

Electrical insulation is the leading end-use segment, contributing 45% of total demand.

Which country is expected to show the fastest growth in the multifunctional adhesive tape market?

The United Kingdom is projected to grow at the highest CAGR of 6.1% through 2035.

Explore Similar Insights

Future Market Insights

Multifunctional Adhesive Tape Market