The tile adhesive industry stands at the threshold of a decade-long expansion trajectory that promises to reshape floor installation technology, waterproof construction applications, and polymer-modified bonding solutions. The market's journey from USD 3.1 billion in 2025 to USD 6.0 billion by 2035 represents substantial growth, demonstrating the accelerating adoption of polymer-modified cementitious formulations and low-VOC adhesive technology across residential construction, commercial refurbishment, and industrial flooring sectors.
The first half of the decade (2025-2030) will witness the market climbing from USD 3.1 billion to approximately USD 4.3 billion, adding USD 1.2 billion in value, which constitutes 41% of the total forecast growth period. This phase will be characterized by the rapid adoption of quick-setting systems, driven by increasing renovation volumes and the growing need for polymer-modified tile adhesive manufacturing worldwide. Advanced low-emission formulations and dust-reduced packaging will become standard expectations rather than premium options.
The latter half (2030-2035) will witness sustained growth from USD 4.3 billion to USD 6.0 billion, representing an addition of USD 1.7 billion or 59% of the decade's expansion. This period will be defined by mass market penetration of reaction-resin adhesives, integration with comprehensive green building certification programs, and seamless compatibility with advanced large-format tile and prefabricated construction infrastructure. Based on FMI’s verified global materials database, covering industrial resins, coatings, and additives, the market trajectory signals fundamental shifts in how contractors approach installation speed optimization and waterproofing reliability, with participants positioned to benefit from sustained demand across multiple adhesive type categories and application segments.
Integration with advanced green building certification frameworks will also play a crucial role during this period. Builders and developers increasingly prioritize adhesives that comply with low-emission categories, contribute to indoor air quality targets, and support long-term structural performance. This alignment with global construction rating systems will expand demand for certified polymer-modified systems, ensuring adhesive manufacturers adapt their product portfolios accordingly.
Technological advancement will be a major dynamic shaping the industry. Adhesive manufacturers are investing in improved formulations that enhance deformability, increase tensile adhesion, and support installation over substrates such as gypsum boards, fiber cement, underfloor heating systems, and waterproof membranes. R&D efforts focusing on hybrid chemistries, water-retention modifiers, lightweight additives, and reinforcement compounds will produce next-generation adhesives that combine faster curing with higher mechanical performance.
Market dynamics are further shaped by technological innovation within tile adhesive formulations. Manufacturers are advancing R&D efforts in polymer dispersions, redispersible powders, water-retention modifiers, and hydrophobic performance enhancers. These improvements enable adhesives to deliver superior deformability, enhanced moisture resistance, and stronger adhesion to challenging substrates such as gypsum boards, fiber-cement panels, heated floors, and prefabricated modules. As global construction moves steadily toward engineered surfaces and high-value interior finishes, advanced tile adhesives will remain essential.
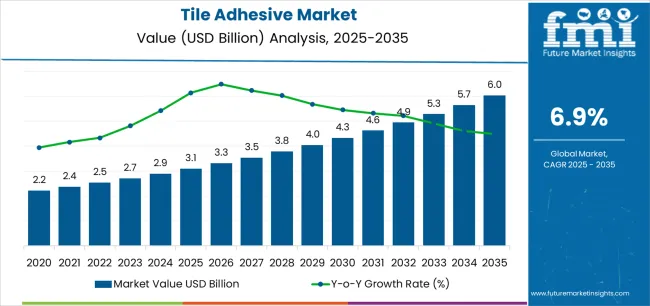
The Tile Adhesive market demonstrates distinct growth phases with varying market characteristics and competitive dynamics. Between 2025 and 2030, the market progresses through its renovation acceleration phase, expanding from USD 3.1 billion to USD 4.3 billion with steady annual increments averaging 6.9% growth. This period showcases the transition from conventional sand-cement mortars to polymer-modified cementitious derivatives with enhanced flexibility characteristics and integrated quick-setting systems becoming mainstream features.
The 2025-2030 phase adds USD 1.2 billion to market value, representing 41% of total decade expansion. Market maturation factors include standardization of low-VOC protocols, declining production costs for polymer-modified formulations, and increasing contractor awareness of rapid-cure benefits reaching polymer-modified specifications in residential and commercial applications. Competitive landscape evolution during this period features established construction chemical companies like Sika AG and MAPEI expanding their green building portfolios while specialty producers focus on waterproof systems and large-format tile compatibility.
From 2030 to 2035, market dynamics shift toward premium specification integration and comprehensive green certification expansion, with growth continuing from USD 4.3 billion to USD 6.0 billion, adding USD 1.7 billion or 59% of total expansion. This phase transition centers on reaction-resin systems, integration with energy-efficient retrofit programs, and deployment across diverse seismic-flexible and rapid-cure scenarios, becoming standard rather than specialized applications. The competitive environment matures with focus shifting from basic tile adhesive production to comprehensive installation system optimization and integration with prefabricated construction platforms.
At-a-Glance Metrics
| Metric | Value |
|---|---|
| Market Value (2025) | USD 3.1 billion |
| Market Forecast (2035) | USD 6.0 billion |
| Growth Rate | 6.9% CAGR |
| Leading Type | Cementitious Type |
| Primary Application | Floor Application Segment |
The market demonstrates strong fundamentals with Cementitious systems capturing a dominant share through polymer-modification and dust-reduction capabilities. Floor applications drive primary demand, supported by increasing renovation volumes and large-format tile installations requiring enhanced bonding technology. Geographic expansion remains concentrated in China with extensive new-build infrastructure, while developed economies show accelerating adoption rates driven by green building preferences and waterproof system growth.
Market expansion rests on three fundamental shifts driving adoption across residential, commercial, and institutional sectors. Renovation boom creates compelling operational advantages through polymer-modified cementitious adhesives that provide superior flexibility and waterproof performance without extensive substrate preparation, enabling contractors to meet building codes while maintaining installation speed and long-term durability requirements. Green building certification accelerates as architects and specifiers worldwide seek low-VOC tile adhesive systems that complement LEED formulations and energy-efficient retrofit applications, enabling effective emission reduction and indoor air quality that align with environmental standards and occupant health requirements.
Large-format tile adoption drives demand from flooring contractors requiring adhesive systems with enhanced coverage and sag resistance that minimizes lippage during installation while maintaining bonding strength during curing operations. However, growth faces headwinds from raw material price volatility that varies across polymer suppliers regarding latex and cement costs, which may limit profitability in cost-sensitive renovation environments. Competition from traditional sand-cement mortars also persists regarding contractor familiarity and price advantages that may reduce polymer-modified consumption in certain residential applications.
The tile adhesive market represents a diversified yet sophisticated bonding solution opportunity driven by expanding global renovation standards, waterproofing system requirements, and advanced installation demand for superior application effectiveness. As contractors worldwide seek to achieve rapid-cure positioning, enhanced waterproofing performance, and green building credentials, tile adhesive is evolving from basic cement mortar commodity to sophisticated polymer-modified system that ensures installation differentiation and code compliance.
The convergence of renovation acceleration awareness, green building momentum, and large-format tile mandates creates sustained demand drivers across multiple application segments. The market's growth trajectory from USD 3.1 billion in 2025 to USD 6.0 billion by 2035 at a 6.9% CAGR reflects fundamental shifts in installation technology requirements and waterproofing optimization.
Geographic expansion opportunities are particularly pronounced in Asian markets, where China (7.5% CAGR) leads through aggressive smart-city programs and polymer-modified mortar development. The dominance of Cementitious type (36.0% market share) and Floor applications (52.0% share) provides clear strategic focus areas, while emerging reaction-resin and prefabricated construction applications open new revenue streams across diverse installation markets.
Strengthening the dominant Cementitious segment (36.0% market share) through enhanced polymer-modification optimization, superior dust-reduction technologies, and flexibility certifications. This pathway focuses on optimizing polymer content to balance workability and performance specifications and developing lightweight packaging formulations for contractor convenience. Market leadership consolidation through technical service, application training systems, and EN/CE certification enables premium positioning while expanding penetration across residential and commercial applications. Expected revenue pool: USD 280-360 million
Rapid growth across China (7.5% CAGR) creates expansion opportunities through domestic new-build volume and integrated urban construction optimization. Smart-city initiatives and high-rise construction strategies reduce traditional mortar dependency, enable faster installation assurance, and position companies advantageously for government housing programs while accessing growing domestic markets requiring polymer-modified and quick-setting tile adhesive. Expected revenue pool: USD 260-340 million
Expansion within the dominant Floor application segment (52.0% market share) through specialized formulations addressing large-format tile needs and heavy-traffic environments. This pathway encompasses enhanced coverage optimization, sag resistance certification, and compatibility with diverse substrate systems, enabling integration with advanced flooring technologies and porcelain tile systems. Expected revenue pool: USD 240-320 million
Strategic expansion into Residential applications (48.0% market share) requires DIY-friendly formulations and specialized systems addressing bathroom waterproofing and kitchen tile requirements. This pathway addresses ease-of-application enhancement, extended open-time optimization, and flexible bonding compatibility, creating opportunities for retail channel partnerships and co-development initiatives with tile manufacturers. Expected revenue pool: USD 200-280 million
Development of advanced reaction-resin technology (34.0% type share) addressing rapid-cure requirements and chemical-resistance enhancement. This pathway encompasses epoxy formulations, polyurethane systems, and hybrid technology. Product differentiation through industrial flooring compatibility and extreme-condition performance enables diversified revenue streams while expanding addressable market opportunities in specialty commercial segments. Expected revenue pool: USD 170-240 million
Integration into green building markets including LEED-compliant, low-emission, and eco-labeled adhesive systems. This pathway encompasses sustainable raw material sourcing, carbon-offset formulations, and comprehensive environmental documentation. Market positioning through third-party certification and comprehensive technical data creates opportunities for specification-driven commercial projects replacing conventional high-emission alternatives. Expected revenue pool: USD 140-200 million
Development of rapid-cure quick-setting systems (fast-track construction segment) addressing compressed installation schedules and early traffic requirements. This pathway encompasses accelerated strength development, reduced curing times, and comprehensive application guidance, enabling access to high-value commercial refurbishment and time-sensitive renovation markets. Expected revenue pool: USD 110-170 million
Primary Classification: The market segments by Type into Cementitious, Reaction-resin (epoxy/PU), and Dispersion categories, representing the evolution from conventional cement mortars to polymer-modified adhesives for comprehensive tile installation optimization.
Secondary Classification: Application segmentation divides the market into Floor, Wall, Ceiling, and Others, reflecting distinct installation environments, substrate requirements, and performance characteristics.
Tertiary Classification: End-Use segmentation covers Residential, Commercial, and Industrial & Institutional sectors, demonstrating diverse demand drivers across construction and renovation applications.
Quaternary Classification: Installation type segmentation by tile format includes ceramic tile, porcelain tile, large-format panels, natural stone, and mosaic, reflecting specific bonding requirements.
Regional Classification: Geographic distribution spans Asia-Pacific, Europe, North America, Latin America, and Middle East & Africa, with Asian markets leading adoption while developed economies show steady growth patterns driven by renovation trends and green building innovation.
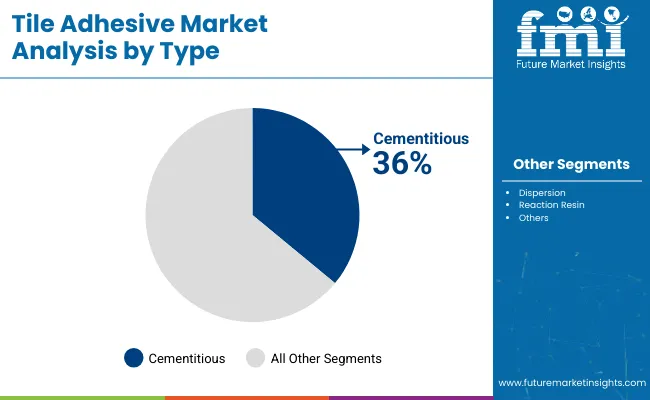
Market Position: Cementitious systems command the leading position in the Tile Adhesive market with approximately 36.0% market share through polymer-modified features, including latex enhancement, dust-reduction formulations, and workability positioning that enable contractors to achieve superior bonding properties across diverse installation environments.
Value Drivers: The segment benefits from contractor preference for familiar application that provides cost-effectiveness, broad substrate compatibility, and code compliance without compromising flexibility and waterproof performance. Advanced polymer-modification features enable enhanced bonding strength, improved crack-bridging capability, and integration with green building systems, where low-VOC certification and emission control represent critical specification requirements.
Competitive Advantages: Cementitious systems differentiate through proven installation track records, widespread contractor training, and integration with renovation programs and building codes that enhance project reliability while maintaining application economics suitable for residential, commercial, and institutional applications.
Key market characteristics:
Reaction-resin systems hold approximately 34% market share in the Tile Adhesive market due to their rapid-cure performance and chemical-resistance advantages in industrial and commercial segments. These systems appeal to contractors requiring fast-track installation with superior bonding for applications where quick turnaround and extreme-condition exposure are mandated. Dispersion adhesives maintain 30.0% share through ready-to-use convenience and flexible application benefits.
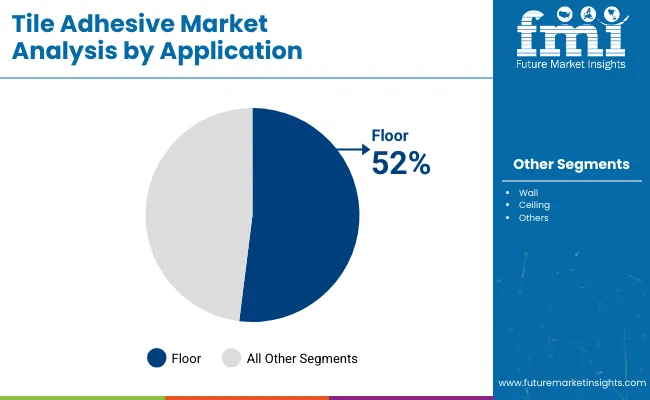
Market Context: Floor application dominates the Tile Adhesive market with approximately 52% market share driven by large-format tile adoption and heavy-traffic flooring requirements that demand effective bonding strength, sag resistance, and substrate flexibility supporting commercial and residential flooring preferences.
Appeal Factors: Contractors prioritize coverage efficiency, extended open-time, and technical support that enable integrated flooring installation programs across application categories. The segment benefits from renovation pressure and large-format trends for porcelain tile and natural stone that emphasize enhanced adhesive systems and minimal lippage assurance.
Growth Drivers: Renovation acceleration creates sustained demand for floor adhesives, while large-format tile regulations mandate adoption of polymer-modified systems for installation reliability and long-term bonding performance.
Market Challenges: Price sensitivity and contractor switching costs may limit profitability during periods of polymer price fluctuations or competitive pressure from traditional sand-cement methods.
Application dynamics include:
Wall applications capture approximately 34.0% market share through bathroom tiling, kitchen backsplashes, and exterior facade systems requiring sag-resistant tile adhesive and comprehensive waterproofing performance for wet-area installations and vertical tile bonding requiring extended open-time and flexible curing.
Ceiling applications account for approximately 4.0% market share, encompassing overhead installations and decorative tile systems where tile adhesive provides sag resistance and rapid initial grab for suspended tile applications in commercial interiors and specialty architectural installations requiring high-grab formulations. Others segment maintains 10.0% share through specialty bonding scenarios.
Growth Accelerators: Renovation boom drives primary adoption as polymer-modified cementitious adhesives provide superior waterproofing capabilities that enable contractors to meet building codes without compromising installation speed, supporting bathroom and kitchen remodeling preferences and regulatory compliance that require flexible and moisture-resistant bonding specifications. Green building certification accelerates market expansion as architects and specifiers seek low-VOC tile adhesive systems that enhance LEED credits and enable sustainable construction platforms, particularly for commercial refurbishments requiring emission-controlled adhesives for occupied building installations. Large-format tile adoption creates sustained demand as flooring contractors worldwide adopt polymer-modified systems that complement porcelain panel positioning, enabling effective sag resistance and lippage control that align with aesthetic standards and installation quality requirements for oversized tile formats.
Growth Inhibitors: Raw material price volatility creates profitability challenges due to fluctuating polymer latex and cement costs affecting adhesive production economics, particularly impacting manufacturers in regions dependent on imported polymer additives or lacking domestic cement supply infrastructure. Competition from traditional sand-cement mortars persists as contractor familiarity, lower material costs, and adequate performance offer economic advantages in certain residential tile applications, potentially limiting polymer-modified adoption in price-sensitive renovation markets where basic bonding specifications permit traditional methods. Technical limitations exist regarding substrate compatibility and curing sensitivity that may reduce effectiveness in certain moisture-prone or rapid-turnaround scenarios, affecting performance in specialized industrial flooring or extreme-temperature applications where precise environmental control challenges adhesive utilization.
Market Evolution Patterns: Adoption accelerates in premium residential, commercial refurbishment, and green building sectors where waterproof positioning and low-VOC preferences justify higher tile adhesive costs, with geographic concentration in China transitioning toward mainstream adoption in developed renovation markets driven by bathroom upgrades and prefabricated construction growth. Technology development focuses on dust-reduced packaging, rapid-cure formulations, and carbon-offset cement that reduce environmental footprint and enable green building positioning for sustainability-conscious specifiers. The market could face disruption if prefabricated tile systems significantly reduce on-site adhesive demand beyond traditional wet-trade applications or if alternative bonding technologies challenge cement-based adhesive positioning, though current renovation intensity provides substantial market stability.
The Tile Adhesive market demonstrates varied regional dynamics with Growth Leaders including China (7.5% CAGR) driving expansion through smart-city programs and polymer-mortar development. High Performers encompass India (7.2% CAGR) and South Korea (7.0% CAGR), benefiting from housing initiatives and premium interior demand. Steady Markets feature Germany (6.6% CAGR), United Kingdom (6.5% CAGR), United States (6.3% CAGR), and Japan (6.2% CAGR), where renovation intensity and green building support consistent growth patterns.
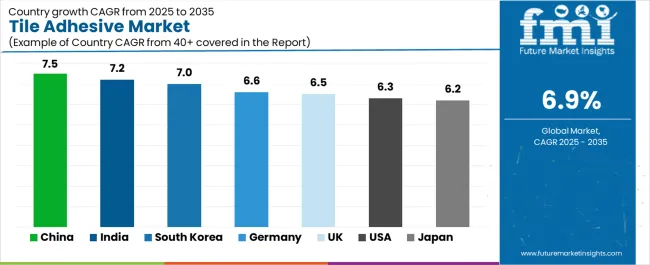
| Country | CAGR (2025-2035) |
|---|---|
| China | 7.5% |
| India | 7.2% |
| South Korea | 7.0% |
| Germany | 6.6% |
| United Kingdom | 6.5% |
| United States | 6.3% |
| Japan | 6.2% |
Regional synthesis reveals Asian markets leading adoption through new-build volume and urban construction intensity, while developed economies maintain steady growth supported by renovation cycles and low-VOC formulation demand. European markets show accelerating expansion driven by energy-efficient retrofit programs and Green Deal alignment.
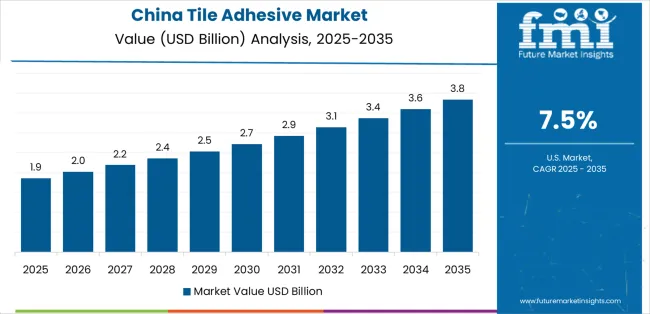
China establishes market leadership with 7.5% CAGR through large new-build volume and smart-city programs, integrating advanced polymer-modified tile adhesive as standard capability in residential high-rise construction and commercial installation facilities. The country's growth reflects government initiatives promoting urban housing under national urbanization programs and rising quality-driven construction under building code modernization that mandate dust-reduced and quick-setting adhesive capabilities.
Expansion concentrates in major urban centers, including Shanghai, Beijing, Guangzhou, and Chengdu, where construction chemical facilities and distribution networks showcase combined tile adhesive production that appeals to domestic contractors and export-oriented manufacturers seeking cost-effective production advantages and quality consistency capabilities.
Chinese tile adhesive producers are developing localized polymer-modification facilities that combine domestic cement with imported latex technology, including large-scale dry-mortar plants that leverage regional raw materials for sustainable manufacturing.
Strategic Market Indicators:
In Maharashtra, Karnataka, and Tamil Nadu, contractors and tile applicators are implementing polymer-modified tile adhesive systems as standard capability for urban housing and commercial construction, driven by increasing housing initiatives and high tile renovation share that emphasize quality bonding and rapid installation.
The market achieves 7.2% CAGR, supported by substantial urban and semi-urban construction investments that leverage India's position as major tile producer for domestic consumption and export while expanding domestic brand capacity through specialty adhesive partnerships. Indian construction chemical companies are adopting optimized cementitious formulations that provide cost-effective waterproofing and flexibility specifications, particularly appealing in residential applications where bathroom and kitchen installations represent critical procurement factors.
Market expansion benefits from comprehensive government housing programs and expanding middle-class renovation demand promoting polymer-modified tile adhesive consumption that enable scaled installation across diverse climate zones for domestic construction and infrastructure markets. Technology adoption follows patterns established in urban apartment construction, where installation speed and quality consistency drive competitive positioning and market access.
Market Intelligence Brief:
South Korea's market expansion demonstrates 7.0% CAGR through premium interiors demand and high-rise construction that increasingly incorporate low-VOC tile adhesive for residential apartments and commercial buildings. The country leverages advanced construction technology base and environmental awareness to attract green building investments and specification-driven adhesive capacity requiring quality assurance. Urban centers, including Seoul, Busan, and Incheon, showcase expanding installations where tile adhesive systems integrate with apartment renovation operations and commercial interiors to optimize aesthetic finish and indoor air quality.
Korean contractors prioritize quick-setting and low-VOC solutions that balance installation speed with environmental considerations important to residential and commercial applications, while building certification programs create sustained demand for third-party verified low-emission adhesives and sustainable construction compliance.
Strategic Market Considerations:
Germany's market maintains 6.6% CAGR through energy-efficient retrofits and green building codes and low-emission adhesive demand that incorporates polymer-modified tile adhesive for renovation applications. The country benefits from environmental leadership in construction chemicals and building code stringency that create specification-driven consumption patterns. North Rhine-Westphalia, Bavaria, and Baden-Württemberg regions showcase established installations where tile adhesive systems provide functional performance across bathroom renovations, commercial refurbishments, and public building retrofit applications.
Market dynamics emphasize sustainable production through low-VOC certification and EU-compliant formulations that delivers reliable performance while accommodating environmental compliance requirements typical of German construction applications, though premium green building and commercial segments show increasing adoption of carbon-offset and eco-labeled grades.
Performance Metrics:
The United Kingdom's market demonstrates 6.5% CAGR through renovation boom and waterproof/flexible systems demand emphasizing bathroom and kitchen tile installations and prefab construction uptake. The country benefits from active housing renovation market and building regulation updates that create sustained tile adhesive consumption patterns. England, Scotland, and Wales regions showcase installations where tile adhesive systems deliver functional performance across residential refurbishment, wet-area installations, and modular housing applications.
British contractors prioritize waterproof certification and flexible formulations from suppliers that provide application guidance and support comprehensive renovation programs, while post-Brexit supply chain adjustments maintain demand for domestically produced and European-sourced adhesives with reliable delivery networks.
Market Intelligence Brief:
The United States demonstrates steady 6.3% CAGR through commercial refurbishments and multifamily housing demand that incorporate polymer-modified cement systems for diverse tile installations. American contractors prioritize consistent quality and technical support from adhesive suppliers that enable integrated construction programs across residential and commercial categories. Technology deployment channels include specialty distributors, big-box retailers, and contractor supply networks that support sophisticated application requirements.
Manufacturing platform integration capabilities with established construction supply chains and contractor training networks expand market appeal across diverse applications seeking performance reliability and code compliance benefits, while specialty quick-setting systems serve fast-track commercial segments demanding accelerated installation schedules.
Market Intelligence Brief:
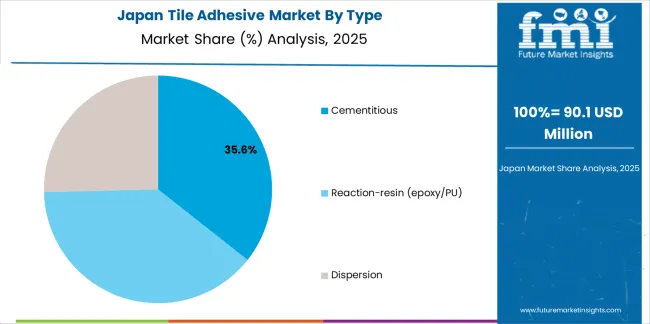
Japan demonstrates steady 6.2% CAGR through seismic-flexible materials demand and modular construction that incorporate rapid-cure/waterproof adhesives for premium residential and commercial tile installations. The country leverages engineering expertise in earthquake-resistant design and construction efficiency to maintain quality leadership in specialty tile adhesive applications. Industrial centers, including Tokyo, Osaka, and Nagoya, showcase premium installations where tile adhesive systems integrate with earthquake-resistant building formulations and prefabricated modules to optimize structural safety and installation speed.
Japanese contractors and construction companies prioritize domestic quality standards and seismic flexibility credentials in tile adhesive sourcing, creating demand for certified formulations with comprehensive documentation supporting building codes and safety requirements.
Market Intelligence Brief:
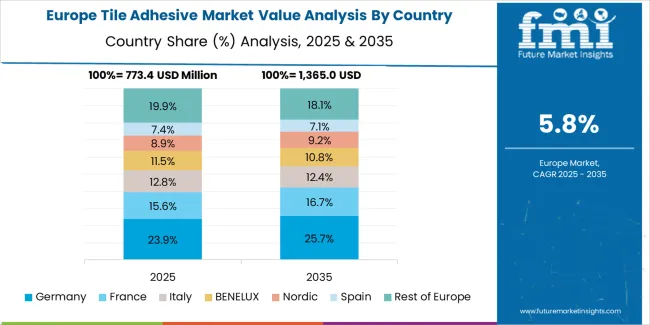
Western Europe accounts for the largest regional demand for tile adhesive in Europe, led by Germany (approximately 26% of European consumption) on the strength of energy-efficient retrofits, Green Deal-aligned renovations, and specification-driven low-VOC adhesive adoption across residential and commercial sectors. France (approximately 18%) reflects balanced demand across bathroom renovations and large-format porcelain installations with growing emphasis on EN/CE-compliant formulations. Italy (approximately 16%) combines traditional tile manufacturing heritage with modern polymer-modified systems for domestic construction and export markets, while Spain (approximately 13%) emphasizes residential renovation and coastal property refurbishment driving waterproof adhesive consumption.
The United Kingdom (approximately 12%) demonstrates strong renovation intensity particularly in bathrooms and kitchens with increasing prefab construction uptake and post-renovation market growth. The Nordics (approximately 9% combined, led by Sweden, Denmark, and Finland) skew toward sustainable construction with green building certifications and low-emission adhesive preferences. Benelux (approximately 4%) benefits from construction logistics hubs and cross-border distribution networks. The remaining approximately 2% is spread across Central & Eastern Europe (notably Poland, Czech Republic, and Hungary) where residential modernization and EU building code harmonization are steadily lifting polymer-modified tile adhesive penetration through expanding renovation programs.
The Tile Adhesive Market is expanding steadily as construction activity rises across residential, commercial, and infrastructure sectors. Growing preference for ceramic, porcelain, and natural stone tiles in both new builds and renovation projects is increasing the need for high-performance adhesives that offer strong bonding, water resistance, and long-term durability. Modern construction practices, including large-format tiling and underfloor heating systems, are further pushing demand for polymer-modified and specialty adhesive formulations that provide flexibility, slip resistance, and faster setting times. Sustainability goals are also influencing product development, with manufacturers introducing low-VOC and environmentally certified adhesives to meet green building standards.
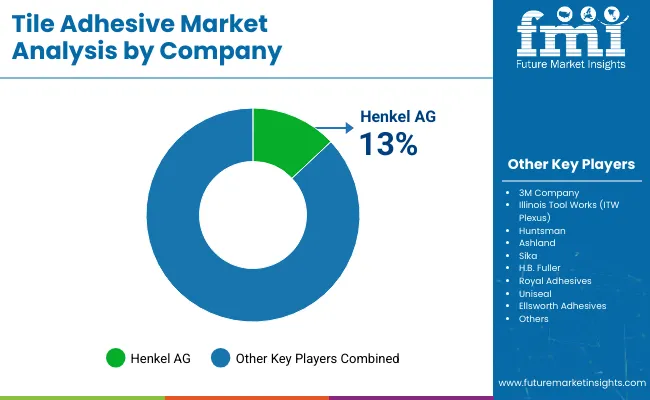
Sika AG, MAPEI S.p.A., and Saint-Gobain Weber anchor the global competitive landscape with extensive portfolios covering cementitious, epoxy, and hybrid tile adhesives tailored for varied climatic conditions and tile types. Their strong technical service networks and on-site support make them preferred partners for large contractors and infrastructure projects. ARDEX Group and LATICRETE continue to reinforce their positions through advanced polymer technologies and high-performance systems designed for heavy-duty and wet-area installations.
Adhesive leaders such as Henkel, H.B. Fuller, and Bostik (Arkema) are leveraging chemical innovation to introduce improved bonding technologies, moisture-resistant systems, and lightweight formulations that ease application and reduce labor effort. In high-growth markets across Asia-Pacific, Pidilite Industries (Roff) is expanding rapidly with region-specific solutions optimized for tropical climates, fast-track construction, and cost-sensitive segments. As construction modernization accelerates globally, manufacturers are competing on technical performance, contractor-focused services, and sustainable product chemistry.
| Item | Value |
|---|---|
| Quantitative Units | USD 3.1 billion |
| Type | Cementitious, Reaction-resin (epoxy/PU), Dispersion |
| Application | Floor, Wall, Ceiling, Others |
| End Use | Residential, Commercial, Industrial & Institutional |
| Installation Type | Ceramic tile, Porcelain tile, Large-format panels, Natural stone, Mosaic |
| Regions Covered | Asia-Pacific, Europe, North America, Latin America, Middle East & Africa |
| Countries Covered | China, India, South Korea, Germany, United Kingdom, United States, Japan, and 25+ additional countries |
| Key Companies Profiled | Sika AG, MAPEI S.p.A., Saint-Gobain Weber, ARDEX Group, LATICRETE, Henkel, H.B. Fuller, Pidilite Industries (Roff), Bostik (Arkema) |
| Additional Attributes | Dollar sales by type, application, end-use, and installation categories, regional adoption trends across Asia-Pacific, Europe, and North America, competitive landscape with construction chemical producers and specialty adhesive companies, contractor and architect preferences for low-VOC positioning and waterproof reliability, integration with renovation programs and green building certification systems, innovations in polymer-modification technology and dust-reduction packaging methods, and development of specialized formulations with enhanced flexibility specifications and comprehensive environmental documentation capabilities. |
The global tile adhesive market is estimated to be valued at USD 3.1 billion in 2025.
The market size for the tile adhesive market is projected to reach USD 6.0 billion by 2035.
The tile adhesive market is expected to grow at a 6.9% CAGR between 2025 and 2035.
The key product types in tile adhesive market are cementitious, reaction-resin (epoxy/pu) and dispersion.
In terms of application, floor segment to command 52.0% share in the tile adhesive market in 2025.


Our Research Products

The "Full Research Suite" delivers actionable market intel, deep dives on markets or technologies, so clients act faster, cut risk, and unlock growth.

The Leaderboard benchmarks and ranks top vendors, classifying them as Established Leaders, Leading Challengers, or Disruptors & Challengers.

Locates where complements amplify value and substitutes erode it, forecasting net impact by horizon

We deliver granular, decision-grade intel: market sizing, 5-year forecasts, pricing, adoption, usage, revenue, and operational KPIs—plus competitor tracking, regulation, and value chains—across 60 countries broadly.

Spot the shifts before they hit your P&L. We track inflection points, adoption curves, pricing moves, and ecosystem plays to show where demand is heading, why it is changing, and what to do next across high-growth markets and disruptive tech

Real-time reads of user behavior. We track shifting priorities, perceptions of today’s and next-gen services, and provider experience, then pace how fast tech moves from trial to adoption, blending buyer, consumer, and channel inputs with social signals (#WhySwitch, #UX).

Partner with our analyst team to build a custom report designed around your business priorities. From analysing market trends to assessing competitors or crafting bespoke datasets, we tailor insights to your needs.
Supplier Intelligence
Discovery & Profiling
Capacity & Footprint
Performance & Risk
Compliance & Governance
Commercial Readiness
Who Supplies Whom
Scorecards & Shortlists
Playbooks & Docs
Category Intelligence
Definition & Scope
Demand & Use Cases
Cost Drivers
Market Structure
Supply Chain Map
Trade & Policy
Operating Norms
Deliverables
Buyer Intelligence
Account Basics
Spend & Scope
Procurement Model
Vendor Requirements
Terms & Policies
Entry Strategy
Pain Points & Triggers
Outputs
Pricing Analysis
Benchmarks
Trends
Should-Cost
Indexation
Landed Cost
Commercial Terms
Deliverables
Brand Analysis
Positioning & Value Prop
Share & Presence
Customer Evidence
Go-to-Market
Digital & Reputation
Compliance & Trust
KPIs & Gaps
Outputs
Full Research Suite comprises of:
Market outlook & trends analysis
Interviews & case studies
Strategic recommendations
Vendor profiles & capabilities analysis
5-year forecasts
8 regions and 60+ country-level data splits
Market segment data splits
12 months of continuous data updates
DELIVERED AS:
PDF EXCEL ONLINE
Adhesives for Electric Vehicle Power Batteries Market Forecast and Outlook 2025 to 2035
Adhesive Films Market Size and Share Forecast Outlook 2025 to 2035
Adhesive Tester Market Size and Share Forecast Outlook 2025 to 2035
Tile Abrasion Testing Market Size and Share Forecast Outlook 2025 to 2035
Adhesives And Sealants Market Size and Share Forecast Outlook 2025 to 2035
Tile Saws Market Size and Share Forecast Outlook 2025 to 2035
Adhesive Modifier Market Analysis - Size, Share, and Forecast Outlook 2025 to 2035
Adhesive Transfer Tape Market Growth, Trends, Forecast 2025 to 2035
Assessing Adhesive Transfer Tape Market Share & Industry Insights
Market Share Breakdown of Adhesive films market Industry
Adhesive for Resilient Floor Market Growth – Trends & Forecast 2024-2034
Adhesive Bubble Wrap Market
Tile Cutter Market
Adhesive Removers Market
Ductile Iron Profile Market Size and Share Forecast Outlook 2025 to 2035
Textile Coatings Market Size and Share Forecast Outlook 2025 to 2035
Ductile and Grey Iron Casting Products Market Size and Share Forecast Outlook 2025 to 2035
Textile Machine Lubricants Market Size and Share Forecast Outlook 2025 to 2035
UV Adhesives Market Size and Share Forecast Outlook 2025 to 2035
Textile Based pH Controllers Market Size and Share Forecast Outlook 2025 to 2035

Thank you!
You will receive an email from our Business Development Manager. Please be sure to check your SPAM/JUNK folder too.
Chat With
MaRIA