


Textile Tester Market : Global Industry Analysis and Opportunity Assessment, 2036
The textile tester market is analyzed in this report through market size quantification, share tracking, revenue and output projections, pricing intelligence, competitive positioning review, demand trajectory analysis, growth stimulants, market obstacles, sustainability-driven material shifts, fast fashion supply chain dynamics, channel performance metrics, supply chain health assessment, policy impact evaluation, capital deployment opportunities, and strategic direction guidance.
- Industry Size (2026): USD 1.48 Bn
- Forecast (2036): USD 2.66 Bn
- CAGR (2026 to 2036): 6.00%
Textile Tester Market Size, Market Forecast and Outlook By FMI
The textile tester market was valued at USD 1.40 billion in 2025, projected to reach USD 1.48 billion in 2026, and is forecast to expand to USD 2.66 billion by 2036 at a 6.00% CAGR.
Summary of Textile Tester Market
- By 2036, the market is projected to be worth USD 2.66 billion.
- A 6.00% compound annual growth rate is anticipated between 2026 and 2036.
- Market size in 2025 was estimated at USD 1.40 billion.
- An absolute dollar opportunity of USD 1.17 billion is anticipated between 2026 and 2036.
- Fabric Testing leads by Application with 34.0% share in 2026.
- Tensile Testing leads by Function with 28.0% share in 2026.
- Growth is sustained by expanding quality compliance requirements from global apparel brands, retailers, and regulatory bodies. Fabric testing instruments account for the largest application share, driven by increasing demand for tensile strength, colorfastness, and flammability verification.
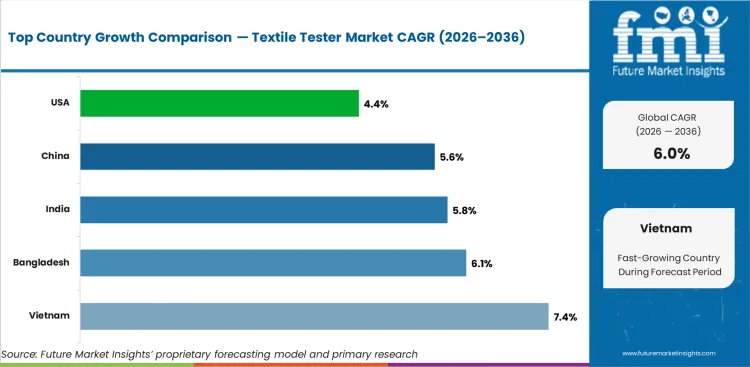
- Among key countries, Vietnam at 7.4% CAGR, Bangladesh at 6.1% CAGR, India at 5.8% CAGR, China at 5.6% CAGR.
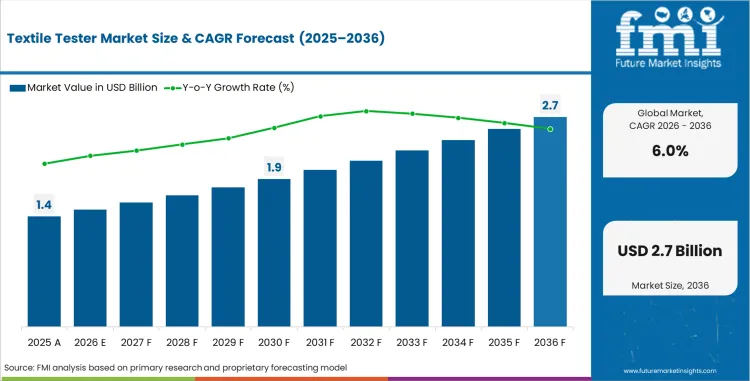
Textile Tester Market Key Takeaways
| Metric | Details |
|---|---|
| Industry Size (2026) | USD 1.48 billion |
| Industry Value (2036) | USD 2.66 billion |
| CAGR (2026 to 2036) | 6.00% |
Source: Future Market Insights, 2026
Growth is sustained by expanding quality compliance requirements from global apparel brands, retailers, and regulatory bodies. Fabric testing instruments account for the largest application share, driven by increasing demand for tensile strength, colorfastness, and flammability verification. The shift of garment manufacturing capacity to Vietnam, Bangladesh, and India is creating new demand for testing infrastructure in regions with rapidly expanding textile export volumes.
Regional demand reflects garment manufacturing concentration and compliance enforcement. Vietnam at 7.4%, Bangladesh at 6.1%, India at 5.8%, China at 5.6%, USA at 4.4%. Vietnam leads through rapid expansion of garment export capacity requiring accredited testing infrastructure. Bangladesh follows as compliance-driven testing mandates from European and North American buyers intensify. India sustains growth through expanding domestic quality certification labs. China maintains demand through its large-scale textile production base. The USA sustains replacement and upgrade demand through established testing laboratory networks.
Textile Tester Market Definition
Textile testers are instruments and systems used to evaluate the physical and chemical properties of fabrics, yarns, apparel, non-wovens, carpets, and technical textiles. Testing functions include tensile testing, abrasion testing, pilling testing, tear resistance, flammability, colorfastness, and water resistance assessment. The market covers manual, motorized, and digital equipment configurations deployed in quality control laboratories, production facilities, and third-party testing agencies.
Textile Tester Market Inclusions
Market scope includes manual, motorized, and digital textile testing instruments used for fabric, yarn, apparel, non-woven, carpet, and technical textile testing. Functional coverage includes tensile, abrasion, pilling, tear resistance, flammability, colorfastness, and water resistance testing, with global and regional sizing from 2026 to 2036.
Textile Tester Market Exclusions
The scope excludes general-purpose materials testing machines not configured for textile-specific test protocols, consumer-grade fabric inspection tools, and standalone laboratory management software. Chemical analysis instruments without physical testing capability are also excluded.
Textile Tester Market Research Methodology
- Primary Research: Analysts engaged with procurement specialists, product engineers, and distribution channel managers to map decision criteria and adoption triggers across core verticals.
- Desk Research: Data collection aggregated regulatory filings, standards body publications, trade association reports, and public procurement records across covered geographies.
- Market-Sizing and Forecasting: Baseline values derive from a bottom-up aggregation of product-level shipments and service contracts, applying region-specific adoption curves to project future demand velocity.
- Data Validation and Update Cycle: Projections are tested against publicly reported capital expenditure guidance, trade statistics, and primary interview inputs from active market participants.
Analyzing Textile Tester Market by Top Investment Segments
Tensile Testing Emerges as the Core Functional Segment in Textile Testing Equipment
Segmented tensile testing is projected to lead the global textile testing equipment market, contributing approximately 28% of total revenue in 2025. The segment is expected to grow at a CAGR of 6.3% between 2025 and 2035, marginally exceeding the global market growth rate of 6%. This dominance is driven by the critical role tensile strength plays in determining textile durability, performance, and compliance with international standards.
Manufacturers across apparel, technical textiles, and industrial fabric sectors rely on tensile testing to assess load-bearing capacity, elongation, and seam strength under various conditions. The growing use of advanced and blended fibers-such as aramid, carbon, and recycled synthetics-has made precise mechanical characterization essential.
Automated tensile testing machines integrated with digital force gauges and extensometers are increasingly being deployed in both R&D and quality control labs. Additionally, regulations from organizations such as ISO, ASTM, and AATCC mandate tensile testing as a benchmark for fabric performance certification, reinforcing the segment’s relevance across global supply chains.
Fabric Testing Remains the Leading Application Area Across Sectors
Fabric testing is anticipated to remain the largest application in the textile testing equipment market, accounting for approximately 34% of market share in 2025, with the segment projected to grow at a CAGR of 6.2% through 2035. The increasing focus on textile quality, compliance, and functional performance across fashion, home furnishings, and industrial applications continues to drive segment growth.
Fabric testing encompasses a wide range of parameters, including tensile strength, abrasion resistance, colorfastness, flammability, and dimensional stability. OEMs and testing labs are investing in multifunctional equipment platforms that consolidate multiple tests to increase throughput and reduce operating costs.
Demand is also being reinforced by the global push for sustainability and circular textiles, which requires rigorous validation of recycled and eco-friendly fabrics. Moreover, the rise of smart textiles and technical fabrics in automotive, medical, and defense sectors is expanding the scope of fabric testing to include conductivity, insulation, and moisture management capabilities. As global sourcing standards become more stringent, fabric testing is expected to play a central role in ensuring end-product consistency and market readiness.
Key Industry Highlights
Driving Quality: The Rising Demand for Superior Textiles
Nowadays, people expect so much more from the fabrics used in wearing clothes, upholstery, or car interiors. As this demand for better textiles grew, so requires manufacturers to make their products of higher standards that are durable, comfortable, and perform well.
Textile testers play a crucial role in this process. They help check fabrics for strength, color retention, and resistance to everyday wear and tear. With consumers willing to pay more for premium products, brands are focusing on delivering textiles that last longer and perform better.
It's not only garment textiles that have this demand, but technical textiles meant for healthcare, construction, and even sports also are in demand. The fabrics used in these fields need to fulfill certain performance criteria, and that can be made sure of only through testing. Thus, good textile-testing equipment has now become a worthwhile investment for manufacturers all over the world, so that today's quality-conscious consumers will have their expectations met.
Rapid Growth in the Textile Industry: Driving Demand for Testing Equipment
The textile industry is growing rapidly, especially in emerging economies such as China, India, and Bangladesh. Over 60% of the global textile production comes from the Asia-Pacific region, keeping in mind its large manpower, lower cost of production, and developing infrastructure in the region. This uptick in production has ensured increased demand for high-textile testing equipment and enabled the globalization of the produce to meet international quality standards.
With the rise of global markets raising their bars for better-quality products, manufacturers will have to make sure that their textiles can meet the stringent demands for durability, safety, and sustainability. Testing equipment helps assess some of the most important fabric properties enabling producers to deliver superior products in tensile strength, colorfastness, and moisture resistance.
Developing countries are increasingly investing in textile manufacturing to take advantage of the demand arising in the global market. For example, the Indian textiles and apparel market is expected to grow at a CAGR of 10% to reach USD 350 billion by 2030. To have an edge over their competitors, these manufacturers need reliable testing tools that will help them issue certificates of export quality and international benchmarks, thereby increasing the demand for such equipment.
Technical Textiles: Driving Growth and Demand for Rigorous Testing
Technical textiles find their way into applications including automotive, healthcare, and sports, since advanced properties are combined with specialized uses. These fabrics go beyond traditional textiles in offering functionality such as durability, flexibility, moisture resistance, and thermal insulation. With high-performance materials in demand for various industries, serious testing has become necessary for these textiles to meet rigid quality and performance standards.
The global market for technical textiles, estimated at USD 220 billion for the year 2022, will continue to see stable growth at an annual growth rate of 4-5%. Driven by high demand, as seen in automotive applications, healthcare applications like surgical gowns and wound care, sportswear fabrics allowing moisture transfer, etc., growth is perceived for the segment. As an instance, consumption in the automotive industries alone constitutes about 25% of the total consumption in the technical textile sector.
Because of these increasing demands, manufacturing companies are making investments in the latest testing equipment to ensure strength, safety, and reliability for such textiles. Rigorous testing ensures that the materials can take up stress, meet regulatory standards, and maintain consistency in critical applications, hence finding their places in modern industries.
The Challenge of High Initial Costs for Advanced Testing Equipment
One of the big challenges in the textile tester market is the excessive initial cost of the advanced testing equipment. Advanced machines like these are extremely necessary to ensure that textiles meet quality, durability, and performance standards for the industry, but at the same time, because of the nature of their technology, automation, and precision tools, they too come with a price.
This cost may serve as a significant barrier too small to mid-sized textile manufacturers. Many of the companies operating in developing economies, which dominate textile production, also have very strained budgets. The investment required by up-to-date testing equipment is often in competition with other operational needs, and hence, setting priorities may be hard.
Despite the high prices of the machinery, long-term benefits have accrued from such machinery. It ensures higher efficiency and minimal defective products while adhering to international standards and, thus opening high potential for lucrative global markets. Manufacturers of test equipment, therefore, seek options including modular designs, leasing, and finance packages as the way forward in handling the challenge.
While the high cost of testing equipment poses challenges, its role in ensuring product quality and market competitiveness makes it a worthwhile investment for long-term growth.
2021 to 2025 Global Textile Tester Analysis Compared to Demand Forecast from 2026 to 2036
The textile tester market has grown gradually from 2021 to 2025 due to the increase in demand from the apparel, yarn, chemicals, and recycling sectors. Textile testers have become quite significant in ascertaining that the fabrics and materials set up by these industries are to the highest quality, safety, and performance.
The importance of accurate and reliable testing of textiles has been growing with the expansion of industries. Textile testers help assess the strength, durability, and safety of fabrics to meet the required standards for different applications. Besides this, the demand for eco-friendly and sustainable products is also increasing the requirement for textile testers to assess the use of environmentally friendly materials and processes.
Up to 2026 to 2036, the textile tester market is likely to continue its growth. Advanced testing technologies will be increasingly in demand with new materials, smarter fabrics, and innovative designs being continuously developed. Textile manufacturers will be faced with the challenges of improving the testing methods, keeping environmental standards, and responding to emerging market demands. Innovation and efficiency in testing will remain the competitive levers for companies in the rapidly changing textile industry.
Market Concentration
Tier 1 companies include industry leaders with annual revenues exceeding USD 100 - 200 million. These companies are currently capturing a significant share of 30-40% globally. These frontrunners are characterized by high production capacity and a wide product portfolio.
They are distinguished by extensive expertise in manufacturing and a broad geographical reach, underpinned by a robust consumer base. They provide a wide range of products to meet regulatory standards. Prominent companies within Tier 1 include: Qualitest International Inc., TESTEX Textile Testing Instruments, ELECTROMATIC Equipment Co., AMETEK, and others.
Tier 2 companies encompass mid-sized participants with revenues ranging from USD 50- 100 million, holding a presence in specific regions and exerting significant influence in local economies. These firms are distinguished by their robust presence overseas and in-depth industry expertise.
They possess strong technology capabilities and adhere strictly to regulatory requirements. However, while they may not always possess the latest cutting-edge technologies or maintain an extensive global reach. Noteworthy entities in Tier 2 include Alpha Chemika, Paramount Group, and Universal Textile Industries.
Tier 3 encompasses most of the small-scale enterprises operating within the regional sphere and catering to specialized needs with revenues below USD 20 - 50 million. These businesses are notably focused on meeting local demand and are hence categorized within the Tier 3 segment.
They are small-scale participants with limited geographical presence. In this context, Tier 3 is acknowledged as an informal sector, indicating a segment distinguished by a lack of extensive organization and formal structure in comparison to the structured one. Tier 3 ASIAN TEST EQUIPMENT, X-Power Equipment’s., Abest Tester Group, and others.
Country-wise Insights
The section below covers assessments of textile tester sales across key countries. Countries from East Asia, and Europe, are anticipated to exhibit promising double-digit growth over the forecast period. All the below-listed countries are collectively set to reflect a CAGR of around 6.2% through the forecast period.
.webp "Top Country Growth Comparison Textile Tester Market Cagr (2026 2036)")
| Countries | Value CAGR (2026 to 2036) |
|---|---|
| China | 5.6% |
| Bangladesh | 6.1% |
| India | 5.8% |
| USA | 4.4% |
| Vietnam | 7.4% |
China: Leading the Textile and Testing Equipment Market
China is the world's largest producer of textiles, contributing more than 50% to the world's total production. The decades of investment in manufacturing infrastructure, an enormous workforce, and technological upgrades have been able to allow this. The industry started to expand very fast in the late 20th century, positioning China as the leader in the world for both the production and exportation of fabrics.
Competitiveness has also made China become the world's largest manufacturer of textile testing equipment. In the early 2000s, Chinese firms began embracing the imperative of quality assurance with a view to meeting the demands in international markets. Advanced capability and cost efficiency are some of the key reasons the testing equipment of China has its value considered today and is within reach even by manufacturers worldwide.
With the increased demand for high-quality and sustainable textiles globally, China's emphasis on testing equipment means its textiles meet the most stringent global standards. Conclusion: China's leadership in textiles and testing equipment is based on an ability to combine large-scale production with innovative, affordable solutions for quality assurance.
United States: A Leader in Technical Textile Consumption and Quality Standards
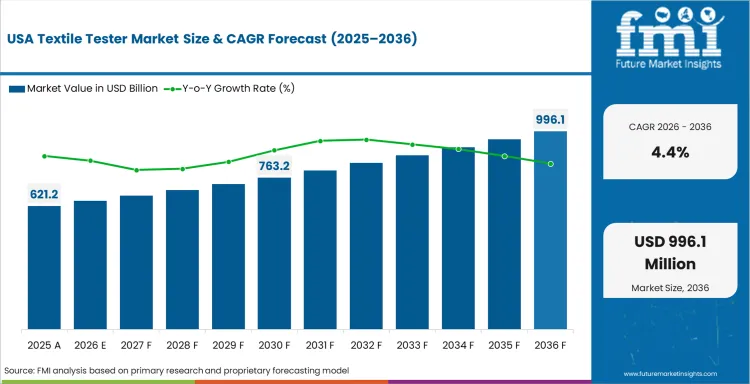
The United States is one of the Significant consumers of textiles, mainly technical textiles used for various industries such as automotive, healthcare, and sports. Technical textiles are engineered for performance and durability, serving critical applications that range from airbags and medical gowns to athletic wear. Only the USA technical textile industry was valued at more than USD 26 billion in 2022 and continues to grow as industries demand innovative, high-performance materials.
Specialized applications mean that the USA has some of the highest standards in the world for safety and quality compliance. These have created a huge demand for sophisticated textile testing equipment. Such equipment is employed by manufacturers in ensuring that their products meet high requirements for strength, fire resistance, and environmental safety. For example, testing ensures that medical textiles stay sterile and perform effectively, while automotive textiles ensure crash safety.
The USA plays a dual role as a leading consumer and quality enforcer for textiles. Its focus on technical textiles and strict compliance ensures the reliability and safety of products used in critical industries.
Bangladesh: A Global Leader in Garment Manufacturing and Testing Excellence
Bangladesh has become a powerhouse in garment manufacturing, only second to China as the biggest exporter of apparel globally. Over 80% of the export earnings that Bangladesh earns are from its ready-made garment sector, owing to the quality and competitive pricing of apparel the country is able to provide. The major export destinations include the European Union, the United States, and Canada-those known to have the strictest quality and safety standards.
These export demands have made Bangladesh highly in need of equipment for textile testing. This equipment provide assurance on various aspects related to colorfastness, durability, and safety that are required as per international standards to retain buyers' confidence in brand reputation. In recent times, large manufacturers have made huge investments in the testing facilities of the country to hold a competitive edge in the market.
The Bangladesh dependence on textile testing equipment shows commitment towards quality and compliance. This focus shall not only consolidate its position as a leader in garment manufacturing but also ensure its long-term sustainability and growth in the global textile industries.
Competitive Landscape
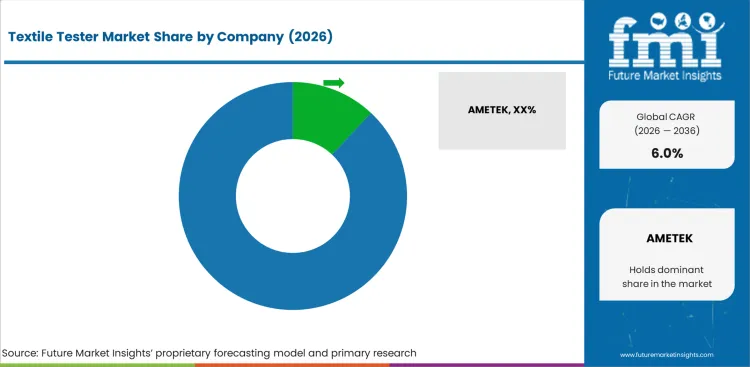
The section provides comprehensive assessments and insights that highlight current opportunities and emerging trends for companies in developed and developing countries. It analyzes advancements in manufacturing and identifies the latest trends poised to drive new applications in the industry.
A few key players in the textile tester industry are actively enhancing capabilities and resources to cater to the growing demand for the compound across diverse applications. Leading companies also leverage partnership and joint venture strategies to co-develop innovative products and bolster resource base.
Significant players are further introducing new products to address the increasing need for cutting-edge solutions in various end-use sectors. Geographic expansion is another important strategy that is being embraced by reputed companies. Start-ups are likely to emerge in the sector through 2036, thereby making it more competitive.
Scope of the Report
| Metric | Value |
|---|---|
| Quantitative Units | USD 1.48 billion to USD 2.66 billion, at a CAGR of 6.00% |
| Market Definition | Textile testers are instruments and systems used to evaluate the physical and chemical properties of fabrics, yarns, apparel, non-wovens, carpets, and technical textiles. Testing functions include tensile testing, abrasion testing, pilling testing, tear resistance, flammability, colorfastness, and water resistance assessment. The market covers manual, motorized, and digital equipment configurations deployed in quality control laboratories, production facilities, and third-party testing agencies. |
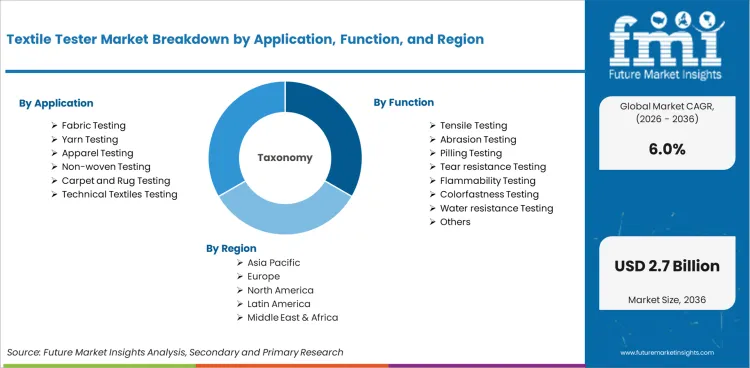
| Application Segmentation | Fabric Testing, Yarn Testing, Apparel Testing, Non-woven Testing, Carpet and Rug Testing, Technical Textiles Testing |
| Function Segmentation | Tensile Testing, Abrasion Testing, Pilling Testing, Tear Resistance Testing, Flammability Testing, Colorfastness Testing, Water Resistance Testing, Others |
| Equipment Type Segmentation | Manual Textile Tester, Motorized Textile Tester, Digital Textile Tester |
| Regions Covered | North America, Latin America, Europe, East Asia, South Asia, Oceania, Middle East & Africa |
| Countries Covered | Vietnam, Bangladesh, India, China, USA, and 40 plus countries |
| Key Companies Profiled | AMETEK, Qualitest International Inc., TESTEX Textile Testing Instruments, ELECTROMATIC Equipment Co., Alpha Chemika, Paramount Group, Universal Textile Industries, ASIAN TEST EQUIPMENT |
| Forecast Period | 2026 to 2036 |
| Approach | Forecasting models apply a bottom-up methodology starting with global installed base metrics and cross-validate projections against primary research and public procurement data. |
Key Segments
By Equipment Type:
In terms of Equipment Type, the industry is divided into Manual Textile Tester, Motorized Textile Tester, Digital Textile Tester
By Function:
In terms of Function, the industry is divided into segmented Tensile Testing, Abrasion Testing, Pilling Testing, Tear resistance Testing, Flammability Testing, Colorfastness Testing, Water resistance Testing, Others
By Application:
In terms of Application, the industry is divided into Yarn Testing, Fabric Testing, Apparel Testing, Non-woven Testing, Carpet and Rug Testing, Technical Textiles Testing
By Region:
Key countries of North America, Latin America, Western Europe, Eastern Europe, East Asia, South Asia, Middle East and Africa (MEA), have been covered in the report.
Bibliography
- 1. International Organization for Standardization. (2024). ISO 13934-1: Textiles, Tensile properties of fabrics. ISO.
- 2. American Association of Textile Chemists and Colorists. (2025). AATCC Test Methods. AATCC.
- 3. European Committee for Standardization. (2024). EN ISO 12945-2: Textiles, Determination of fabric propensity to surface pilling. CEN.
- 4. Bureau of Indian Standards. (2025). IS 1969: Methods of Test for Textile Fabrics. BIS.
- 5. World Trade Organization. (2024). Textile Export Compliance Requirements. WTO.
This bibliography is provided for reader reference. The full Future Market Insights report contains the complete reference list with primary research documentation.
Frequently Asked Questions
How large is the demand for Textile Tester in the global market in 2026?
Demand for Textile Tester in the global market is estimated to be valued at USD 1.48 billion in 2026.
What will be the market size of Textile Tester in the global market by 2036?
Market size for Textile Tester is projected to reach USD 2.66 billion by 2036.
What is the expected demand growth for Textile Tester between 2026 and 2036?
Demand for Textile Tester is expected to grow at a CAGR of 6.00% between 2026 and 2036.
Which Application is poised to lead global sales by 2026?
Fabric Testing accounts for 34.0% in 2026, supported by its established application base across primary end-use categories.
What is driving demand in Vietnam?
Vietnam leads at 7.4% CAGR, driven by expanding domestic capacity and growing adoption across core application segments.
What is the Bangladesh growth outlook in this report?
Bangladesh is projected to grow at a CAGR of 6.1% during 2026 to 2036.
What is included in the scope of this Textile Tester report?
Market scope includes manual, motorized, and digital textile testing instruments used for fabric, yarn, apparel, non-woven, carpet, and technical textile testing. Functional coverage includes tensile, abrasion, pilling, tear resistance, flammability, colorfastness, and water resistance testing, with global and regional sizing from 2026 to 2036.
What is excluded from the scope of this report?
The scope excludes general-purpose materials testing machines not configured for textile-specific test protocols, consumer-grade fabric inspection tools, and standalone laboratory management software. Chemical analysis instruments without physical testing capability are also excluded.
Table of Content
- Executive Summary
- Global Market Outlook
- Demand-side Trends
- Supply-side Trends
- Technology Roadmap Analysis
- Analysis and Recommendations
- Market Overview
- Market Coverage / Taxonomy
- Market Definition / Scope / Limitations
- Research Methodology
- Chapter Orientation
- Analytical Lens and Working Hypotheses
- Market Structure, Signals, and Trend Drivers
- Benchmarking and Cross-market Comparability
- Market Sizing, Forecasting, and Opportunity Mapping
- Research Design and Evidence Framework
- Desk Research Programme (Secondary Evidence)
- Company Annual and Sustainability Reports
- Peer-reviewed Journals and Academic Literature
- Corporate Websites, Product Literature, and Technical Notes
- Earnings Decks and Investor Briefings
- Statutory Filings and Regulatory Disclosures
- Technical White Papers and Standards Notes
- Trade Journals, Industry Magazines, and Analyst Briefs
- Conference Proceedings, Webinars, and Seminar Materials
- Government Statistics Portals and Public Data Releases
- Press Releases and Reputable Media Coverage
- Specialist Newsletters and Curated Briefings
- Sector Databases and Reference Repositories
- FMI Internal Proprietary Databases and Historical Market Datasets
- Subscription Datasets and Paid Sources
- Social Channels, Communities, and Digital Listening Inputs
- Additional Desk Sources
- Expert Input and Fieldwork (Primary Evidence)
- Primary Modes
- Qualitative Interviews and Expert Elicitation
- Quantitative Surveys and Structured Data Capture
- Blended Approach
- Why Primary Evidence is Used
- Field Techniques
- Interviews
- Surveys
- Focus Groups
- Observational and In-context Research
- Social and Community Interactions
- Stakeholder Universe Engaged
- C-suite Leaders
- Board Members
- Presidents and Vice Presidents
- R&D and Innovation Heads
- Technical Specialists
- Domain Subject-matter Experts
- Scientists
- Physicians and Other Healthcare Professionals
- Governance, Ethics, and Data Stewardship
- Research Ethics
- Data Integrity and Handling
- Primary Modes
- Tooling, Models, and Reference Databases
- Desk Research Programme (Secondary Evidence)
- Data Engineering and Model Build
- Data Acquisition and Ingestion
- Cleaning, Normalisation, and Verification
- Synthesis, Triangulation, and Analysis
- Quality Assurance and Audit Trail
- Market Background
- Market Dynamics
- Drivers
- Restraints
- Opportunity
- Trends
- Scenario Forecast
- Demand in Optimistic Scenario
- Demand in Likely Scenario
- Demand in Conservative Scenario
- Opportunity Map Analysis
- Product Life Cycle Analysis
- Supply Chain Analysis
- Investment Feasibility Matrix
- Value Chain Analysis
- PESTLE and Porter’s Analysis
- Regulatory Landscape
- Regional Parent Market Outlook
- Production and Consumption Statistics
- Import and Export Statistics
- Market Dynamics
- Global Market Analysis 2021 to 2025 and Forecast, 2026 to 2036
- Historical Market Size Value (USD Million) Analysis, 2021 to 2025
- Current and Future Market Size Value (USD Million) Projections, 2026 to 2036
- Y-o-Y Growth Trend Analysis
- Absolute $ Opportunity Analysis
- Global Market Pricing Analysis 2021 to 2025 and Forecast 2026 to 2036
- Global Market Analysis 2021 to 2025 and Forecast 2026 to 2036, By Application
- Introduction / Key Findings
- Historical Market Size Value (USD Million) Analysis By Application , 2021 to 2025
- Current and Future Market Size Value (USD Million) Analysis and Forecast By Application , 2026 to 2036
- Fabric Testing
- Yarn Testing
- Apparel Testing
- Non-woven Testing
- Carpet and Rug Testing
- Technical Textiles Testing
- Fabric Testing
- Y-o-Y Growth Trend Analysis By Application , 2021 to 2025
- Absolute $ Opportunity Analysis By Application , 2026 to 2036
- Global Market Analysis 2021 to 2025 and Forecast 2026 to 2036, By Function
- Introduction / Key Findings
- Historical Market Size Value (USD Million) Analysis By Function, 2021 to 2025
- Current and Future Market Size Value (USD Million) Analysis and Forecast By Function, 2026 to 2036
- Tensile Testing
- Abrasion Testing
- Pilling Testing
- Tear resistance Testing
- Flammability Testing
- Colorfastness Testing
- Water resistance Testing
- Others
- Tensile Testing
- Y-o-Y Growth Trend Analysis By Function, 2021 to 2025
- Absolute $ Opportunity Analysis By Function, 2026 to 2036
- Global Market Analysis 2021 to 2025 and Forecast 2026 to 2036, By Equipment Type
- Introduction / Key Findings
- Historical Market Size Value (USD Million) Analysis By Equipment Type, 2021 to 2025
- Current and Future Market Size Value (USD Million) Analysis and Forecast By Equipment Type, 2026 to 2036
- Manual Textile Tester
- Motorized Textile Tester
- Digital Textile Tester
- Manual Textile Tester
- Y-o-Y Growth Trend Analysis By Equipment Type, 2021 to 2025
- Absolute $ Opportunity Analysis By Equipment Type, 2026 to 2036
- Global Market Analysis 2021 to 2025 and Forecast 2026 to 2036, By Region
- Introduction
- Historical Market Size Value (USD Million) Analysis By Region, 2021 to 2025
- Current Market Size Value (USD Million) Analysis and Forecast By Region, 2026 to 2036
- North America
- Latin America
- Western Europe
- Eastern Europe
- East Asia
- South Asia and Pacific
- Middle East & Africa
- Market Attractiveness Analysis By Region
- North America Market Analysis 2021 to 2025 and Forecast 2026 to 2036, By Country
- Historical Market Size Value (USD Million) Trend Analysis By Market Taxonomy, 2021 to 2025
- Market Size Value (USD Million) Forecast By Market Taxonomy, 2026 to 2036
- By Country
- USA
- Canada
- Mexico
- By Application
- By Function
- By Equipment Type
- By Country
- Market Attractiveness Analysis
- By Country
- By Application
- By Function
- By Equipment Type
- Key Takeaways
- Latin America Market Analysis 2021 to 2025 and Forecast 2026 to 2036, By Country
- Historical Market Size Value (USD Million) Trend Analysis By Market Taxonomy, 2021 to 2025
- Market Size Value (USD Million) Forecast By Market Taxonomy, 2026 to 2036
- By Country
- Brazil
- Chile
- Rest of Latin America
- By Application
- By Function
- By Equipment Type
- By Country
- Market Attractiveness Analysis
- By Country
- By Application
- By Function
- By Equipment Type
- Key Takeaways
- Western Europe Market Analysis 2021 to 2025 and Forecast 2026 to 2036, By Country
- Historical Market Size Value (USD Million) Trend Analysis By Market Taxonomy, 2021 to 2025
- Market Size Value (USD Million) Forecast By Market Taxonomy, 2026 to 2036
- By Country
- Germany
- UK
- Italy
- Spain
- France
- Nordic
- BENELUX
- Rest of Western Europe
- By Application
- By Function
- By Equipment Type
- By Country
- Market Attractiveness Analysis
- By Country
- By Application
- By Function
- By Equipment Type
- Key Takeaways
- Eastern Europe Market Analysis 2021 to 2025 and Forecast 2026 to 2036, By Country
- Historical Market Size Value (USD Million) Trend Analysis By Market Taxonomy, 2021 to 2025
- Market Size Value (USD Million) Forecast By Market Taxonomy, 2026 to 2036
- By Country
- Russia
- Poland
- Hungary
- Balkan & Baltic
- Rest of Eastern Europe
- By Application
- By Function
- By Equipment Type
- By Country
- Market Attractiveness Analysis
- By Country
- By Application
- By Function
- By Equipment Type
- Key Takeaways
- East Asia Market Analysis 2021 to 2025 and Forecast 2026 to 2036, By Country
- Historical Market Size Value (USD Million) Trend Analysis By Market Taxonomy, 2021 to 2025
- Market Size Value (USD Million) Forecast By Market Taxonomy, 2026 to 2036
- By Country
- China
- Japan
- South Korea
- By Application
- By Function
- By Equipment Type
- By Country
- Market Attractiveness Analysis
- By Country
- By Application
- By Function
- By Equipment Type
- Key Takeaways
- South Asia and Pacific Market Analysis 2021 to 2025 and Forecast 2026 to 2036, By Country
- Historical Market Size Value (USD Million) Trend Analysis By Market Taxonomy, 2021 to 2025
- Market Size Value (USD Million) Forecast By Market Taxonomy, 2026 to 2036
- By Country
- India
- ASEAN
- Australia & New Zealand
- Rest of South Asia and Pacific
- By Application
- By Function
- By Equipment Type
- By Country
- Market Attractiveness Analysis
- By Country
- By Application
- By Function
- By Equipment Type
- Key Takeaways
- Middle East & Africa Market Analysis 2021 to 2025 and Forecast 2026 to 2036, By Country
- Historical Market Size Value (USD Million) Trend Analysis By Market Taxonomy, 2021 to 2025
- Market Size Value (USD Million) Forecast By Market Taxonomy, 2026 to 2036
- By Country
- Kingdom of Saudi Arabia
- Other GCC Countries
- Turkiye
- South Africa
- Other African Union
- Rest of Middle East & Africa
- By Application
- By Function
- By Equipment Type
- By Country
- Market Attractiveness Analysis
- By Country
- By Application
- By Function
- By Equipment Type
- Key Takeaways
- Key Countries Market Analysis
- USA
- Pricing Analysis
- Market Share Analysis, 2025
- By Application
- By Function
- By Equipment Type
- Canada
- Pricing Analysis
- Market Share Analysis, 2025
- By Application
- By Function
- By Equipment Type
- Mexico
- Pricing Analysis
- Market Share Analysis, 2025
- By Application
- By Function
- By Equipment Type
- Brazil
- Pricing Analysis
- Market Share Analysis, 2025
- By Application
- By Function
- By Equipment Type
- Chile
- Pricing Analysis
- Market Share Analysis, 2025
- By Application
- By Function
- By Equipment Type
- Germany
- Pricing Analysis
- Market Share Analysis, 2025
- By Application
- By Function
- By Equipment Type
- UK
- Pricing Analysis
- Market Share Analysis, 2025
- By Application
- By Function
- By Equipment Type
- Italy
- Pricing Analysis
- Market Share Analysis, 2025
- By Application
- By Function
- By Equipment Type
- Spain
- Pricing Analysis
- Market Share Analysis, 2025
- By Application
- By Function
- By Equipment Type
- France
- Pricing Analysis
- Market Share Analysis, 2025
- By Application
- By Function
- By Equipment Type
- India
- Pricing Analysis
- Market Share Analysis, 2025
- By Application
- By Function
- By Equipment Type
- ASEAN
- Pricing Analysis
- Market Share Analysis, 2025
- By Application
- By Function
- By Equipment Type
- Australia & New Zealand
- Pricing Analysis
- Market Share Analysis, 2025
- By Application
- By Function
- By Equipment Type
- China
- Pricing Analysis
- Market Share Analysis, 2025
- By Application
- By Function
- By Equipment Type
- Japan
- Pricing Analysis
- Market Share Analysis, 2025
- By Application
- By Function
- By Equipment Type
- South Korea
- Pricing Analysis
- Market Share Analysis, 2025
- By Application
- By Function
- By Equipment Type
- Russia
- Pricing Analysis
- Market Share Analysis, 2025
- By Application
- By Function
- By Equipment Type
- Poland
- Pricing Analysis
- Market Share Analysis, 2025
- By Application
- By Function
- By Equipment Type
- Hungary
- Pricing Analysis
- Market Share Analysis, 2025
- By Application
- By Function
- By Equipment Type
- Kingdom of Saudi Arabia
- Pricing Analysis
- Market Share Analysis, 2025
- By Application
- By Function
- By Equipment Type
- Turkiye
- Pricing Analysis
- Market Share Analysis, 2025
- By Application
- By Function
- By Equipment Type
- South Africa
- Pricing Analysis
- Market Share Analysis, 2025
- By Application
- By Function
- By Equipment Type
- USA
- Market Structure Analysis
- Competition Dashboard
- Competition Benchmarking
- Market Share Analysis of Top Players
- By Regional
- By Application
- By Function
- By Equipment Type
- Competition Analysis
- Competition Deep Dive
- AMETEK
- Overview
- Product Portfolio
- Profitability by Market Segments (Product/Age /Sales Channel/Region)
- Sales Footprint
- Strategy Overview
- Marketing Strategy
- Product Strategy
- Channel Strategy
- Qualitest International Inc.
- TESTEX Textile Testing Instruments
- ELECTROMATIC Equipment Co.
- Alpha Chemika
- Paramount Group
- Universal Textile Industries
- ASIAN TEST EQUIPMENT
- X-Power Equipments.
- Abest Tester Group
- AMETEK
- Competition Deep Dive
- Assumptions & Acronyms Used


