This site uses cookies, including third-party cookies, that help us to provide and improve our services.

Privacy Policy
- Global Locations -
Headquarters
Future Market Insights, Inc.
Christiana Corporate, 200 Continental Drive, Suite 401, Newark, Delaware - 19713, United States
T: +1-845-579-5705
MEA
Market Access DMCC

1602-6 Jumeirah Bay X2 Tower, Plot No: JLT-PH2-X2A,

Jumeirah Lakes Towers, Dubai,

United Arab Emirates

Americas
Future Market Insights
616 Corporate Way, Suite 2-9018,
Valley Cottage, NY 10989,
United States
T: +1-347-918-3531
Europe
Future Market Insights
3rd Floor, 207 Regent Street,
London W1B 3HH
United Kingdom
T: + 44 (0) 20 8123 9659
D: +44 (0) 20 3287 4268
APAC
Future Market Insights
Office No. 401-A, 4th Floor,
VANTAGE 9, S.No. 36/1/1,
Baner, Pune 411045 India

Digital Textile Printing Market

Market Insights on Digital Textile Printing covering sales outlook, demand forecast & up-to-date key trends

Digital Textile Printing Market By Printing Process (Direct to Garment, Dye Sublimation, Direct to Fabric), By Ink (Sublimation, Reactive, Acid, Direct Disperse, Pigment), By Substrate (Cotton, Silk, Rayon, Linen, Polyester), By End Use (Clothing, Households, Displays, Technical Textiles) & Region - Forecast 2022 - 2029

Digital Textile Printing Market Outlook (2022-2029)

[194 pages Report] The global digital textile printing market is currently valued at around US$ 2.7 Bn, and is anticipated to progress at a phenomenal CAGR of 16.3% to reach US$ 8 Bn by the end of the year 2029.

Digital Textile Printing Market Size (2022)

US$ 2.7 Bn

Revenue Forecast (2029)

US$ 8 Bn

Global Market Growth Rate (2022-2029)

16.3% CAGR

Dominant Printing Process

Direct to Fabric (DTF): 54% Share

Digital textile printing currently accounts for 14% share of the global digital printing market. Rising popularity of printed cloth, banners, and flags is expected to boost demand for digital textile printing over the coming years.

Customize this Report

Let us know your requirement to get
100% FREE customization

Digital Textile Printing Demand Analysis (2014 to 2021) Vs Market Outlook (2022 to 2029)

The digital textile printing market expanded at a CAGR of 15.1% from 2014 to 2021.

The textile Digital printing market is entering a boom phase. This is because of a significant increase in the demand for silk and polyester apparel with bespoke printing designs. This has opened up enormous prospects for digital textile printing providers, and while digital technologies are pioneering new types of applications, some old textile applications are anticipated to migrate to digital forms.

In packaging, digital textile printing technology is used for identification, labelling, grading, and branding, as well as in a variety of packaging solutions. The face of the textile printing industry is changing as digital textile printing equipment and technologies improve and expand.

Growing demand for printed textiles and digital printing on fabric materials has prompted many producers to move to digital printing technology for faster and better fabric printing, boosting market growth worldwide.

Digital printing on fabric is a novel and revolutionary technology that involves using a large scale digital printing machine, also known as an ink-jet printer, to print a design, pattern, or image directly from a computer onto the chosen surface.

Digital textile printing on cotton fabric is widely preferred; most digital fabric printers employ reactive inks to provide the best possible quality, as this type of ink has the best wash fastness for printing on cotton.

Digital textile printing on linen fabric is mostly preferred for home décor projects. Linen printing can be utilised to create beautiful linen cushions, linen curtains, linen lamps, and other home furnishings.

Digital Textile Printing Market Download Report Brochure

In recent years, digital textile printing on silk fabric is trending due to factors such as appearance, quality, and cost effectiveness. Various digital textile printing systems are used for printing purposes.

Customers are drawn to these items due to the development of compact, faster, and lighter digital fabric printers. The general public's awareness of current clothing and apparel fashion, as well as growing use of digital printing in sportswear, is likely to open up new growth opportunities for market stakeholders.

Digital textile printing system demand is predicted to surge at a CAGR of 16.3% from 2022 to 2029, with the global market expected to close in on a valuation of US$ 8 Bn by 2029.

Digital Textile Printing Trends and Market Opportunities

“Technological Advancements in Developing High-end Digital Textile Printers”

To diversify their product portfolio in the worldwide market, digital textile printing companies are attempting to advance on technological fronts and are investing extensively in research & development operations.

Digital textile printer manufacturing companies are generally focused on generating technologically superior items and gaining a market competitive advantage. These businesses are attempting to diversify their technologies and develop products that can be used in a variety of applications.

Newly developed digital textile printing systems can print with eco-solvent, UV, solvent, and aqueous inks, reducing the impact of printing processes on the environment.

Furthermore, with increased expenditure on the integration of digital textile printers, latest software and programmes offer the benefit of developing innovative designs and a wide range of colour combinations, as well as increased sharpness and vibrant coloured textures.

Ismail Sutaria
Ismail Sutaria
Principal Consultant
LinkedIn
Talk to Analyst

Find your sweet spots for generating winning opportunities in this market.

Talk to Analyst

Market Restraints

“High Cost of Digital Textile Printing Machines”

The cost of digital textile printing machines is higher than conventional textile printing machines. When the entire cost of ownership (water, energy, operators, service expenses, ink, fabric post-treatment, etc.) of conventional and digital textile printing is compared, digital textile printing of one metre of fabric is roughly 1.5X more expensive as traditional printing.

Single-pass printing is a modern printing process that allows for faster, higher-quality printing. Because more print heads are required to cover the entire width of the printer, it is more expensive than multi-pass printing.

Additionally, trained and professional workers are required to operate digital printing equipment properly in order to get the desired outcomes using digital printing technology.

Most digital textile printer manufacturers, however, try to deliver digital ink and pigments at a significantly lower price in order to drive sales. Efforts to enhance the availability of low-cost pigments and printer inks may help mitigate the global market's stifling influence.

Which Regional Markets are Set to Be Lucrative for Digital Textile Printer Manufacturers?

“Rise in Digital Fabric Printing Services Fuelling Market Growth in Asia Pacific”

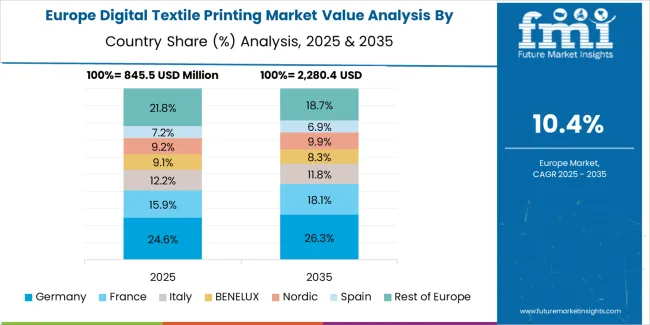
North America continues to offer value-creation possibilities, accounting for roughly one-third of total revenue growth. In this developed region, the presence of digital natives and prominent players is moving the digital textile printing market forward. Towards the end of the projection period, Europe will join the billion-dollar club.

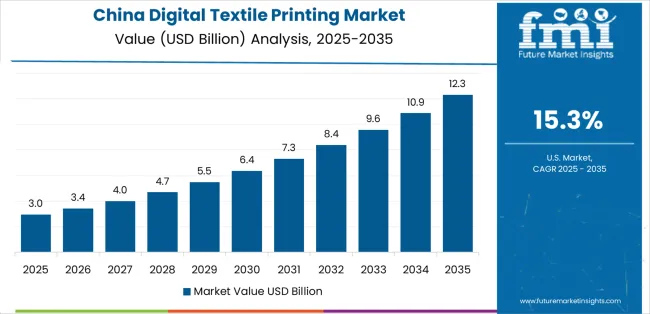
During the projected period, Asia Pacific is expected to make significant advancements in the worldwide digital textile printing market. The markets of India and China are driving the market forward substantially. These two countries have developed textile manufacturing centres and import textiles from all over the world. Large amounts of digital fabric printing services are been provided by these countries.

Integration of technology-based digital textile printing machines is expected to be driven by growing demand for printed fabrics and textiles, as well as strong rivalry among digital textile printer manufacturers. In the global market, subtle integration of new and old technology will gain a lot of traction.

Majority of digital textile printer suppliers are aiming to expand printer makers' supply chains and boost direct consumer reach in underserved regions with high market growth potential.

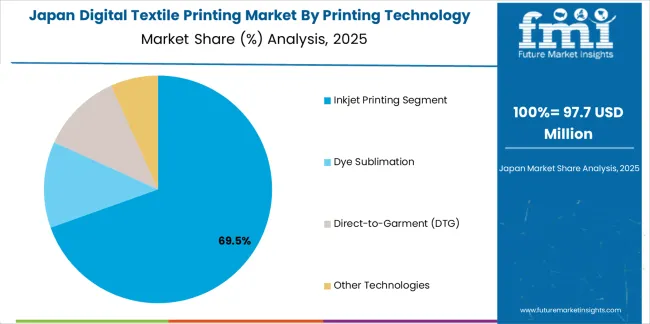
Furthermore, because of their ability to make this equipment, China and Japan have become huge manufacturing centres for digital services and have a vast export market for digital textile printing products and services, making the Asian region the most lucrative as compared to the others.

MarketNage
Become a MarketNgage Insider

A unified Market Research Subscription Platform, built for today's disparate research needs.

Country-wise Analysis

What is Supporting Digital Textile Printing Market Growth in India?

“India to Witness Significant Growth Due to Increase in Digital Textile Printer Manufacturers”

Promising performance of the textile sector in the region, as well as developed textile mill clusters, would create high market growth potential across Asia Pacific, particularly in India.

According to FMI research, roughly, 384 Mn metres of fabric are printed digitally in India's market, accounting for only 1% of overall textile printing.

According to industry estimates, India has over 1,000 digital fabric printing services. Over the course of the forecasted time, the number is predicted to rise significantly. Rising use of dye-sublimation digital printing on polyester fabric and the integration of these printing techniques to achieve a printing speed of 15,000 to 20,000 sq/m are expected to fuel market expansion in India over the coming years.

Additionally, factors such as low cost, long lasting, and printing speed, among others are further anticipated to boost market growth over the decade.

How is China Contributing towards the Growth of Digital Textile Printing Market?

“Advancements in Digital Textile Printing Technology Driving Sales of Digital Textile Printing Equipment”

Many people nowadays have a more positive attitude towards technical breakthroughs as a result of the introduction of super technologies such as the world's fastest trains, 5G, and aeronautical technologies. Despite the fact that China produces a large number of low-cost, low-quality goods, China-made goods are becoming associated with efficient manufacturing, excellent quality, and dependability.

Driven by the need for unlimited colour combinations and accuracy of colour, most digital textile printing companies in China have started to develop advanced digital textile printing equipment with the help of innovative digital textile printing technology.

Because digital textile printing equipment and the ink used in them are more expensive than traditional printers, the initial cost of installation for digital textile printing equipment is significant. The stamp printing method is still used in some nations.

Furthermore, Chinese digital textile printer suppliers are concentrating on textile digital printers for specific applications. Chinese OEMs will develop and play an increasingly important role, not only in the domestic market, but also in the global market, as more Chinese digital textile printing companies are entering the printer market.

Category-wise Analysis

Which Digital Printing Process is Driving High Market Growth?

“Direct to Fabric (DTF) Printing Process Most Preferred for Digital Printing on Fabric

In the global digital textile printing market, the direct to fabric (DTF) printing process is seeing unprecedented demand, with DTF estimated to account for 54% market share throughout the forecast period.

When it comes to non-polyester fibres such as silk, cotton, and nylon, direct to fabric (DTF) printing is ideal. This direct process technique is also used in polyester applications that require deep ink penetration, such as printing on flags.

Direct to garment printing is an obvious choice for digital fabric printing service providers since demand is strong due to emerging fashion trends, and margins are high in categories such as garment decorating and customisation, which will drive demand for direct to garment printing. DTG is estimated to account for 33.9% market share over the forecast period.

Dye sublimation printing is a popular method of printing on compatible materials because it produces high-quality photographic results, and encompasses 12.1% of market share.

Use of sublimation printing in many industries across the world to produce highly durable, beautiful, and distinct prints on a variety of products such as mugs, fashion wear, sportswear, technical textiles, ceramic tiles, and other items is boosting global market expansion.

COVID-19 Impact on Market

COVID-19 had a wide range of implications and its effects were felt in a variety of industries and businesses around the world. The COVID-19 pandemic wreaked havoc on the textile industry as well.

Short- and long-distance movement limitations around the world had a significant impact on this labour-intensive and globally-integrated business. The worldwide health crisis and related government responses resulted in a reduction in production and significant disruption in textile supply chains at the start of 2020, causing cross-regional spillovers.

Furthermore, because China is a major hub for textile manufacturers and a major global supplier of textile inputs, when trade disruptions occurred, the effects on manufacturing spread throughout the global market, including Europe.

In China, the digital textile printing market caters mostly to international brands from Europe and the United States. Due to a drop in demand during the pandemic, most brands' orders were cancelled.

However, the market has regained lost ground and is back to its desired growth trajectory with the world returning to a new normal.

Competitive Landscape

With positive development prospects in the global digital textile printing industry, market participants are attempting to strengthen their supply chain operations and distribution channels.

  • Firms are forming joint ventures and attempting to acquire regional market participants in order to lessen market competition and establish significant sales footprints across regions.
  • Majority of key firms are also attempting to broaden their product portfolios by creating fresh and revolutionary digital textile printing technologies.
  • Market players are also involved in the development of customer-specific digital textile printing equipment and the introduction of new products to ensure that the fast-growing field of textile decoration is well-served.

Important Developments

  • Amazon Inc, a worldwide company, teamed up with digital textile printer producer Kornit in September 2020. The collaboration is part of a Print on Demand Services joint venture between the two companies. Amazon would spend US$ 400 Mn in Kornit digital's products and services as part of the partnership.
  • Fujifilm Holdings Corporation, in partnership with its partner Insight Print Communication Pvt. Ltd., revealed the first Revoria Press PC 1120 Production printer in India in December 2021.

Digital Textile Printing Industry Report Scope

Attribute

Details

Forecast Period

2022-2029

Historical Data Available for

2014-2021

Market Analysis

US$ Bn for Value

Key Regions Covered

  • North America
  • Latin America
  • Europe
  • East Asia
  • South Asia & Pacific
  • Middle East & Africa (MEA)

Key Countries Covered

  • United States
  • Canada
  • Brazil
  • Mexico
  • Germany
  • U.K.
  • France
  • Spain
  • Italy
  • China
  • Japan
  • South Korea
  • India
  • Indonesia
  • Malaysia
  • Singapore
  • Australia
  • New Zealand
  • Turkey
  • South Africa
  • and GCC Countries

Key Market Segments Covered

  • Printing Process
  • Ink
  • Substrate
  • End Use
  • Region

Key Companies Profiled

  • Durst Group (Durst Phototechnik Ag)
  • Electronics For Imaging Inc.
  • Konica Minolta Inc.
  • Kornit Digital Ltd.
  • Mimaki Engineering Co. Ltd.
  • Roq International
  • Sawgrass Technologies Inc.
  • Seiko Epson Corporation
  • Spgprints B. V.
  • The M&R Companies

Pricing

Available upon Request

Key Segments of Digital Textile Printing Industry Survey

Digital Textile Printing Market by Printing Process:

  • Direct to Garment (DTG) Digital Textile Printing
  • Dye Sublimation Digital Textile Printing
  • Direct to Fabric (DTF) Digital Textile Printing

Digital Textile Printing Market by Ink:

  • Sublimation
  • Reactive
  • Acid
  • Direct Disperse
  • Pigment

Digital Textile Printing Market by Substrate:

  • Digital Cotton Printing
  • Digital Silk Printing
  • Digital Rayon Printing
  • Digital Linen Printing
  • Digital Polyester Printing
  • Others

Digital Textile Printing Market by End Use:

  • Clothing
  • Households
  • Displays
  • Technical Textiles

Digital Textile Printing Market by Region:

  • North America Digital Textile Printing Market
  • Latin America Digital Textile Printing Market
  • Europe Digital Textile Printing Market
  • East Asia Digital Textile Printing Market
  • South Asia & Pacific Digital Textile Printing Market
  • Middle East & Africa (MEA) Digital Textile Printing Market

Frequently Asked Questions

The global digital textile printing market is estimated to surge at a CAGR of 16.3% through 2029.

The global market for digital textile printing is currently valued at around US$ 2.7 Bn, and is predicted to surge to US$ 8 Bn by 2029.

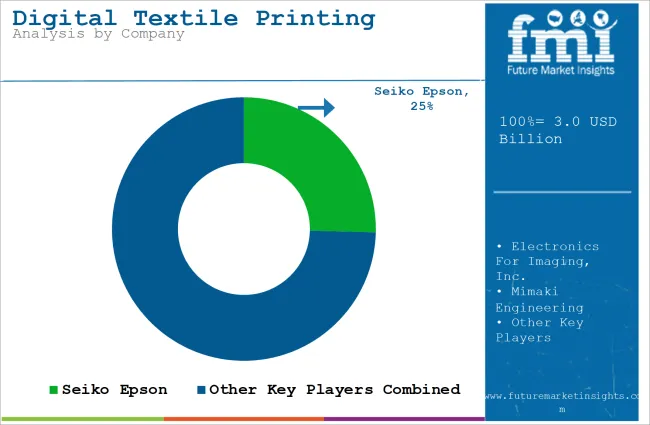
Key digital textile printer suppliers & manufacturers include Durst Group (Durst Phototechnik Ag), Electronics For Imaging Inc., Konica Minolta Inc., Kornit Digital Ltd., Mimaki Engineering Co. Ltd., Roq International, Sawgrass Technologies Inc., Seiko Epson Corporation, Spgprints B. V., and The M&R Companies.

Direct to fabric (DTF) digital textile printing is the most preferred process.

During the projected period, market growth is expected to be driven by rising per capita disposable income in emerging countries as well as rapid changes in fashion trends with new printed clothes.

Table of Content

1. Executive Summary

     1.1. Global Market Outlook

     1.2. Demand Side Trends

     1.3. Supply Side Trends

     1.4. Analysis and Recommendations

2. Market Overview

     2.1. Market Taxonomy

     2.2. Market Definition

     2.3. Market Size for Chemicals by Region

          2.3.1. North America

          2.3.2. Latin America

          2.3.3. Europe

          2.3.4. Middle East and Africa (MEA)

          2.3.5. East Asia

          2.3.6. South Asia

          2.3.7. Oceania

3. Key Market Trends

     3.1. Key Trends Impacting the Market

     3.2. Product Innovation

4. Key Success Factors

     4.1. Product Adoption

     4.2. Product USPs

5. Global Market Demand Analysis 2014-2021 and Forecast, 2022-2029

     5.1. Historical Market Volume (Mn Square ft) Analysis, 2014-2021

     5.2. Current and Future Market Volume (Mn Square ft) Projections, 2022-2029

     5.3. Y-o-Y Growth Trend Analysis

6. Global Market - Pricing Analysis

     6.1. Regional Pricing Analysis By Printing Process

     6.2. Pricing Break-up

          6.2.1. Manufacturer Level Pricing

          6.2.2. Distributor Level Pricing

     6.3. Global Average Pricing Analysis Benchmark

7. Global Market Demand (in Value or Size in US$ Mn) Analysis 2014-2021 and Forecast, 2022-2029

     7.1. Historical Market Value (US$ Mn) Analysis, 2014-2021

     7.2. Current and Future Market Value (US$ Mn) Projections, 2022-2029

          7.2.1. Y-o-Y Growth Trend Analysis

          7.2.2. Absolute $ Opportunity Analysis

8. Market Background

     8.1. Macro-Economic Factors

          8.1.1. Global GDP Growth Outlook

          8.1.2. Manufacturing Value Added Growth (MVA)

          8.1.3. Global Printing Machines Market Growth

          8.1.4. Retail Industry Growth

     8.2. Forecast Factors - Relevance & Impact

          8.2.1. Top Companies Historical Growth

          8.2.2. Printing Industry Growth

          8.2.3. Textile Industry Growth

          8.2.4. Consumer Goods Market Growth Outlook

          8.2.5. Segmental revenue Growth, by each key player

          8.2.6. Country-wise per capita expenditure on textile services

          8.2.7. Packaging Market growth, by region

          8.2.8. Export & Import Growth, by country

          8.2.9. Microeconomic and Macroeconomic Outlook of the Economies by Region/Country

          8.2.10. Production growth of market  

     8.3. Value Chain

          8.3.1. Key Participants

                8.3.1.1. Raw Material  Suppliers

                8.3.1.2. Machine Manufacturers

                8.3.1.3. Business Providers

                8.3.1.4. Brand Owners

          8.3.2. Profitability Margin

     8.4. Market Dynamics

         8.4.1. Drivers

         8.4.2. Restraints

         8.4.3. Opportunity

9. Global Market Analysis 2014-2021 and Forecast 2022-2029, by Printing Process

     9.1. Introduction / Key Findings

     9.2. Historical Market Size (US$ Mn) and Volume (Mn Square ft)  Analysis By Printing Process, 2014 - 2021

     9.3. Current and Future Market Size (US$ Mn) and Volume (Mn Square ft) Analysis and Forecast By Printing Process, 2022 - 2029

          9.3.1. Direct to Garment (DTG)

          9.3.2. Dye-Sublimation

          9.3.3. Direct to Fabric (DTF)

     9.4. Market Attractiveness Analysis By Printing Process

10. Global Market Analysis 2014-2021 and Forecast 2022-2029, by Ink

     10.1. Introduction

     10.2. Historical Market Size (US$ Mn) and Volume Analysis By Ink, 2014 - 2021

     10.3. Current and Future Market Size (US$ Mn) and Volume (Mn Square ft) Analysis and Forecast By Ink, 2022 - 2029

          10.3.1. Sublimation

          10.3.2. Reactive

          10.3.3. Acid

          10.3.4. Direct Dispense

          10.3.5. Pigment

     10.4. Market Attractiveness Analysis By Ink

11. Global Market Analysis 2014-2021 and Forecast 2022-2029, by Substrate

     11.1. Introduction / Key Findings

     11.2. Historical Market Size (US$ Mn) and Volume (Mn Square ft) Analysis By Substrate, 2014 - 2021

     11.3. Current and Future Market Size (US$ Mn) and Volume (Mn Square ft) Analysis and Forecast By Substrate, 2022 - 2029

          11.3.1. Cotton

          11.3.2. Silk

          11.3.3. Rayon

          11.3.4. Linen

          11.3.5. Polyester

          11.3.6. Others (Wool, etc.)

     11.4. Market Attractiveness Analysis By Substrate

12. Global Market Analysis 2014-2021 and Forecast 2022-2029, by End Use

     12.1. Introduction / Key Findings

     12.2. Historical Market Size (US$ Mn) and Volume (Mn Square ft) Analysis By End Use, 2014 - 2021

     12.3. Current and Future Market Size (US$ Mn) and Volume (Mn Square ft) Analysis and Forecast By End Use, 2022 - 2029

          12.3.1. Clothing

          12.3.2. Technical Textiles

          12.3.3. Carpets & Curtains

          12.3.4. Flags & Banners

          12.3.5. Other Household

     12.4. Market Attractiveness Analysis By End Use

13. Global Market Analysis 2014-2021 and Forecast 2022-2029, by Region

     13.1. Introduction

     13.2. Historical Market Size (US$ Mn) and Volume (Mn Square ft) Analysis By Region, 2014 - 2021

     13.3. Current Market Size (US$ Mn) and Volume (Mn Square ft) Analysis and Forecast By Region, 2022 - 2029

          13.3.1. North America

          13.3.2. Latin America

          13.3.3. Europe

          13.3.4. Middle East and Africa (MEA)

          13.3.5. East Asia

          13.3.6. South Asia

          13.3.7. Oceania

     13.4. Market Attractiveness Analysis By Region

14. North America Market Analysis 2014-2021 and Forecast 2022-2029

     14.1. Introduction

     14.2. Pricing Analysis

     14.3. Historical Market Size (US$ Mn) and Volume (Mn Square ft) Trend Analysis By Market Taxonomy, 2014 - 2021

     14.4. Market Size (US$ Mn) and Volume Forecast By Market Taxonomy, 2022 - 2029

          14.4.1. By Country

                14.4.1.1. U.S.

                14.4.1.2. Canada

          14.4.2. By Printing Process

          14.4.3. By Ink

          14.4.4. By Substrate

          14.4.5. By End Use

     14.5. Market Attractiveness Analysis

          14.5.1. By Country

          14.5.2. By Printing Process

          14.5.3. By Ink

          14.5.4. By Substrate

          14.5.5. By End Use

     14.6. Market Trends

     14.7. Key Market Participants - Intensity Mapping

     14.8. Drivers and Restraints - Impact Analysis

15. Latin America Market Analysis 2014-2021 and Forecast 2022-2029

     15.1. Introduction

     15.2. Pricing Analysis

     15.3. Historical Market Size (US$ Mn) and Volume (Mn Square ft) Trend Analysis By Market Taxonomy, 2014 - 2021

     15.4. Market Size (US$ Mn) and Volume Forecast By Market Taxonomy, 2022 - 2029

          15.4.1. By Country

                15.4.1.1. Brazil

                15.4.1.2. Mexico

                15.4.1.3. Rest of Latin America

          15.4.2. By Printing Process

          15.4.3. By Ink

          15.4.4. By Substrate

          15.4.5. By End Use

     15.5. Market Attractiveness Analysis

          15.5.1. By Country

          15.5.2. By Printing Process

          15.5.3. By Ink

          15.5.4. By Substrate

          15.5.5. By End Use

     15.6. Market Trends

     15.7. Key Market Participants - Intensity Mapping

     15.8. Drivers and Restraints - Impact Analysis

16.  Europe Market Analysis 2014-2021 and Forecast 2022-2029

     16.1. Introduction

     16.2. Pricing Analysis

     16.3. Historical Market Size (US$ Mn) and Volume (Mn Square ft) Trend Analysis By Market Taxonomy, 2014 - 2021

     16.4. Market Size (US$ Mn) and Volume Forecast By Market Taxonomy, 2022 - 2029

          16.4.1. By Country

                16.4.1.1. Germany

                16.4.1.2. Italy

                16.4.1.3. France

                16.4.1.4. U.K.

                16.4.1.5. Spain

                16.4.1.6. BENELUX

                16.4.1.7. Russia

                16.4.1.8. Rest of Europe

          16.4.2. By Printing Process

          16.4.3. By Ink

          16.4.4. By Substrate

          16.4.5. By End Use

     16.5.Market Attractiveness Analysis

          16.5.1. By Country

          16.5.2. By Printing Process

          16.5.3. By Ink

          16.5.4. By Substrate

          16.5.5. By End Use

     16.6. Market Trends

     16.7. Key Market Participants - Intensity Mapping

     16.8. Drivers and Restraints - Impact Analysis

17.  South Asia Market Analysis 2014-2021 and Forecast 2022-2029

     17.1.Introduction

     17.2.Pricing Analysis

     17.3.Historical Market Size (US$ Mn) and Volume (Mn Square ft) Trend Analysis By Market Taxonomy, 2014 - 2021

     17.4.Market Size (US$ Mn) and Volume Forecast By Market Taxonomy, 2022 - 2029

          17.4.1. By Country

                17.4.1.1. India

                17.4.1.2. Thailand

                17.4.1.3. Indonesia

                17.4.1.4. Malaysia

                17.4.1.5. Rest of South Asia

          17.4.2. By Printing Process

          17.4.3. By Ink

          17.4.4. By Substrate

          17.4.5. By End Use

     17.5. Market Attractiveness Analysis

          17.5.1. By Country

          17.5.2. By Printing Process

          17.5.3. By Ink

          17.5.4. By Substrate

          17.5.5. By End Use

     17.6. Market Trends

     17.7. Key Market Participants - Intensity Mapping

     17.8. Drivers and Restraints - Impact Analysis

18. East Asia Market Analysis 2014-2021 and Forecast 2022-2029

     18.1. Introduction

     18.2. Pricing Analysis

     18.3. Historical Market Size (US$ Mn) and Volume Trend Analysis By Market Taxonomy, 2014 - 2021

     18.4. Market Size (US$ Mn) and Volume (Mn Square ft) Forecast By Market Taxonomy, 2022 - 2029

          18.4.1. By Country

                18.4.1.1. China

                18.4.1.2. Japan

                18.4.1.3. South Korea

          18.4.2. By Printing Process

          18.4.3. By Ink

          18.4.4. By Substrate

          18.4.5. By End Use

     18.5. Market Attractiveness Analysis

          18.5.1. By Country

          18.5.2. By Printing Process

          18.5.3. By Ink

          18.5.4. By Substrate

          18.5.5. By End Use

     18.6. Market Trends

     18.7. Key Market Participants - Intensity Mapping

     18.8. Drivers and Restraints - Impact Analysis

19. Oceania Market Analysis 2014-2021 and Forecast 2022-2029

     19.1. Introduction

     19.2. Pricing Analysis

     19.3. Historical Market Size (US$ Mn) and Volume Trend Analysis By Market Taxonomy, 2014 - 2021

     19.4. Market Size (US$ Mn) and Volume (Mn Square ft) Forecast By Market Taxonomy, 2022 - 2029

          19.4.1. By Country

                19.4.1.1. Australia

                19.4.1.2. New Zealand

          19.4.2. By Printing Process

          19.4.3. By Ink

          19.4.4. By Substrate

          19.4.5. By End Use

     19.5. Market Attractiveness Analysis

          19.5.1. By Country

          19.5.2. By Printing Process

          19.5.3. By Ink

          19.5.4. By Substrate

          19.5.5. By End Use

     19.6. Market Trends

     19.7. Key Market Participants - Intensity Mapping

     19.8. Drivers and Restraints - Impact Analysis

20. Middle East and Africa Market Analysis 2014-2021 and Forecast 2022-2029

     20.1. Introduction

     20.2. Pricing Analysis

     20.3. Historical Market Size (US$ Mn) and Volume (Mn Square ft) Trend Analysis By Market Taxonomy, 2014 - 2021

     20.4. Market Size (US$ Mn) and Volume (Mn Square ft) Forecast By Market Taxonomy, 2022 - 2029

          20.4.1. By Country

                20.4.1.1. GCC Countries

                20.4.1.2. Turkey

                20.4.1.3. Northern Africa

                20.4.1.4. South Africa

                20.4.1.5. Rest of Middle East and Africa

          20.4.2. By Printing Process

          20.4.3. By Ink

          20.4.4. By Substrate

          20.4.5. By End Use

     20.5. Market Attractiveness Analysis

          20.5.1. By Country

          20.5.2. By Printing Process

          20.5.3. By Ink

          20.5.4. By Substrate

          20.5.5. By End Use

     20.6. Market Trends

     20.7. Key Market Participants - Intensity Mapping

     20.8. Drivers and Restraints - Impact Analysis

21. Emerging Countries Market Analysis 2014-2021 and Forecast 2022-2029

     21.1. Introduction

          21.1.1. Market Value Proportion Analysis, By Key Countries

          21.1.2. Global Vs. Country Growth Comparison

     21.2. China Market Analysis

          21.2.1. Introduction

          21.2.2. Market Volume (Mn Square ft) and Value (US$ Mn) Analysis and Forecast by Market Taxonomy

                21.2.2.1. By Printing Process

                21.2.2.2. By Ink

                21.2.2.3. By Substrate

                21.2.2.4. By End Use

     21.3. India Market Analysis

          21.3.1. Introduction

          21.3.2. Market Volume (Mn Square ft) and Value (US$ Mn) Analysis and Forecast by Market Taxonomy

                21.3.2.1. By Printing Process

                21.3.2.2. By Ink

                21.3.2.3. By Substrate

                21.3.2.4. By End Use

     21.4. Brazil Market Analysis

          21.4.1. Introduction

          21.4.2. Market Volume (Mn Square ft) and Value (US$ Mn) Analysis and Forecast by Market Taxonomy

                21.4.2.1. By Printing Process

                21.4.2.2. By Ink

                21.4.2.3. By Substrate

                21.4.2.4. By End Use

22. Market Structure Analysis

     22.1. Market Analysis by Tier of Companies (Digital Textile Printing)

     22.2. Market Concentration

     22.3. Market Share Analysis of Top Players

     22.4. Market Presence Analysis

          22.4.1. By Regional footprint of Players

          22.4.2. Product foot print by Players

          22.4.3. Channel Foot Print by Players

23. Competition Analysis

     23.1. Competition Dashboard

     23.2. Pricing Analysis by Competition

     23.3. Competition Benchmarking

     23.4. Competition Deep Dive

     23.5. Manufacturers

          23.5.1. Hp Inc.

                23.5.1.1. Overview

                23.5.1.2. Product Portfolio

                23.5.1.3. Profitability by Market Segments (Product/Channel/Region)

                23.5.1.4. Sales Footprint

                23.5.1.5. Strategy Overview

                         23.5.1.5.1. Marketing Strategy

                        23.5.1.5.2. Product Strategy

                        23.5.1.5.3. Channel Strategy

          23.5.2. Seiko Epson Corporation

               23.5.2.1. Overview

               23.5.2.2. Product Portfolio

               23.5.2.3. Profitability by Market Segments (Product/Channel/Region)

               23.5.2.4. Sales Footprint

               23.5.2.5. Strategy Overview

                        23.5.2.5.1.  Marketing Strategy

                       23.5.2.5.2.  Product Strategy

                       23.5.2.5.3.  Channel Strategy

          23.5.3. Ricoh Co Ltd.

              23.5.3.1. Overview

              23.5.3.2. Product Portfolio

              23.5.3.3. Profitability by Market Segments (Product/Channel/Region)

              23.5.3.4. Sales Footprint

              23.5.3.5. Strategy Overview

                       23.5.3.5.1.  Marketing Strategy

                      23.5.3.5.2.  Product Strategy

                      23.5.3.5.3.  Channel Strategy

          23.5.4. Konica Minolta, Inc.

              23.5.4.1. Overview

              23.5.4.2. Product Portfolio

              23.5.4.3. Profitability by Market Segments (Product/Channel/Region)

              23.5.4.4. Sales Footprint

              23.5.4.5. Strategy Overview

                       23.5.4.5.1.  Marketing Strategy

                      23.5.4.5.2.  Product Strategy

                      23.5.4.5.3.  Channel Strategy

          23.5.5. Mimaki Engineering Co., Ltd.

              23.5.5.1. Overview

              23.5.5.2. Product Portfolio

              23.5.5.3. Profitability by Market Segments (Product/Channel/Region)

              23.5.5.4. Sales Footprint

              23.5.5.5. Strategy Overview

                       23.5.5.5.1.  Marketing Strategy

                      23.5.5.5.2.  Product Strategy

                      23.5.5.5.3.  Channel Strategy

          23.5.6. Durst Phototechnik AG

              23.5.6.1. Overview

              23.5.6.2. Product Portfolio

              23.5.6.3. Profitability by Market Segments (Product/Channel/Region)

              23.5.6.4. Sales Footprint

              23.5.6.5. Strategy Overview

                       23.5.6.5.1.  Marketing Strategy

                      23.5.6.5.2.  Product Strategy

                      23.5.6.5.3.  Channel Strategy

          23.5.7. HGS Machines Pvt. Ltd.

              23.5.7.1. Overview

              23.5.7.2. Product Portfolio

              23.5.7.3. Profitability by Market Segments (Product/Channel/Region)

              23.5.7.4. Sales Footprint

              23.5.7.5. Strategy Overview

                       23.5.7.5.1.  Marketing Strategy

                      23.5.7.5.2.  Product Strategy

                      23.5.7.5.3.  Channel Strategy

    23.6. Solution Providers

          23.6.1. Tex India Enterprises Pvt Ltd

              23.6.1.1. Overview

              23.6.1.2. Product Portfolio

              23.6.1.3. Profitability by Market Segments (Product/Channel/Region)

              23.6.1.4. Sales Footprint

              23.6.1.5. Strategy Overview

                       23.6.1.5.1.  Marketing Strategy

                      23.6.1.5.2.  Product Strategy

                      23.6.1.5.3.  Channel Strategy

          23.6.2. Home Decor Studio

              23.6.2.1. Overview

              23.6.2.2. Product Portfolio

              23.6.2.3. Profitability by Market Segments (Product/Channel/Region)

              23.6.2.4. Sales Footprint

              23.6.2.5. Strategy Overview

                       23.6.2.5.1.  Marketing Strategy

                      23.6.2.5.2.  Product Strategy

                      23.6.2.5.3.  Channel Strategy

          23.6.3. Chelsey Chelsey

              23.6.3.1. Overview

              23.6.3.2. Product Portfolio

              23.6.3.3. Profitability by Market Segments (Product/Channel/Region)

              23.6.3.4. Sales Footprint

              23.6.3.5. Strategy Overview

                       23.6.3.5.1. Marketing Strategy

                      23.6.3.5.2. Product Strategy

                      23.6.3.5.3. Channel Strategy

          23.6.4. SMR India Private Limited

              23.6.4.1. Overview

              23.6.4.2. Product Portfolio

              23.6.4.3. Profitability by Market Segments (Product/Channel/Region)

              23.6.4.4. Sales Footprint

              23.6.4.5. Strategy Overview

                       23.6.4.5.1. Marketing Strategy

                      23.6.4.5.2. Product Strategy

                      23.6.4.5.3. Channel Strategy

          23.6.5. DG Prints Fab.

              23.6.5.1. Overview

              23.6.5.2. Product Portfolio

              23.6.5.3. Profitability by Market Segments (Product/Channel/Region)

              23.6.5.4. Sales Footprint

              23.6.5.5. Strategy Overview

                      23.6.5.5.1. Marketing Strategy

                      23.6.5.5.2. Product Strategy

                      23.6.5.5.3. Channel Strategy

          23.6.6. Arunam Digital Prints

              23.6.6.1. Overview

              23.6.6.2. Product Portfolio

              23.6.6.3. Profitability by Market Segments (Product/Channel/Region)

              23.6.6.4. Sales Footprint

              23.6.6.5. Strategy Overview

                      23.6.6.5.1. Marketing Strategy

                      23.6.6.5.2. Product Strategy

                      23.6.6.5.3. Channel Strategy

          23.6.7. Sandaw Digitex.

              23.6.7.1. Overview

              23.6.7.2. Product Portfolio

              23.6.7.3. Profitability by Market Segments (Product/Channel/Region)

              23.6.7.4. Sales Footprint

              23.6.7.5. Strategy Overview

                      23.6.7.5.1. Marketing Strategy

                      23.6.7.5.2. Product Strategy

                      23.6.7.5.3. Channel Strategy

          23.6.8. Aeoon Technologies GmbH

              23.6.8.1. Overview

              23.6.8.2. Product Portfolio

              23.6.8.3. Profitability by Market Segments (Product/Channel/Region)

              23.6.8.4. Sales Footprint

              23.6.8.5. Strategy Overview

                      23.6.8.5.1. Marketing Strategy

                      23.6.8.5.2. Product Strategy

                      23.6.8.5.3. Channel Strategy

24. Assumptions and Acronyms Used

25. Research Methodology
Customize this Report

Let us know your requirement to get
100% FREE customization

List of Tables

Table 01: Global Market Value (US$ Mn) and Volume (Mn Square ft.) Analysis, by Printing Process, 2014H-2029F

Table 02: Global Market Value (US$ Mn) and Volume (Mn Square ft.) Analysis, by Ink, 2014H-2028F

Table 03: Global Market Value (US$ Mn) and Volume (Mn Square ft.) Analysis, by Substrate, 2014H-2028F

Table 04: Global Market Value (US$ Mn) and Volume (Mn Square ft.) Analysis, by End Use, 2014H-2028F

Table 05: Global Market Value (US$ Mn) and Volume (Mn Square ft.) Analysis, by Region, 2014H-2028F

Table 06: North America Market Analysis, in Value (US$ Mn), 2014H-2029F

Table 07: North America Market Analysis, in Value (US$ Mn), 2014H-2029F

Table 08: North America Market Analysis, in Volume (Mn Square ft.), 2014H-2029F

Table 09: North America Market Analysis, in Volume (Mn Square ft.), 2014H-2029F

Table 10: Latin America Market Analysis, in Value (US$ Mn), 2014H-2029F

Table 11: Latin America Market Analysis, in Value (US$ Mn), 2014H-2029F

Table 12: Latin America Market Analysis, in Volume (Mn Square ft.), 2014H-2029F

Table 13: Latin America Market Analysis, in Volume (Mn Square ft.), 2014H-2029F

Table 14: Europe Market Analysis, in Value (US$ Mn), 2014H-2029F

Table 15: Europe Market Analysis, in Value (US$ Mn), 2014H-2029F

Table 16: Europe Market Analysis, in Volume (Mn Square ft.), 2014H-2029F

Table 17: Europe Market Analysis, in Volume (Mn Square ft.), 2014H-2029F

Table 18: South Asia Market Analysis, in Value (US$ Mn), 2014H-2029F

Table 19: South Asia Market Analysis, in Value (US$ Mn), 2014H-2029F

Table 20: South Asia Market Analysis, in Volume (Mn Square ft.), 2014H-2029F

Table 21: South Asia Market Analysis, in Volume (Mn Square ft.), 2014H-2029F

Table 22: East Asia Market Analysis, in Value (US$ Mn), 2014H-2029F

Table 23: East Asia Market Analysis, in Value (US$ Mn), 2014H-2029F

Table 24: East Asia Market Analysis, in Volume (Mn Square ft.), 2014H-2029F

Table 25: East Asia Market Analysis, in Volume (Mn Square ft.), 2014H-2029F

Table 26: Oceania Market Analysis, in Value (US$ Mn), 2014H-2029F

Table 27: Oceania Market Analysis, in Value (US$ Mn), 2014H-2029F

Table 28: Oceania Market Analysis, in Volume (Mn Square ft.), 2014H-2029F

Table 29: Oceania Market Analysis, in Volume (Mn Square ft.), 2014H-2029F

Table 30: MEA Market Analysis, in Value (US$ Mn), 2014H-2029F

Table 31: MEA Market Analysis, in Value (US$ Mn), 2014H-2029F

Table 32: MEA Market Analysis, in Volume (Mn Square ft.), 2014H-2029F

Table 33: MEA Market Analysis, in Volume (Mn Square ft.), 2014H-2029F

Table 34: China Market Analysis, in Value (US$ Mn), 2014H-2029F

Table 35: China Market Analysis, in Value (US$ Mn), 2014H-2029F

Table 36: China Market Analysis, in Volume (Mn Square ft.), 2014H-2029F

Table 37: China Market Analysis, in Volume (Mn Square ft.), 2014H-2029F

Table 38: India Market Analysis, in Value (US$ Mn), 2014H-2029F

Table 39: India Market Analysis, in Value (US$ Mn), 2014H-2029F

Table 40: India Market Analysis, in Volume (Mn Square ft.), 2014H-2029F

Table 41: India Market Analysis, in Volume (Mn Square ft.), 2014H-2029F

Table 42: Brazil Market Analysis, in Value (US$ Mn), 2014H-2029F

Table 43: Brazil Market Analysis, in Value (US$ Mn), 2014H-2029F

Table 44: Brazil Market Analysis, in Volume (Mn Square ft.), 2014H-2029F

Table 45: Brazil Market Analysis, in Volume (Mn Square ft.), 2014H-2029F
Ismail Sutaria
Principal Consultant
LinkedIn
Talk to Analyst

Find your sweet spots for generating winning opportunities in this market.

Talk to Analyst

List of Charts

Figure 01: Global Market Share Analysis by Printing Process, 2014H, 2022E & 2028F

Figure 02: Global Market Attractiveness Analysis by Printing Process, 2022E-2028F

Figure 03: Global Market Share Analysis by Ink, 2014H, 2022E & 2028F

Figure 04: Global Market Attractiveness Analysis by Ink, 2022E-2028F

Figure 05: Global Market Share Analysis by Substrate, 2014H, 2022E & 2028F

Figure 06: Global Market Attractiveness Analysis by Substrate, 2022E-2028F

Figure 07: Global Market Share Analysis by End Use, 2014H, 2022E & 2028F

Figure 08: Global Market Attractiveness Analysis by End Use, 2022E-2028F

Need specific information?

Request Customization

Explore Packaging Insights

View Reports

Recommendations

Packaging

Pad Printing Machine Market

Published : December 2021

Packaging

Digital Textile Printing Market

Published : February 2022

Packaging

Printing Machinery Market

Published : February 2022

Packaging

Digital Printing Packaging Market

Published : July 2021

Google translate

Digital Textile Printing Market