Reports

- Global Locations -

Headquarters

Future Market Insights, Inc.

Christiana Corporate, 200
Continental Drive, Suite 401,
Newark, Delaware - 19713,
United States

T: +1-845-579-5705

Americas

Future Market Insights, Inc.

616 Corporate Way, Suite 2-9018,
Valley Cottage, NY 10989, United States

T: +1-347-918-3531

MEA

Future Market Insights

1602-6 Jumeirah Bay X2 Tower, Plot No: JLT-PH2-X2A,
Jumeirah Lakes Towers, Dubai,
United Arab Emirates

Europe

Future Market Insights

3rd Floor, 207 Regent Street,
W1B 3HH London
United Kingdom

T: + 44 (0) 20 8123 9659
D: +44 (0) 20 3287 4268

Asia Pacific

Future Market Insights

IndiaLand Global Tech Park, Unit UG-1, Behind Grand HighStreet, Phase 1, Hinjawadi, MH, Pune – 411057, India

Digital BBQ Tongs and Thermometer Market Overview (2022 to 2032)

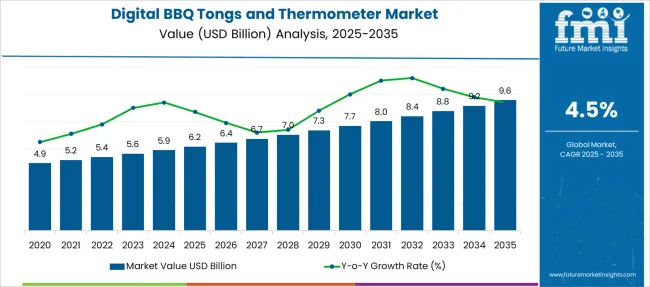
The digital BBQ tongs and thermometer market is expected to register a CAGR of 4.5% during the forecast period, up from US$ 5.4 Billion in 2022 to reach a valuation of US$ 8.54 Billion by 2032.

The digital BBQ tongs and thermometer market is anticipated to show promising growth prospects during the forecast period.

Attributes Details
Digital BBQ Tongs and Thermometer Market Value (2022) US$ 5.4 Billion
Digital BBQ Tongs and Thermometer Market Value (2032) US$ 8.54 Billion
Digital BBQ Tongs and Thermometer Market CAGR (2022 to 2032) 4.5%

Sales of digital BBQ tongs and thermometer is expected to rise due to technological advances in BBQ tongs and thermometers, rising awareness about health, and disposable income.

Sales of digital bbq tongs and thermometers are expected to rise as e-commerce channels expand, and consumers' preferences for online purchasing grow. Increased consumer awareness about health is driving the sales of digital BBQ tongs and thermometers while contributing to the overall digital BBQ tongs and thermometer market share.

The industry is expected to be fueled in the near future due to manufacturers' increased Research and Development investment, which is increasing the demand for digital BBQ tongs and thermometers. Consumer adoption of smart technologies is propelling the global digital BBQ tongs and thermometer market forward.

The global digital BBQ tongs and thermometer market is growing in response to rising concerns about food safety and health.

The demand for digital BBQ tongs and thermometers is being driven by the rising popularity of e-commerce websites and the growing trend of online shopping. Furthermore, rising consumer and chef knowledge of the significance of maintaining a safe cooking temperature is projected to boost the demand for digital BBQ tongs and thermometer, and as a result, the sales of digital BBQ tongs and thermometer is also anticipated to grow.

Don't pay for what you don't need

Customize your report by selecting specific countries or regions and save 30%!

What are the Growth Propellers of the Digital BBQ Tongs and Thermometer Market Share?

With ongoing product innovation and automation, the household appliances business is currently undergoing substantial changes. As a result of this, the demand for digital BBQ tongs and thermometers is growing rapidly. Furthermore, due to the tremendous growth of the electronics industry globally, manufacturers are adding new features to traditional products on the market to boost the sales of digital BBQ tongs and thermometers.

Removable backlit LCD display screen, audio alert whistles, automatic shutoff, tong locks, and other functions are included in the digital BBQ tongs and thermometer market.

The digital BBQ tongs and thermometer include a pair of tongs as well as a digital meat thermometer. To measure the temperature of the meat while flipping and grasping it, digital BBQ tongs and thermometers are increasingly utilized. As a result of this, the demand for digital BBQ tongs and thermometers is rising.

In the near future, the digital BBQ tongs and thermometer market share is likely to be driven by rising customer spending on novel kitchen appliance items.

The global growth of the digital BBQ tongs and thermometer market is being fuelled by increasing brand consistency among end-users. During the forecast period, rising disposable income in countries such as India, Thailand, Argentina, Mexico, and others is likely to boost the sales of digital BBQ tongs and thermometers.

The advantages of digital BBQ tongs and thermometers over conventional ones with little price difference are driving the value growth of the digital BBQ tongs and thermometer market.
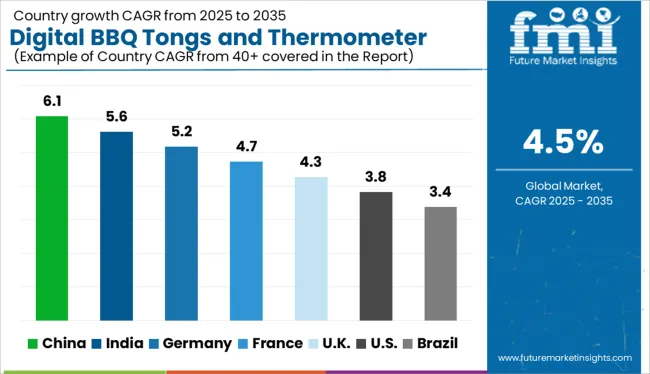
Which is the Leading Region in the Digital BBQ Tongs and Thermometer Market?

Due to increased e-commerce penetration and the rise of the electronics industry, the sales of digital BBQ tongs and thermometer is predicted to grow significantly in emerging countries such as India, Brazil, Mexico, Thailand, and others.

Rising public awareness of modern digital BBQ tongs and thermometers in developing countries is likely to drive market growth in terms of both value and volume throughout the forecast period.

Due to the early growth of the electronics industry and the presence of a significant number of department stores, hypermarkets, supermarkets, and other stores in the region, North America and Europe are expected to hold a significant amount of digital BBQ tongs and thermometer market value share.

Due to rising disposable income in the Asia Pacific region, the market for digital BBQ tongs and thermometers is predicted to rise significantly during the forecast period. Due to the presence of a sophisticated electronics sector and considerable e-commerce penetration, the digital BBQ tongs and thermometer market in Japan and China are likely to hold a significant position in the Asia Pacific market.
Sneha Verghese
Sneha Verghese

Principal Consultant

Talk to Analyst

Find your sweet spots for generating winning opportunities in this market.

Who are the Key Players in the Digital BBQ Tongs and Thermometer Market?

Key players are mostly focused on product innovation and a variety of features in kitchen appliances. In terms of value, this trend is favorably influencing the growth of the digital BBQ tongs and thermometer market. Furthermore, a prominent trend driving the growth of the digital BBQ tongs and thermometer market is the increasing usage of smart and modular kitchens in households.

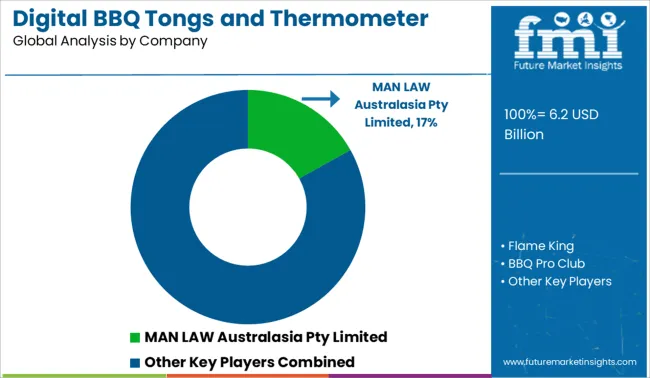
MAN LAW Australasia Pty Limited, Flame King, BBQ Pro Club, Kovot, Space Grill, Sunartis, BBQ Spit Rotisseries, Williams-Sonoma Inc., Thermoworks, and Admetior are some of the key players in the global Digital BBQ Tongs and Thermometer market. During the forecast period, these companies are projected to have a beneficial impact on the growth of the digital BBQ tongs and thermometer market.

Recent Developments:

  • Q1400, a multipurpose product from Weber-Stephen Products LLC, was launched in March 2018. Barbecuing, grilling, baking, convection, and roasting are all possible with this product.
  • TTK Prestige Ltd. released a product featuring non-stick heating plates and temperature control in December 2016. The following are some of the major participants in the electric grill market.

Report Scope

Report Attribute Details
Growth rate CAGR of 4.5% from 2022 to 2032
The base year for estimation 2021
Historical data 2015 to 2020
Forecast period 2022 to 2032
Quantitative units Revenue in USD billion, volume in kilotons, and CAGR from 2022 to 2032
Report Coverage Revenue forecast, volume forecast, company ranking, competitive landscape, growth factors, and trends, Pricing Analysis
Segments Covered Component, Type, Sales channel, Region
Regional scope North America; Western Europe, Eastern Europe, Middle East, Africa, ASEAN, South Asia, Rest of Asia, Australia, and New Zealand
Country scope USA; Canada; Mexico; Germany; United Kingdom; France; Italy; Spain; Russia; Belgium; Poland; Czech Republic; China; India; Japan; Australia; Brazil; Argentina; Colombia; Saudi Arabia; United Arab Emirates(UAE); Iran; South Africa
Key companies profiled MAN LAW Australasia Pty Limited, Flame King, BBQ Pro Club, Kovot, Space Grill, Sunartis, BBQ Spit Rotisseries, Williams-Sonoma Inc., Thermoworks, and Admetior
Customization scope Free report customization (equivalent to up to 8 analysts' working days) with purchase. Addition or alteration to country, regional & segment scope.
Pricing and purchase options Avail customized purchase options to meet your exact research needs.

Get the data you need at a Fraction of the cost

Personalize your report by choosing insights you need
and save 40%!

Key Segments

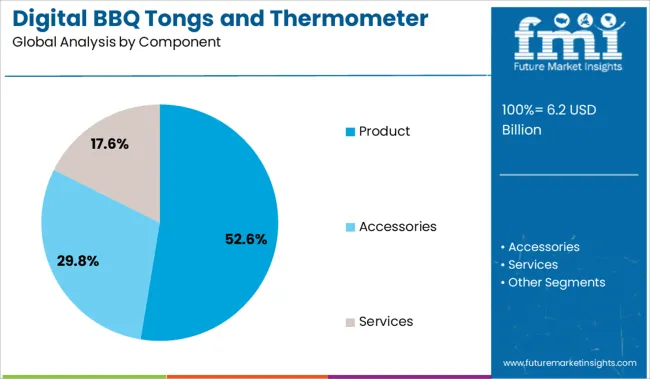
By Component:

  • Product
  • Accessories
  • Services

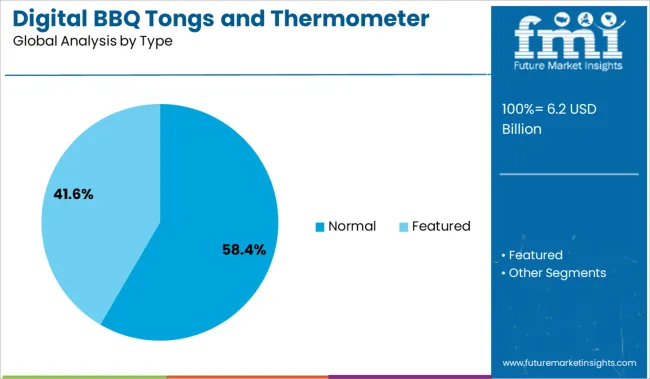
By Type:

  • Normal
  • Featured

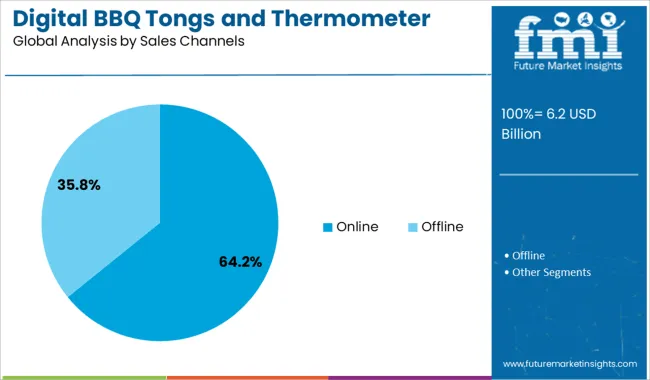
By Sales Channel:

  • Retailer
  • OEM
  • Distributors
  • E-commerce

By Region:

  • North America
  • Latin America
  • Asia Pacific
  • Middle East and Africa
  • Europe

Frequently Asked Questions

What is the Growth Outlook for the Digital BBQ Tongs and Thermometer Market?

The digital BBQ tongs and thermometer market is anticipated to register a CAGR of 4.5% during the forecast period.

Who are the Key Players in the Digital BBQ Tongs and Thermometer Market?

Key players holding substantial Digital BBQ Tongs and Thermometer Market share include MAN LAW Australasia Pty Limited, Flame King, BBQ Pro Club, Kovot, Space Grill, Sunartis, BBQ Spit Rotisseries, Williams-Sonoma Inc., Thermoworks, and Admetior.

What is the Future of the Digital BBQ Tongs and Thermometer Market?

As per the analysis, the digital bbq tongs and thermometer market share is likely to be US$ 8.54 Billion by 2032.

Which is the Key Driver in the Digital BBQ Tongs and Thermometer Market?

Demand for digital BBQ tongs and thermometers is likely to rise due to the presence of a sophisticated electronics sector and considerable e-commerce penetration.

Table of Content

1. Executive Summary | Digital BBQ Tongs and Thermometer Market

    1.1. Global Market Outlook

    1.2. Demand-side Trends

    1.3. Supply-side Trends

    1.4. Technology Roadmap Analysis

    1.5. Analysis and Recommendations

2. Market Overview

    2.1. Market Coverage / Taxonomy

    2.2. Market Definition / Scope / Limitations

3. Market Background

    3.1. Market Dynamics

        3.1.1. Drivers

        3.1.2. Restraints

        3.1.3. Opportunity

        3.1.4. Trends

    3.2. Scenario Forecast

        3.2.1. Demand in Optimistic Scenario

        3.2.2. Demand in Likely Scenario

        3.2.3. Demand in Conservative Scenario

    3.3. Opportunity Map Analysis

    3.4. Investment Feasibility Matrix

    3.5. PESTLE and Porter’s Analysis

    3.6. Regulatory Landscape

        3.6.1. By Key Regions

        3.6.2. By Key Countries

4. Global Market Analysis 2017 to 2021 and Forecast, 2022 to 2032

    4.1. Historical Market Size Value (US$ Million) & Volume (Units) Analysis, 2017 to 2021

    4.2. Current and Future Market Size Value (US$ Million) & Volume (Units) Projections, 2022 to 2032

        4.2.1. Y-o-Y Growth Trend Analysis

        4.2.2. Absolute $ Opportunity Analysis

5. Global Market Analysis 2017 to 2021 and Forecast 2022 to 2032, By Component

    5.1. Introduction / Key Findings

    5.2. Historical Market Size Value (US$ Million) & Volume (Units) Analysis By Component, 2017 to 2021

    5.3. Current and Future Market Size Value (US$ Million) & Volume (Units) Analysis and Forecast By Component, 2022 to 2032

        5.3.1. Product

        5.3.2. Accessories

        5.3.3. Services

    5.4. Y-o-Y Growth Trend Analysis By Component, 2017 to 2021

    5.5. Absolute $ Opportunity Analysis By Component, 2022 to 2032

6. Global Market Analysis 2017 to 2021 and Forecast 2022 to 2032, By Type

    6.1. Introduction / Key Findings

    6.2. Historical Market Size Value (US$ Million) & Volume (Units) Analysis By Type, 2017 to 2021

    6.3. Current and Future Market Size Value (US$ Million) & Volume (Units) Analysis and Forecast By Type, 2022 to 2032

        6.3.1. Normal

        6.3.2. Featured

    6.4. Y-o-Y Growth Trend Analysis By Type, 2017 to 2021

    6.5. Absolute $ Opportunity Analysis By Type, 2022 to 2032

7. Global Market Analysis 2017 to 2021 and Forecast 2022 to 2032, By Sales Channels 

    7.1. Introduction / Key Findings

    7.2. Historical Market Size Value (US$ Million) & Volume (Units) Analysis By Sales Channels, 2017 to 2021

    7.3. Current and Future Market Size Value (US$ Million) & Volume (Units) Analysis and Forecast By Sales Channels, 2022 to 2032

        7.3.1. Online

        7.3.2. Offline

    7.4. Y-o-Y Growth Trend Analysis By Sales Channels, 2017 to 2021

    7.5. Absolute $ Opportunity Analysis By Sales Channels, 2022 to 2032

8. Global Market Analysis 2017 to 2021 and Forecast 2022 to 2032, By Region

    8.1. Introduction

    8.2. Historical Market Size Value (US$ Million) & Volume (Units) Analysis By Region, 2017 to 2021

    8.3. Current Market Size Value (US$ Million) & Volume (Units) Analysis and Forecast By Region, 2022 to 2032

        8.3.1. North America

        8.3.2. Latin America

        8.3.3. Europe

        8.3.4. East Asia

        8.3.5. South Asia

        8.3.6. Oceania

        8.3.7. Middle East and Africa

    8.4. Market Attractiveness Analysis By Region

9. North America Market Analysis 2017 to 2021 and Forecast 2022 to 2032, By Country

    9.1. Historical Market Size Value (US$ Million) & Volume (Units) Trend Analysis By Market Taxonomy, 2017 to 2021

    9.2. Market Size Value (US$ Million) & Volume (Units) Forecast By Market Taxonomy, 2022 to 2032

        9.2.1. By Country

            9.2.1.1. USA

            9.2.1.2. Canada

        9.2.2. By Component

        9.2.3. By Type

        9.2.4. By Sales Channels

    9.3. Market Attractiveness Analysis

        9.3.1. By Country

        9.3.2. By Component

        9.3.3. By Type

        9.3.4. By Sales Channels

    9.4. Key Takeaways

10. Latin America Market Analysis 2017 to 2021 and Forecast 2022 to 2032, By Country

    10.1. Historical Market Size Value (US$ Million) & Volume (Units) Trend Analysis By Market Taxonomy, 2017 to 2021

    10.2. Market Size Value (US$ Million) & Volume (Units) Forecast By Market Taxonomy, 2022 to 2032

        10.2.1. By Country

            10.2.1.1. Brazil

            10.2.1.2. Mexico

            10.2.1.3. Rest of Latin America

        10.2.2. By Component

        10.2.3. By Type

        10.2.4. By Sales Channels

    10.3. Market Attractiveness Analysis

        10.3.1. By Country

        10.3.2. By Component

        10.3.3. By Type

        10.3.4. By Sales Channels

    10.4. Key Takeaways

11. Europe Market Analysis 2017 to 2021 and Forecast 2022 to 2032, By Country

    11.1. Historical Market Size Value (US$ Million) & Volume (Units) Trend Analysis By Market Taxonomy, 2017 to 2021

    11.2. Market Size Value (US$ Million) & Volume (Units) Forecast By Market Taxonomy, 2022 to 2032

        11.2.1. By Country

            11.2.1.1. Germany

            11.2.1.2. Italy

            11.2.1.3. France

            11.2.1.4. United Kingdom

            11.2.1.5. Spain

            11.2.1.6. Russia

            11.2.1.7. BENELUX

            11.2.1.8. Rest of Europe

        11.2.2. By Component

        11.2.3. By Type

        11.2.4. By Sales Channels

    11.3. Market Attractiveness Analysis

        11.3.1. By Country

        11.3.2. By Component

        11.3.3. By Type

        11.3.4. By Sales Channels

    11.4. Key Takeaways

12. East Asia Market Analysis 2017 to 2021 and Forecast 2022 to 2032, By Country

    12.1. Historical Market Size Value (US$ Million) & Volume (Units) Trend Analysis By Market Taxonomy, 2017 to 2021

    12.2. Market Size Value (US$ Million) & Volume (Units) Forecast By Market Taxonomy, 2022 to 2032

        12.2.1. By Country

            12.2.1.1. China

            12.2.1.2. Japan

            12.2.1.3. South Korea

        12.2.2. By Component

        12.2.3. By Type

        12.2.4. By Sales Channels

    12.3. Market Attractiveness Analysis

        12.3.1. By Country

        12.3.2. By Component

        12.3.3. By Type

        12.3.4. By Sales Channels

    12.4. Key Takeaways

13. South Asia Market Analysis 2017 to 2021 and Forecast 2022 to 2032, By Country

    13.1. Historical Market Size Value (US$ Million) & Volume (Units) Trend Analysis By Market Taxonomy, 2017 to 2021

    13.2. Market Size Value (US$ Million) & Volume (Units) Forecast By Market Taxonomy, 2022 to 2032

        13.2.1. By Country

            13.2.1.1. India

            13.2.1.2. Thailand

            13.2.1.3. Malaysia

            13.2.1.4. Indonesia

            13.2.1.5. Rest of South Asia

        13.2.2. By Component

        13.2.3. By Type

        13.2.4. By Sales Channels

    13.3. Market Attractiveness Analysis

        13.3.1. By Country

        13.3.2. By Component

        13.3.3. By Type

        13.3.4. By Sales Channels

    13.4. Key Takeaways

14. Oceania Market Analysis 2017 to 2021 and Forecast 2022 to 2032, By Country

    14.1. Historical Market Size Value (US$ Million) & Volume (Units) Trend Analysis By Market Taxonomy, 2017 to 2021

    14.2. Market Size Value (US$ Million) & Volume (Units) Forecast By Market Taxonomy, 2022 to 2032

        14.2.1. By Country

            14.2.1.1. Australia

            14.2.1.2. New Zealand

        14.2.2. By Component

        14.2.3. By Type

        14.2.4. By Sales Channels

    14.3. Market Attractiveness Analysis

        14.3.1. By Country

        14.3.2. By Component

        14.3.3. By Type

        14.3.4. By Sales Channels

    14.4. Key Takeaways

15. Middle East and Africa Market Analysis 2017 to 2021 and Forecast 2022 to 2032, By Country

    15.1. Historical Market Size Value (US$ Million) & Volume (Units) Trend Analysis By Market Taxonomy, 2017 to 2021

    15.2. Market Size Value (US$ Million) & Volume (Units) Forecast By Market Taxonomy, 2022 to 2032

        15.2.1. By Country

            15.2.1.1. GCC Countries

            15.2.1.2. Turkey

            15.2.1.3. Israel

            15.2.1.4. South Africa

            15.2.1.5. Egypt

            15.2.1.6. Rest of Middle East and Africa

        15.2.2. By Component

        15.2.3. By Type

        15.2.4. By Sales Channels

    15.3. Market Attractiveness Analysis

        15.3.1. By Country

        15.3.2. By Component

        15.3.3. By Type

        15.3.4. By Sales Channels

    15.4. Key Takeaways

16. Key Countries Market Analysis

    16.1. USA

        16.1.1. Pricing Analysis

        16.1.2. Market Share Analysis, 2021

            16.1.2.1. By Component

            16.1.2.2. By Type

            16.1.2.3. By Sales Channels

    16.2. Canada

        16.2.1. Pricing Analysis

        16.2.2. Market Share Analysis, 2021

            16.2.2.1. By Component

            16.2.2.2. By Type

            16.2.2.3. By Sales Channels

    16.3. Brazil

        16.3.1. Pricing Analysis

        16.3.2. Market Share Analysis, 2021

            16.3.2.1. By Component

            16.3.2.2. By Type

            16.3.2.3. By Sales Channels

    16.4. Mexico

        16.4.1. Pricing Analysis

        16.4.2. Market Share Analysis, 2021

            16.4.2.1. By Component

            16.4.2.2. By Type

            16.4.2.3. By Sales Channels

    16.5. Argentina

        16.5.1. Pricing Analysis

        16.5.2. Market Share Analysis, 2021

            16.5.2.1. By Component

            16.5.2.2. By Type

            16.5.2.3. By Sales Channels

    16.6. Germany

        16.6.1. Pricing Analysis

        16.6.2. Market Share Analysis, 2021

            16.6.2.1. By Component

            16.6.2.2. By Type

            16.6.2.3. By Sales Channels

    16.7. Italy

        16.7.1. Pricing Analysis

        16.7.2. Market Share Analysis, 2021

            16.7.2.1. By Component

            16.7.2.2. By Type

            16.7.2.3. By Sales Channels

    16.8. France

        16.8.1. Pricing Analysis

        16.8.2. Market Share Analysis, 2021

            16.8.2.1. By Component

            16.8.2.2. By Type

            16.8.2.3. By Sales Channels

    16.9. United Kingdom

        16.9.1. Pricing Analysis

        16.9.2. Market Share Analysis, 2021

            16.9.2.1. By Component

            16.9.2.2. By Type

            16.9.2.3. By Sales Channels

    16.10. Spain

        16.10.1. Pricing Analysis

        16.10.2. Market Share Analysis, 2021

            16.10.2.1. By Component

            16.10.2.2. By Type

            16.10.2.3. By Sales Channels

    16.11. Russia

        16.11.1. Pricing Analysis

        16.11.2. Market Share Analysis, 2021

            16.11.2.1. By Component

            16.11.2.2. By Type

            16.11.2.3. By Sales Channels

    16.12. BENELUX

        16.12.1. Pricing Analysis

        16.12.2. Market Share Analysis, 2021

            16.12.2.1. By Component

            16.12.2.2. By Type

            16.12.2.3. By Sales Channels

    16.13. China

        16.13.1. Pricing Analysis

        16.13.2. Market Share Analysis, 2021

            16.13.2.1. By Component

            16.13.2.2. By Type

            16.13.2.3. By Sales Channels

    16.14. Japan

        16.14.1. Pricing Analysis

        16.14.2. Market Share Analysis, 2021

            16.14.2.1. By Component

            16.14.2.2. By Type

            16.14.2.3. By Sales Channels

    16.15. South Korea

        16.15.1. Pricing Analysis

        16.15.2. Market Share Analysis, 2021

            16.15.2.1. By Component

            16.15.2.2. By Type

            16.15.2.3. By Sales Channels

    16.16. India

        16.16.1. Pricing Analysis

        16.16.2. Market Share Analysis, 2021

            16.16.2.1. By Component

            16.16.2.2. By Type

            16.16.2.3. By Sales Channels

    16.17. GCC Countries

        16.17.1. Pricing Analysis

        16.17.2. Market Share Analysis, 2021

            16.17.2.1. By Component

            16.17.2.2. By Type

            16.17.2.3. By Sales Channels

    16.18. Turkey

        16.18.1. Pricing Analysis

        16.18.2. Market Share Analysis, 2021

            16.18.2.1. By Component

            16.18.2.2. By Type

            16.18.2.3. By Sales Channels

    16.19. Israel

        16.19.1. Pricing Analysis

        16.19.2. Market Share Analysis, 2021

            16.19.2.1. By Component

            16.19.2.2. By Type

            16.19.2.3. By Sales Channels

    16.20. South Africa

        16.20.1. Pricing Analysis

        16.20.2. Market Share Analysis, 2021

            16.20.2.1. By Component

            16.20.2.2. By Type

            16.20.2.3. By Sales Channels

    16.21. Egypt

        16.21.1. Pricing Analysis

        16.21.2. Market Share Analysis, 2021

            16.21.2.1. By Component

            16.21.2.2. By Type

            16.21.2.3. By Sales Channels

17. Market Structure Analysis

    17.1. Competition Dashboard

    17.2. Competition Benchmarking

    17.3. Market Share Analysis of Top Players

        17.3.1. By Regional

        17.3.2. By Component

        17.3.3. By Type

        17.3.4. By Sales Channels

18. Competition Analysis

    18.1. Competition Deep Dive

        18.1.1. MAN LAW Australasia Pty Limited

            18.1.1.1. Overview

            18.1.1.2. Product Portfolio

            18.1.1.3. Profitability by Market Segment

            18.1.1.4. Sales Footprint

            18.1.1.5. Strategy Overview

                18.1.1.5.1. Marketing Strategy

                18.1.1.5.2. Product Strategy

        18.1.2. Flame King

            18.1.2.1. Overview

            18.1.2.2. Product Portfolio

            18.1.2.3. Profitability by Market Segment

            18.1.2.4. Sales Footprint

            18.1.2.5. Strategy Overview

                18.1.2.5.1. Marketing Strategy

                18.1.2.5.2. Product Strategy

        18.1.3. BBQ Pro Club

            18.1.3.1. Overview

            18.1.3.2. Product Portfolio

            18.1.3.3. Profitability by Market Segment

            18.1.3.4. Sales Footprint

            18.1.3.5. Strategy Overview

                18.1.3.5.1. Marketing Strategy

                18.1.3.5.2. Product Strategy

        18.1.4. Kovot

            18.1.4.1. Overview

            18.1.4.2. Product Portfolio

            18.1.4.3. Profitability by Market Segment

            18.1.4.4. Sales Footprint

            18.1.4.5. Strategy Overview

                18.1.4.5.1. Marketing Strategy

                18.1.4.5.2. Product Strategy

        18.1.5. Space grill

            18.1.5.1. Overview

            18.1.5.2. Product Portfolio

            18.1.5.3. Profitability by Market Segment

            18.1.5.4. Sales Footprint

            18.1.5.5. Strategy Overview

                18.1.5.5.1. Marketing Strategy

                18.1.5.5.2. Product Strategy

        18.1.6. Sunartis

            18.1.6.1. Overview

            18.1.6.2. Product Portfolio

            18.1.6.3. Profitability by Market Segment

            18.1.6.4. Sales Footprint

            18.1.6.5. Strategy Overview

                18.1.6.5.1. Marketing Strategy

                18.1.6.5.2. Product Strategy

        18.1.7. BBQ Spit Rotisseries

            18.1.7.1. Overview

            18.1.7.2. Product Portfolio

            18.1.7.3. Profitability by Market Segment

            18.1.7.4. Sales Footprint

            18.1.7.5. Strategy Overview

                18.1.7.5.1. Marketing Strategy

                18.1.7.5.2. Product Strategy

        18.1.8. Williams-Sonoma Inc.

            18.1.8.1. Overview

            18.1.8.2. Product Portfolio

            18.1.8.3. Profitability by Market Segment

            18.1.8.4. Sales Footprint

            18.1.8.5. Strategy Overview

                18.1.8.5.1. Marketing Strategy

                18.1.8.5.2. Product Strategy

        18.1.9. Thermoworks

            18.1.9.1. Overview

            18.1.9.2. Product Portfolio

            18.1.9.3. Profitability by Market Segment

            18.1.9.4. Sales Footprint

            18.1.9.5. Strategy Overview

                18.1.9.5.1. Marketing Strategy

                18.1.9.5.2. Product Strategy

        18.1.10. Admetior

            18.1.10.1. Overview

            18.1.10.2. Product Portfolio

            18.1.10.3. Profitability by Market Segment

            18.1.10.4. Sales Footprint

            18.1.10.5. Strategy Overview

                18.1.10.5.1. Marketing Strategy

                18.1.10.5.2. Product Strategy

        18.1.11. Ablegrid

            18.1.11.1. Overview

            18.1.11.2. Product Portfolio

            18.1.11.3. Profitability by Market Segment

            18.1.11.4. Sales Footprint

            18.1.11.5. Strategy Overview

                18.1.11.5.1. Marketing Strategy

                18.1.11.5.2. Product Strategy

        18.1.12. Alvena

            18.1.12.1. Overview

            18.1.12.2. Product Portfolio

            18.1.12.3. Profitability by Market Segment

            18.1.12.4. Sales Footprint

            18.1.12.5. Strategy Overview

                18.1.12.5.1. Marketing Strategy

                18.1.12.5.2. Product Strategy

        18.1.13. Inkbird

            18.1.13.1. Overview

            18.1.13.2. Product Portfolio

            18.1.13.3. Profitability by Market Segment

            18.1.13.4. Sales Footprint

            18.1.13.5. Strategy Overview

                18.1.13.5.1. Marketing Strategy

                18.1.13.5.2. Product Strategy

        18.1.14. Thermopro

            18.1.14.1. Overview

            18.1.14.2. Product Portfolio

            18.1.14.3. Profitability by Market Segment

            18.1.14.4. Sales Footprint

            18.1.14.5. Strategy Overview

                18.1.14.5.1. Marketing Strategy

                18.1.14.5.2. Product Strategy

        18.1.15. BFOUR

            18.1.15.1. Overview

            18.1.15.2. Product Portfolio

            18.1.15.3. Profitability by Market Segment

            18.1.15.4. Sales Footprint

            18.1.15.5. Strategy Overview

                18.1.15.5.1. Marketing Strategy

                18.1.15.5.2. Product Strategy

19. Assumptions & Acronyms Used

20. Research Methodology

Don't pay for what you don't need

Customize your report by selecting specific countries or regions and save 30%!

List of Tables

Table 1: Global Market Value (US$ Million) Forecast by Region, 2017 to 2032

Table 2: Global Market Volume (Units) Forecast by Region, 2017 to 2032

Table 3: Global Market Value (US$ Million) Forecast by Component, 2017 to 2032

Table 4: Global Market Volume (Units) Forecast by Component, 2017 to 2032

Table 5: Global Market Value (US$ Million) Forecast by Type, 2017 to 2032

Table 6: Global Market Volume (Units) Forecast by Type, 2017 to 2032

Table 7: Global Market Value (US$ Million) Forecast by Sales Channels, 2017 to 2032

Table 8: Global Market Volume (Units) Forecast by Sales Channels, 2017 to 2032

Table 9: North America Market Value (US$ Million) Forecast by Country, 2017 to 2032

Table 10: North America Market Volume (Units) Forecast by Country, 2017 to 2032

Table 11: North America Market Value (US$ Million) Forecast by Component, 2017 to 2032

Table 12: North America Market Volume (Units) Forecast by Component, 2017 to 2032

Table 13: North America Market Value (US$ Million) Forecast by Type, 2017 to 2032

Table 14: North America Market Volume (Units) Forecast by Type, 2017 to 2032

Table 15: North America Market Value (US$ Million) Forecast by Sales Channels, 2017 to 2032

Table 16: North America Market Volume (Units) Forecast by Sales Channels, 2017 to 2032

Table 17: Latin America Market Value (US$ Million) Forecast by Country, 2017 to 2032

Table 18: Latin America Market Volume (Units) Forecast by Country, 2017 to 2032

Table 19: Latin America Market Value (US$ Million) Forecast by Component, 2017 to 2032

Table 20: Latin America Market Volume (Units) Forecast by Component, 2017 to 2032

Table 21: Latin America Market Value (US$ Million) Forecast by Type, 2017 to 2032

Table 22: Latin America Market Volume (Units) Forecast by Type, 2017 to 2032

Table 23: Latin America Market Value (US$ Million) Forecast by Sales Channels, 2017 to 2032

Table 24: Latin America Market Volume (Units) Forecast by Sales Channels, 2017 to 2032

Table 25: Europe Market Value (US$ Million) Forecast by Country, 2017 to 2032

Table 26: Europe Market Volume (Units) Forecast by Country, 2017 to 2032

Table 27: Europe Market Value (US$ Million) Forecast by Component, 2017 to 2032

Table 28: Europe Market Volume (Units) Forecast by Component, 2017 to 2032

Table 29: Europe Market Value (US$ Million) Forecast by Type, 2017 to 2032

Table 30: Europe Market Volume (Units) Forecast by Type, 2017 to 2032

Table 31: Europe Market Value (US$ Million) Forecast by Sales Channels, 2017 to 2032

Table 32: Europe Market Volume (Units) Forecast by Sales Channels, 2017 to 2032

Table 33: East Asia Market Value (US$ Million) Forecast by Country, 2017 to 2032

Table 34: East Asia Market Volume (Units) Forecast by Country, 2017 to 2032

Table 35: East Asia Market Value (US$ Million) Forecast by Component, 2017 to 2032

Table 36: East Asia Market Volume (Units) Forecast by Component, 2017 to 2032

Table 37: East Asia Market Value (US$ Million) Forecast by Type, 2017 to 2032

Table 38: East Asia Market Volume (Units) Forecast by Type, 2017 to 2032

Table 39: East Asia Market Value (US$ Million) Forecast by Sales Channels, 2017 to 2032

Table 40: East Asia Market Volume (Units) Forecast by Sales Channels, 2017 to 2032

Table 41: South Asia Market Value (US$ Million) Forecast by Country, 2017 to 2032

Table 42: South Asia Market Volume (Units) Forecast by Country, 2017 to 2032

Table 43: South Asia Market Value (US$ Million) Forecast by Component, 2017 to 2032

Table 44: South Asia Market Volume (Units) Forecast by Component, 2017 to 2032

Table 45: South Asia Market Value (US$ Million) Forecast by Type, 2017 to 2032

Table 46: South Asia Market Volume (Units) Forecast by Type, 2017 to 2032

Table 47: South Asia Market Value (US$ Million) Forecast by Sales Channels, 2017 to 2032

Table 48: South Asia Market Volume (Units) Forecast by Sales Channels, 2017 to 2032

Table 49: Oceania Market Value (US$ Million) Forecast by Country, 2017 to 2032

Table 50: Oceania Market Volume (Units) Forecast by Country, 2017 to 2032

Table 51: Oceania Market Value (US$ Million) Forecast by Component, 2017 to 2032

Table 52: Oceania Market Volume (Units) Forecast by Component, 2017 to 2032

Table 53: Oceania Market Value (US$ Million) Forecast by Type, 2017 to 2032

Table 54: Oceania Market Volume (Units) Forecast by Type, 2017 to 2032

Table 55: Oceania Market Value (US$ Million) Forecast by Sales Channels, 2017 to 2032

Table 56: Oceania Market Volume (Units) Forecast by Sales Channels, 2017 to 2032

Table 57: MEA Market Value (US$ Million) Forecast by Country, 2017 to 2032

Table 58: MEA Market Volume (Units) Forecast by Country, 2017 to 2032

Table 59: MEA Market Value (US$ Million) Forecast by Component, 2017 to 2032

Table 60: MEA Market Volume (Units) Forecast by Component, 2017 to 2032

Table 61: MEA Market Value (US$ Million) Forecast by Type, 2017 to 2032

Table 62: MEA Market Volume (Units) Forecast by Type, 2017 to 2032

Table 63: MEA Market Value (US$ Million) Forecast by Sales Channels, 2017 to 2032

Table 64: MEA Market Volume (Units) Forecast by Sales Channels, 2017 to 2032
Sneha Verghese
Sneha Verghese

Principal Consultant

Talk to Analyst

Find your sweet spots for generating winning opportunities in this market.

List of Charts

Figure 1: Global Market Value (US$ Million) by Component, 2022 to 2032

Figure 2: Global Market Value (US$ Million) by Type, 2022 to 2032

Figure 3: Global Market Value (US$ Million) by Sales Channels, 2022 to 2032

Figure 4: Global Market Value (US$ Million) by Region, 2022 to 2032

Figure 5: Global Market Value (US$ Million) Analysis by Region, 2017 to 2032

Figure 6: Global Market Volume (Units) Analysis by Region, 2017 to 2032

Figure 7: Global Market Value Share (%) and BPS Analysis by Region, 2022 to 2032

Figure 8: Global Market Y-o-Y Growth (%) Projections by Region, 2022 to 2032

Figure 9: Global Market Value (US$ Million) Analysis by Component, 2017 to 2032

Figure 10: Global Market Volume (Units) Analysis by Component, 2017 to 2032

Figure 11: Global Market Value Share (%) and BPS Analysis by Component, 2022 to 2032

Figure 12: Global Market Y-o-Y Growth (%) Projections by Component, 2022 to 2032

Figure 13: Global Market Value (US$ Million) Analysis by Type, 2017 to 2032

Figure 14: Global Market Volume (Units) Analysis by Type, 2017 to 2032

Figure 15: Global Market Value Share (%) and BPS Analysis by Type, 2022 to 2032

Figure 16: Global Market Y-o-Y Growth (%) Projections by Type, 2022 to 2032

Figure 17: Global Market Value (US$ Million) Analysis by Sales Channels, 2017 to 2032

Figure 18: Global Market Volume (Units) Analysis by Sales Channels, 2017 to 2032

Figure 19: Global Market Value Share (%) and BPS Analysis by Sales Channels, 2022 to 2032

Figure 20: Global Market Y-o-Y Growth (%) Projections by Sales Channels, 2022 to 2032

Figure 21: Global Market Attractiveness by Component, 2022 to 2032

Figure 22: Global Market Attractiveness by Type, 2022 to 2032

Figure 23: Global Market Attractiveness by Sales Channels, 2022 to 2032

Figure 24: Global Market Attractiveness by Region, 2022 to 2032

Figure 25: North America Market Value (US$ Million) by Component, 2022 to 2032

Figure 26: North America Market Value (US$ Million) by Type, 2022 to 2032

Figure 27: North America Market Value (US$ Million) by Sales Channels, 2022 to 2032

Figure 28: North America Market Value (US$ Million) by Country, 2022 to 2032

Figure 29: North America Market Value (US$ Million) Analysis by Country, 2017 to 2032

Figure 30: North America Market Volume (Units) Analysis by Country, 2017 to 2032

Figure 31: North America Market Value Share (%) and BPS Analysis by Country, 2022 to 2032

Figure 32: North America Market Y-o-Y Growth (%) Projections by Country, 2022 to 2032

Figure 33: North America Market Value (US$ Million) Analysis by Component, 2017 to 2032

Figure 34: North America Market Volume (Units) Analysis by Component, 2017 to 2032

Figure 35: North America Market Value Share (%) and BPS Analysis by Component, 2022 to 2032

Figure 36: North America Market Y-o-Y Growth (%) Projections by Component, 2022 to 2032

Figure 37: North America Market Value (US$ Million) Analysis by Type, 2017 to 2032

Figure 38: North America Market Volume (Units) Analysis by Type, 2017 to 2032

Figure 39: North America Market Value Share (%) and BPS Analysis by Type, 2022 to 2032

Figure 40: North America Market Y-o-Y Growth (%) Projections by Type, 2022 to 2032

Figure 41: North America Market Value (US$ Million) Analysis by Sales Channels, 2017 to 2032

Figure 42: North America Market Volume (Units) Analysis by Sales Channels, 2017 to 2032

Figure 43: North America Market Value Share (%) and BPS Analysis by Sales Channels, 2022 to 2032

Figure 44: North America Market Y-o-Y Growth (%) Projections by Sales Channels, 2022 to 2032

Figure 45: North America Market Attractiveness by Component, 2022 to 2032

Figure 46: North America Market Attractiveness by Type, 2022 to 2032

Figure 47: North America Market Attractiveness by Sales Channels, 2022 to 2032

Figure 48: North America Market Attractiveness by Country, 2022 to 2032

Figure 49: Latin America Market Value (US$ Million) by Component, 2022 to 2032

Figure 50: Latin America Market Value (US$ Million) by Type, 2022 to 2032

Figure 51: Latin America Market Value (US$ Million) by Sales Channels, 2022 to 2032

Figure 52: Latin America Market Value (US$ Million) by Country, 2022 to 2032

Figure 53: Latin America Market Value (US$ Million) Analysis by Country, 2017 to 2032

Figure 54: Latin America Market Volume (Units) Analysis by Country, 2017 to 2032

Figure 55: Latin America Market Value Share (%) and BPS Analysis by Country, 2022 to 2032

Figure 56: Latin America Market Y-o-Y Growth (%) Projections by Country, 2022 to 2032

Figure 57: Latin America Market Value (US$ Million) Analysis by Component, 2017 to 2032

Figure 58: Latin America Market Volume (Units) Analysis by Component, 2017 to 2032

Figure 59: Latin America Market Value Share (%) and BPS Analysis by Component, 2022 to 2032

Figure 60: Latin America Market Y-o-Y Growth (%) Projections by Component, 2022 to 2032

Figure 61: Latin America Market Value (US$ Million) Analysis by Type, 2017 to 2032

Figure 62: Latin America Market Volume (Units) Analysis by Type, 2017 to 2032

Figure 63: Latin America Market Value Share (%) and BPS Analysis by Type, 2022 to 2032

Figure 64: Latin America Market Y-o-Y Growth (%) Projections by Type, 2022 to 2032

Figure 65: Latin America Market Value (US$ Million) Analysis by Sales Channels, 2017 to 2032

Figure 66: Latin America Market Volume (Units) Analysis by Sales Channels, 2017 to 2032

Figure 67: Latin America Market Value Share (%) and BPS Analysis by Sales Channels, 2022 to 2032

Figure 68: Latin America Market Y-o-Y Growth (%) Projections by Sales Channels, 2022 to 2032

Figure 69: Latin America Market Attractiveness by Component, 2022 to 2032

Figure 70: Latin America Market Attractiveness by Type, 2022 to 2032

Figure 71: Latin America Market Attractiveness by Sales Channels, 2022 to 2032

Figure 72: Latin America Market Attractiveness by Country, 2022 to 2032

Figure 73: Europe Market Value (US$ Million) by Component, 2022 to 2032

Figure 74: Europe Market Value (US$ Million) by Type, 2022 to 2032

Figure 75: Europe Market Value (US$ Million) by Sales Channels, 2022 to 2032

Figure 76: Europe Market Value (US$ Million) by Country, 2022 to 2032

Figure 77: Europe Market Value (US$ Million) Analysis by Country, 2017 to 2032

Figure 78: Europe Market Volume (Units) Analysis by Country, 2017 to 2032

Figure 79: Europe Market Value Share (%) and BPS Analysis by Country, 2022 to 2032

Figure 80: Europe Market Y-o-Y Growth (%) Projections by Country, 2022 to 2032

Figure 81: Europe Market Value (US$ Million) Analysis by Component, 2017 to 2032

Figure 82: Europe Market Volume (Units) Analysis by Component, 2017 to 2032

Figure 83: Europe Market Value Share (%) and BPS Analysis by Component, 2022 to 2032

Figure 84: Europe Market Y-o-Y Growth (%) Projections by Component, 2022 to 2032

Figure 85: Europe Market Value (US$ Million) Analysis by Type, 2017 to 2032

Figure 86: Europe Market Volume (Units) Analysis by Type, 2017 to 2032

Figure 87: Europe Market Value Share (%) and BPS Analysis by Type, 2022 to 2032

Figure 88: Europe Market Y-o-Y Growth (%) Projections by Type, 2022 to 2032

Figure 89: Europe Market Value (US$ Million) Analysis by Sales Channels, 2017 to 2032

Figure 90: Europe Market Volume (Units) Analysis by Sales Channels, 2017 to 2032

Figure 91: Europe Market Value Share (%) and BPS Analysis by Sales Channels, 2022 to 2032

Figure 92: Europe Market Y-o-Y Growth (%) Projections by Sales Channels, 2022 to 2032

Figure 93: Europe Market Attractiveness by Component, 2022 to 2032

Figure 94: Europe Market Attractiveness by Type, 2022 to 2032

Figure 95: Europe Market Attractiveness by Sales Channels, 2022 to 2032

Figure 96: Europe Market Attractiveness by Country, 2022 to 2032

Figure 97: East Asia Market Value (US$ Million) by Component, 2022 to 2032

Figure 98: East Asia Market Value (US$ Million) by Type, 2022 to 2032

Figure 99: East Asia Market Value (US$ Million) by Sales Channels, 2022 to 2032

Figure 100: East Asia Market Value (US$ Million) by Country, 2022 to 2032

Figure 101: East Asia Market Value (US$ Million) Analysis by Country, 2017 to 2032

Figure 102: East Asia Market Volume (Units) Analysis by Country, 2017 to 2032

Figure 103: East Asia Market Value Share (%) and BPS Analysis by Country, 2022 to 2032

Figure 104: East Asia Market Y-o-Y Growth (%) Projections by Country, 2022 to 2032

Figure 105: East Asia Market Value (US$ Million) Analysis by Component, 2017 to 2032

Figure 106: East Asia Market Volume (Units) Analysis by Component, 2017 to 2032

Figure 107: East Asia Market Value Share (%) and BPS Analysis by Component, 2022 to 2032

Figure 108: East Asia Market Y-o-Y Growth (%) Projections by Component, 2022 to 2032

Figure 109: East Asia Market Value (US$ Million) Analysis by Type, 2017 to 2032

Figure 110: East Asia Market Volume (Units) Analysis by Type, 2017 to 2032

Figure 111: East Asia Market Value Share (%) and BPS Analysis by Type, 2022 to 2032

Figure 112: East Asia Market Y-o-Y Growth (%) Projections by Type, 2022 to 2032

Figure 113: East Asia Market Value (US$ Million) Analysis by Sales Channels, 2017 to 2032

Figure 114: East Asia Market Volume (Units) Analysis by Sales Channels, 2017 to 2032

Figure 115: East Asia Market Value Share (%) and BPS Analysis by Sales Channels, 2022 to 2032

Figure 116: East Asia Market Y-o-Y Growth (%) Projections by Sales Channels, 2022 to 2032

Figure 117: East Asia Market Attractiveness by Component, 2022 to 2032

Figure 118: East Asia Market Attractiveness by Type, 2022 to 2032

Figure 119: East Asia Market Attractiveness by Sales Channels, 2022 to 2032

Figure 120: East Asia Market Attractiveness by Country, 2022 to 2032

Figure 121: South Asia Market Value (US$ Million) by Component, 2022 to 2032

Figure 122: South Asia Market Value (US$ Million) by Type, 2022 to 2032

Figure 123: South Asia Market Value (US$ Million) by Sales Channels, 2022 to 2032

Figure 124: South Asia Market Value (US$ Million) by Country, 2022 to 2032

Figure 125: South Asia Market Value (US$ Million) Analysis by Country, 2017 to 2032

Figure 126: South Asia Market Volume (Units) Analysis by Country, 2017 to 2032

Figure 127: South Asia Market Value Share (%) and BPS Analysis by Country, 2022 to 2032

Figure 128: South Asia Market Y-o-Y Growth (%) Projections by Country, 2022 to 2032

Figure 129: South Asia Market Value (US$ Million) Analysis by Component, 2017 to 2032

Figure 130: South Asia Market Volume (Units) Analysis by Component, 2017 to 2032

Figure 131: South Asia Market Value Share (%) and BPS Analysis by Component, 2022 to 2032

Figure 132: South Asia Market Y-o-Y Growth (%) Projections by Component, 2022 to 2032

Figure 133: South Asia Market Value (US$ Million) Analysis by Type, 2017 to 2032

Figure 134: South Asia Market Volume (Units) Analysis by Type, 2017 to 2032

Figure 135: South Asia Market Value Share (%) and BPS Analysis by Type, 2022 to 2032

Figure 136: South Asia Market Y-o-Y Growth (%) Projections by Type, 2022 to 2032

Figure 137: South Asia Market Value (US$ Million) Analysis by Sales Channels, 2017 to 2032

Figure 138: South Asia Market Volume (Units) Analysis by Sales Channels, 2017 to 2032

Figure 139: South Asia Market Value Share (%) and BPS Analysis by Sales Channels, 2022 to 2032

Figure 140: South Asia Market Y-o-Y Growth (%) Projections by Sales Channels, 2022 to 2032

Figure 141: South Asia Market Attractiveness by Component, 2022 to 2032

Figure 142: South Asia Market Attractiveness by Type, 2022 to 2032

Figure 143: South Asia Market Attractiveness by Sales Channels, 2022 to 2032

Figure 144: South Asia Market Attractiveness by Country, 2022 to 2032

Figure 145: Oceania Market Value (US$ Million) by Component, 2022 to 2032

Figure 146: Oceania Market Value (US$ Million) by Type, 2022 to 2032

Figure 147: Oceania Market Value (US$ Million) by Sales Channels, 2022 to 2032

Figure 148: Oceania Market Value (US$ Million) by Country, 2022 to 2032

Figure 149: Oceania Market Value (US$ Million) Analysis by Country, 2017 to 2032

Figure 150: Oceania Market Volume (Units) Analysis by Country, 2017 to 2032

Figure 151: Oceania Market Value Share (%) and BPS Analysis by Country, 2022 to 2032

Figure 152: Oceania Market Y-o-Y Growth (%) Projections by Country, 2022 to 2032

Figure 153: Oceania Market Value (US$ Million) Analysis by Component, 2017 to 2032

Figure 154: Oceania Market Volume (Units) Analysis by Component, 2017 to 2032

Figure 155: Oceania Market Value Share (%) and BPS Analysis by Component, 2022 to 2032

Figure 156: Oceania Market Y-o-Y Growth (%) Projections by Component, 2022 to 2032

Figure 157: Oceania Market Value (US$ Million) Analysis by Type, 2017 to 2032

Figure 158: Oceania Market Volume (Units) Analysis by Type, 2017 to 2032

Figure 159: Oceania Market Value Share (%) and BPS Analysis by Type, 2022 to 2032

Figure 160: Oceania Market Y-o-Y Growth (%) Projections by Type, 2022 to 2032

Figure 161: Oceania Market Value (US$ Million) Analysis by Sales Channels, 2017 to 2032

Figure 162: Oceania Market Volume (Units) Analysis by Sales Channels, 2017 to 2032

Figure 163: Oceania Market Value Share (%) and BPS Analysis by Sales Channels, 2022 to 2032

Figure 164: Oceania Market Y-o-Y Growth (%) Projections by Sales Channels, 2022 to 2032

Figure 165: Oceania Market Attractiveness by Component, 2022 to 2032

Figure 166: Oceania Market Attractiveness by Type, 2022 to 2032

Figure 167: Oceania Market Attractiveness by Sales Channels, 2022 to 2032

Figure 168: Oceania Market Attractiveness by Country, 2022 to 2032

Figure 169: MEA Market Value (US$ Million) by Component, 2022 to 2032

Figure 170: MEA Market Value (US$ Million) by Type, 2022 to 2032

Figure 171: MEA Market Value (US$ Million) by Sales Channels, 2022 to 2032

Figure 172: MEA Market Value (US$ Million) by Country, 2022 to 2032

Figure 173: MEA Market Value (US$ Million) Analysis by Country, 2017 to 2032

Figure 174: MEA Market Volume (Units) Analysis by Country, 2017 to 2032

Figure 175: MEA Market Value Share (%) and BPS Analysis by Country, 2022 to 2032

Figure 176: MEA Market Y-o-Y Growth (%) Projections by Country, 2022 to 2032

Figure 177: MEA Market Value (US$ Million) Analysis by Component, 2017 to 2032

Figure 178: MEA Market Volume (Units) Analysis by Component, 2017 to 2032

Figure 179: MEA Market Value Share (%) and BPS Analysis by Component, 2022 to 2032

Figure 180: MEA Market Y-o-Y Growth (%) Projections by Component, 2022 to 2032

Figure 181: MEA Market Value (US$ Million) Analysis by Type, 2017 to 2032

Figure 182: MEA Market Volume (Units) Analysis by Type, 2017 to 2032

Figure 183: MEA Market Value Share (%) and BPS Analysis by Type, 2022 to 2032

Figure 184: MEA Market Y-o-Y Growth (%) Projections by Type, 2022 to 2032

Figure 185: MEA Market Value (US$ Million) Analysis by Sales Channels, 2017 to 2032

Figure 186: MEA Market Volume (Units) Analysis by Sales Channels, 2017 to 2032

Figure 187: MEA Market Value Share (%) and BPS Analysis by Sales Channels, 2022 to 2032

Figure 188: MEA Market Y-o-Y Growth (%) Projections by Sales Channels, 2022 to 2032

Figure 189: MEA Market Attractiveness by Component, 2022 to 2032

Figure 190: MEA Market Attractiveness by Type, 2022 to 2032

Figure 191: MEA Market Attractiveness by Sales Channels, 2022 to 2032

Figure 192: MEA Market Attractiveness by Country, 2022 to 2032

Explore Consumer Product Insights

View Reports

Digital BBQ Tongs and Thermometer Market