The Digital Elevation Model Market is estimated to be valued at USD 2.4 billion in 2025 and is projected to reach USD 10.3 billion by 2035, registering a compound annual growth rate (CAGR) of 15.9% over the forecast period.
The Digital Elevation Model market is experiencing significant growth driven by the increasing need for accurate terrain and topographic data in planning, construction, and environmental management. The future outlook for this market is influenced by advancements in geospatial technologies, improved data acquisition methods, and the integration of high-resolution satellite imagery and LiDAR systems.
The market is further supported by the rising adoption of digital elevation models in urban planning, infrastructure development, and disaster management, enabling precise mapping and simulation for informed decision-making. The growing emphasis on sustainable construction practices and climate-resilient infrastructure has increased reliance on DEM tools for risk assessment and resource optimization.
Additionally, the integration of DEM software with geographic information systems and modeling platforms provides actionable insights, facilitating better analysis for hydrological modeling, bathymetric studies, and terrain-based planning As government agencies, engineering firms, and research institutions seek more efficient and accurate methods for land assessment and project planning, the DEM market is poised for continued expansion across commercial, environmental, and industrial applications.
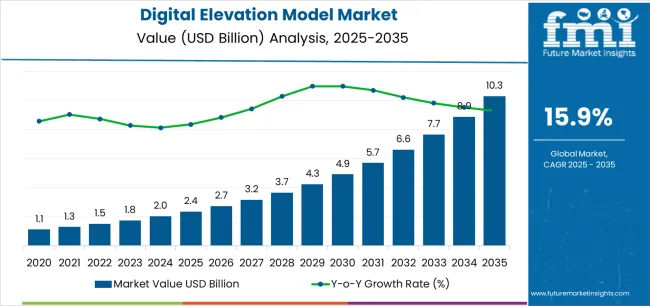
| Metric | Value |
|---|---|
| Digital Elevation Model Market Estimated Value in (2025 E) | USD 2.4 billion |
| Digital Elevation Model Market Forecast Value in (2035 F) | USD 10.3 billion |
| Forecast CAGR (2025 to 2035) | 15.9% |
The market is segmented by Tools, Application, and Industry and region. By Tools, the market is divided into Digital Elevation Model Software, Digital Elevation Model Services, Rendering 3-D Visualization, DEM Maps in 2D or 3D CAD, Building Layouts and Relief Maps, Rectification of Satellite Images and Aerial Photograph, and Drainage and Sight Analysis. In terms of Application, the market is classified into Hydrological Modelling and Bathymetric Analysis, Disaster Prevention, Infrastructure, Agriculture, 3D Visualization, Mapping, and Gravity Measurements Terrain Correction or Reduction. Based on Industry, the market is segmented into Planning and Construction, Transportation and Tourism, Oil and Mining, Aviation, Geological, Weather, Military and Defence, and Telecommunication. Regionally, the market is classified into North America, Latin America, Western Europe, Eastern Europe, Balkan & Baltic Countries, Russia & Belarus, Central Asia, East Asia, South Asia & Pacific, and the Middle East & Africa.
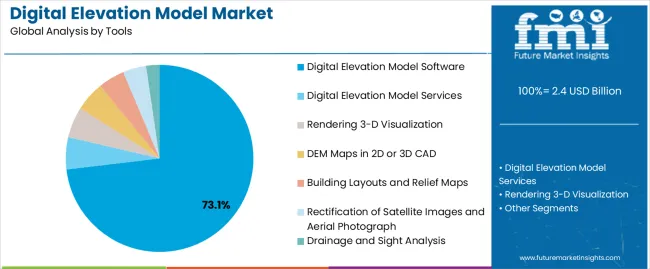
The Digital Elevation Model Software segment is projected to hold 73.10% of the market revenue share in 2025, making it the leading tools segment. This dominance is driven by the increasing adoption of software solutions for accurate and scalable terrain modeling.
The software enables seamless integration with GIS platforms, facilitates high-resolution mapping, and supports complex analyses such as hydrological modeling and bathymetric studies. The flexibility and adaptability of DEM software allow users to process large datasets efficiently, improving decision-making across planning and construction projects.
Moreover, advancements in cloud-based platforms and analytical tools have enhanced accessibility and real-time processing capabilities, further reinforcing the segment’s prominence The widespread deployment of software solutions by engineering firms, environmental agencies, and research organizations has consolidated its market leadership and created opportunities for continued growth.
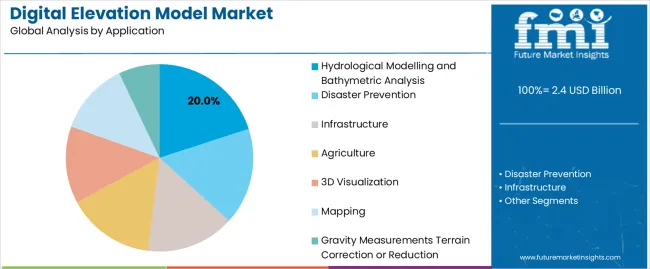
The hydrological modeling and bathymetric analysis application segment is expected to account for 20.00% of the market revenue share in 2025, establishing it as the leading application segment. Growth in this segment is fueled by the increasing demand for precise water resource management, flood risk assessment, and coastal planning.
Advanced DEM tools enable detailed simulation of terrain and water flow, supporting critical decision-making in urban planning, environmental protection, and disaster preparedness. The rising focus on sustainable water management and infrastructure resilience has accelerated the adoption of DEM solutions for hydrological and bathymetric analysis.
Integration with predictive modeling and geospatial analytics further enhances the accuracy and reliability of results, encouraging wider use across government agencies, research institutions, and commercial enterprises The segment’s growth is reinforced by regulatory compliance requirements and the growing need for data-driven planning in both developed and emerging regions.
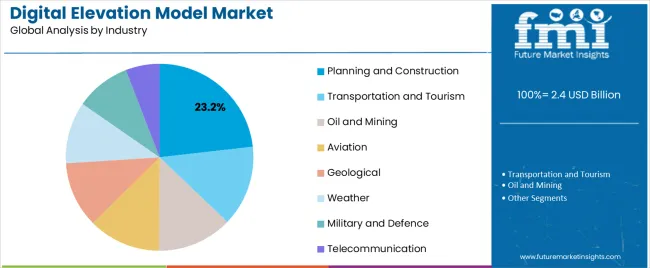
The planning and construction industry segment is anticipated to hold 23.20% of the market revenue in 2025, making it the leading end-use industry. This growth is attributed to the increasing reliance on DEM data for site assessment, project planning, and infrastructure development. DEM tools provide detailed topographical insights that help engineers and planners optimize design, mitigate construction risks, and ensure regulatory compliance.
The integration of digital elevation models with project management and GIS platforms facilitates efficient resource allocation, cost reduction, and precise construction monitoring. Rising investments in urban development, transportation projects, and industrial infrastructure have accelerated the adoption of DEM solutions in the planning and construction sector.
Furthermore, the ability of DEM tools to support sustainable and climate-resilient designs has made them essential for contemporary construction practices As demand for intelligent, data-driven construction solutions continues to grow, the commercial adoption of DEM technologies is expected to expand steadily.
The market is experiencing continuous growth due to the increasing need for precise topographic information in various sectors like environmental monitoring, disaster management, and infrastructure development.
Advances in technology, particularly in LiDAR technology, are key to improving data acquisition and abilities, fueling the accuracy and resolution of digital elevation models.
The amalgamation of digital elevation models with GIS platforms and other geospatial applications is enabling users to conduct progressive spatial analysis, leading to increased adoption across industries.
Government compliance with regulations and initiatives endorsing the use of geospatial data for proper urban and resource management is driving the popularity of digital elevation models.
The availability of open-source digital elevation model data and the emergence of cloud-based platforms for processing and analyzing digital elevation models are promoting market growth by reducing costs and improving accessibility.
The digital elevation model software tool is predicted to grasp a market share of 73.10% in 2025.
The digital elevation model (DEM) software is becoming more popular in the market due to its various advantages compared to traditional terrain modeling tools. The high accuracy, precision, and capacity to create detailed 3D models of terrain make it a necessary tool for professionals in various industries.
The capability of the software integrated with tools and software like GIS and GPS is another substantial advantage. This integration allows for seamless data transfer and analysis. This makes it easier for professionals to work with the software and produce detailed models.
| Attributes | Details |
|---|---|
| Top Tool | Digital Elevation Model Software |
| Market Share (2025) | 73.10% |
The planning and construction sector is estimated to hold 73.10% market share in 2025 due to the growing demand for precise terrain data.
The market is reaching new heights in environmental management and construction, with important industry segments. The growing demand for highly accurate and detailed terrain data in planning and construction has emerged as the main segment of this market.
The advancements in terrain mapping technologies and the growing demand for correct and reliable geographical data in the digital elevation models market are poised for significant growth in the upcoming years. The market is driven by factors like the implementation of 5G networks and the digitization of agricultural zones.
| Attributes | Details |
|---|---|
| Top Industry | Planning and Construction |
| Market Share (2025) | 23.20% |
| Countries | CAGR (2025 to 2035) |
|---|---|
| United State | 13.50% |
| Germany | 12.10% |
| Japan | 11.40% |
| China | 17.20% |
| Australia | 20.20% |
The United States market is predicted to witness a CAGR of 13.50% during 2025-2035. Several factors influence the growth rate of the market.
The country has highly developed infrastructure for 5G modules, economic construction of infrastructure, and a growing telecommunications industry, which is driving market.
Key players in the country, such as Harris Corporation, are developing differentiated and mission-critical solutions for customers worldwide, further driving demand for digital elevation models.
Germany’s market is projected to grow at a CAGR of 12.10% from 2025-2035, influenced by various factors.
The country has a highly developed infrastructure for the telecommunications industry, transportation and tourism, and the geological sector, which is fueling the demand for digital elevation models.
Recent developments in the country, such as the installation of two digital elevation models in the states of Berlin and Hamburg, have further fueled the demand for digital elevation models in Germany.
Japan’s market is expected to experience a CAGR of 11.40% from 2025-2035, influenced by various factors.
The intensifying use of technology in Japan for disaster management, infrastructure development, and urban planning. Organizations are focusing on developing digital elevation models to support these sectors which is driving the market.
The use of digital elevation models is also employed for land surface assessment and identifying suitable areas for cultivation, plantation, and excavation, leading to their increased adoption in these industries.
China’s market is projected to grow at a CAGR of 17.20% from 2025-2035, influenced by various factors.
In China, the use of digital elevation models enables accurate and detailed mapping of terrain, which is vital for urban planning, disaster management, and other sectors. The increasing demand for high-quality and accurate data is driving the growth of the market.China is embracing advancements in technology like artificial intelligence, big data, and cloud computing, which are driving the demand for digital elevation models.
Australia’s market is expected to experience a CAGR of 20.20% from 2025-2035, influenced by various factors.
The market in Australia is intensifying at a speedy pace due to a multitude of driving factors. This plays a major role in mitigation as it offers accurate information on the elevation of specific sectors.
The arrival of simulated and augmented reality applications has formulated new growth factors that can produce 3D models, which are utilized for multiple applications.
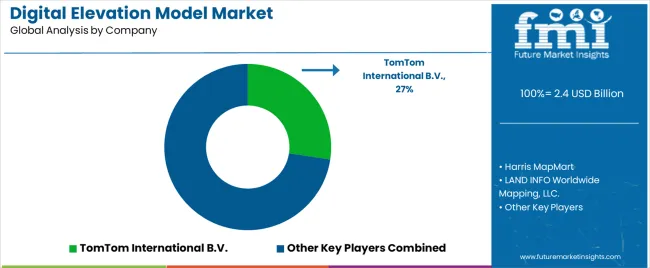
The digital elevation model market is highly competitive, with multiple key players competing to enlarge the significant market share.
The market players are those who are majorly active and are focusing on the development of advanced technologies to cater to rising the popularity of 3D mapping applications, digital elevation models, and autonomous driving systems.
The industries are investing largely in research and development to grow their product offerings and expand their geographical presence.
Here are mentioning the serval of protuberant players are Airbus Defence and Space, Harris MapMart, Inc., TomTom NV, DHI GRAS A/S, Harris Geospatial Solutions, Inc., Telespazio S.p.A, Landiscor Aerial Information, and The Sanborn Map Company, Inc.
Airbus Defence and Space, a leading market player in the digital elevation model market, has recently launched a new product, OneAtlas 3D, which offers high-quality 3D data for various applications, including urban planning, infrastructure monitoring, and disaster management.
The company is also focusing on expanding its product portfolio to provide advanced and accurate 3D data solutions to its customers.
TomTom NV, another key player in the market, has recently launched a new product, TomTom RoadCheck, which provides high-quality road data for autonomous driving systems. The company is also investing in AI-based technologies to enhance its product offerings and cater to the growing demand for digital elevation models.
CATUAV is a company based in Spain that specializes in the design, development, and operation of unmanned aerial systems for a variety of industries. includes solutions for agriculture, construction, environmental monitoring, and more. Their expertise in aerial data collection and analysis has made them a trusted partner for clients worldwide.
The global digital elevation model market is estimated to be valued at USD 2.4 billion in 2025.
The market size for the digital elevation model market is projected to reach USD 10.3 billion by 2035.
The digital elevation model market is expected to grow at a 15.9% CAGR between 2025 and 2035.
The key product types in digital elevation model market are digital elevation model software, digital elevation model services, rendering 3-d visualization, dem maps in 2d or 3d cad, building layouts and relief maps, rectification of satellite images and aerial photograph and drainage and sight analysis.
In terms of application, hydrological modelling and bathymetric analysis segment to command 20.0% share in the digital elevation model market in 2025.


Full Research Suite comprises of:
Market outlook & trends analysis
Interviews & case studies
Strategic recommendations
Vendor profiles & capabilities analysis
5-year forecasts
8 regions and 60+ country-level data splits
Market segment data splits
12 months of continuous data updates
DELIVERED AS:
PDF EXCEL ONLINE
Digital Health Market Forecast and Outlook 2025 to 2035
Digital Pen Market Forecast and Outlook 2025 to 2035
Digital X-ray Market Size and Share Forecast Outlook 2025 to 2035
Digital Pump Controller Market Size and Share Forecast Outlook 2025 to 2035
Digital Textile Printing Market Size and Share Forecast Outlook 2025 to 2035
Digital Printing Paper Market Size and Share Forecast Outlook 2025 to 2035
Digital Battlefield Market Size and Share Forecast Outlook 2025 to 2035
Digital Product Passport Software Market Size and Share Forecast Outlook 2025 to 2035
Digital Lending Platform Market Size and Share Forecast Outlook 2025 to 2035
Digital Shipyard Market Size and Share Forecast Outlook 2025 to 2035
Digital Freight Matching Market Size and Share Forecast Outlook 2025 to 2035
Digital Textile Printer Market Size and Share Forecast Outlook 2025 to 2035
Digital Thermo Anemometer Market Size and Share Forecast Outlook 2025 to 2035
Digital Twins Technologies Market Size and Share Forecast Outlook 2025 to 2035
Digital Servo Motors and Drives Market Size and Share Forecast Outlook 2025 to 2035
Digital Signature Market Size and Share Forecast Outlook 2025 to 2035
Digital Map Market Size and Share Forecast Outlook 2025 to 2035
Digital Credential Management Software Market Size and Share Forecast Outlook 2025 to 2035
Digital Therapeutics and Wellness Market Size and Share Forecast Outlook 2025 to 2035
Digital Twin In Logistics Market Size and Share Forecast Outlook 2025 to 2035

Thank you!
You will receive an email from our Business Development Manager. Please be sure to check your SPAM/JUNK folder too.
Chat With
MaRIA