- Global Locations -
Headquarters
Future Market Insights, Inc.
Christiana Corporate, 200 Continental Drive, Suite 401, Newark, Delaware - 19713, United States
T: +1-845-579-5705
Americas
Future Market Insights, Inc.
616 Corporate Way, Suite 2-9018,
Valley Cottage, NY 10989,
United States
T: +1-347-918-3531
MEA
Future Market Insights

1602-6 Jumeirah Bay X2 Tower, Plot No: JLT-PH2-X2A,

Jumeirah Lakes Towers, Dubai,

United Arab Emirates

Europe
Future Market Insights
3rd Floor, 207 Regent Street,
London W1B 3HH
United Kingdom
T: + 44 (0) 20 8123 9659
D: +44 (0) 20 3287 4268
Asia Pacific
Future Market Insights Global & Consulting Pvt. Ltd.
Office No. 401-A, 4th Floor,
VANTAGE 9, S.No. 36/1/1,
Baner, Pune 411045 India

Digital Readout (DRO) System Market

Digital Readout (DRO) System Market By Type (2-Axis, 3-Axis, 4-Axis and Others), By Product Application (Manual Lathe, Milling Machine, Boring, Grinding Machine, CNC Machine and Measuring Instruments), By End-Use Industry (Automotive, Electronics Industry, Manufacturing, Shipping Industry and Others) & Regional Forecast till 2033

FMI Digs Deep into How Digital Readout Systems are accurately show the position of the Cutting tool during machining. Read the Report to Find Investment Opportunities in the Industry.

Request Sample

Digital Readout (DRO) Market Outlook (2023 to 2033)

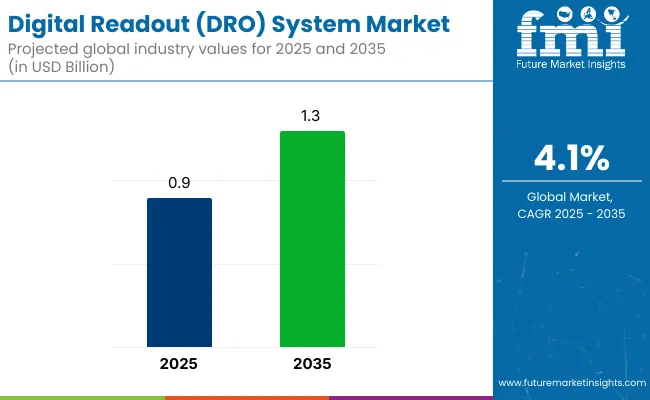
The Global Digital Readout (DRO) market size reached US$ 770.5 million in 2018, according to the latest market study by Future Market Insights. Worldwide demand for Digital Readout (DRO) systems recorded Y-o-Y growth of 4.1% in 2022, and thus, the market is expected to reach US$ 863.4 million in 2023. Over the assessment period (2023 to 2033), Global Digital Readout system sales are projected to record 6.2% CAGR and reach to a market size of US$ 1,575.6 million by 2033-end. The market for Digital Readout (DRO) Systems, which are advanced measurement tools used to monitor machine tool movements, is projected to experience significant growth in the coming years due to increasing demand for precise manufacturing processes across various industries.

The demand for DRO systems is set to rise as manufacturing embraces digitalization and Industry 4.0 principles. With a focus on process optimization, productivity enhancement, and quality control, businesses recognize the advantageous features provided by DRO systems, driving their adoption in the industry.

Other Drivers Propelling the Demand for Digital Readout (DRO) include:

  • The ability of DRO systems to complete applications faster and with greater accuracy is indeed a driver for their adoption. By eliminating the need for manual calculations and measurements, DRO systems reduce human error and increase productivity.
  • Many companies choose to retrofit their existing machine tools instead of investing in new equipment. Retrofitting with DRO systems allows manufacturers to enhance the functionality and performance of older machines, improving accuracy and productivity.
  • DRO systems incorporate advanced data analysis capabilities. They can collect and analyze data on machining operations, including position, velocity, and tool usage.
  • Common issues that lead machinists to purchase a DRO unit are misreading the hand wheel dials, losing count of the wheel rotations, and the nuisance of switching from metric to imperial, which is easily done with a DRO.

Challenges for Companies /Manufacturers in the Digital Readout (DRO) Market:

  • The high initial cost of Digital Readout System is a key obstacle for small and medium-sized enterprises, restricting market growth.
  • Different industries and applications have specific requirements when it comes to DRO systems. Manufacturers face the challenge of meeting diverse customer demands for their specific needs. This may involve adapting DRO systems for specific machines, integrating with other equipment or software, or accommodating specialized measurement needs.
  • The complexity of DRO System installation and maintenance requires skilled professionals, which is a challenge for companies operating in regions with a shortage of skilled labor.

Opportunities in the Digital Readout (DRO) Industry

  • Industries such as aerospace, defense, medical, and electronics are increasingly adopting DRO technology to achieve higher precision and efficiency. Manufacturers can seize these opportunities by targeting these specific sectors and geographical regions with tailored solutions and localized support.
  • The Digital Readout industry continues to witness technological advancements, such as the integration of wireless connectivity, cloud-based data storage and analysis, and advanced user interfaces.
  • The rise of industrial automation, Industry 4.0 and the integration of digital technologies in manufacturing processes are driving the demand for DRO systems.

Latest Trends in the Digital Readout (DRO) Market:

  • The use of Digital Readouts (DRO) in novel applications such as medical facilities and laboratories.
  • The adoption of wireless connectivity in DRO systems is on the rise. Wireless technologies such as Bluetooth and Wi-Fi enable operators to remotely access and control DRO systems from a distance.
  • DRO systems are increasingly being integrated with advanced manufacturing technologies such as Computer Numerical Control (CNC), robotics, and additive manufacturing.
Attributes Details

Digital Readout (DRO) Market Size (2023)

US$ 863.4 million

Digital Readout (DRO) Market Projected Size (2033)

US$ 1,575.6 million

Value CAGR (2023 to 2033)

6.2%

Don't pay for what you don't need

Customize your report by selecting specific countries or regions and save 30%!

2018 to 2022 Digital Readout (DRO) Demand Outlook Compared to 2023 to 2033 Forecast

From 2018 to 2022, the Global Digital Readout (DRO) market experienced a CAGR of 4.1%, reaching a market size of US$ 863.5million in 2023.

From 2018 to 2022, the Global Digital Readout (DRO) industry witnessed steady growth due to the rising demand of Digitalization and industry 4.0. The increasing focus on precision, efficiency and automation in manufacturing process, by advancements of DRO technology has to contribute to the adoption of these system by machine shops and automotive industry.

Future Forecast for Digital Readout (DRO) Industry

Looking ahead, the Global Digital Readout (DRO) industry is expected to rise at a CAGR of 6.2% from 2023 to 2033. During the forecast period, the market size is expected to reach US$ 1,575.6 million.

The Digital Readout (DRO) industry is expected to continue its growth trajectory from 2023 to 2033, the development of the manufacturing industries, especially in automotive, aerospace and electronics industry is the demand for advances machining equipment and tools. The increasing adoption of digitalization and Industry 4.0 concepts in manufacturing is expected to further the demand for DRO systems. As businesses aim to optimize their processes, improve productivity, and enhance quality control, the benefits offered by DRO systems.

The market is also likely to witness significant growth in the Asia Pacific region and Eastern Africa due to the presence of significantly developing economies. However, market growth may be hindered by the emergence of alternative technologies and the high installation and maintenance costs associated with Digital Readout (DRO) System.

Nikhil Kaitwade
Nikhil Kaitwade
Principal Consultant
LinkedIn
Talk to Analyst

Find your sweet spots for generating winning opportunities in this market.

Comparative View of the Digital Readout (DRO) Market

Digital Readout (DRO)Market:

Attributes Digital Readout (DRO)Market

CAGR (2023 to 2033)

6.2%

Market Value (2033)

US$ 1,575.6 million

Opportunity

The Digital Readout industry continues to witness technological advancements, such as the integration of wireless connectivity, cloud-based data storage and analysis, and advanced user interfaces.

Key Trends

The use of Digital Readouts (DRO) in novel applications such as medical facilities and laboratories is a unique trend in the market.

Large Industrial Displays Market:

Attributes Large Industrial Displays Market

CAGR (2023 to 2033)

6.4%

Market Value (2033)

US$ 5.2 billion

Opportunity

Increasing implementation of large industrial displays in various end use industries to augment the growth of the Sulphur recovery technology market.

Key Trends

Touchscreen technology is gaining significant traction in the large industrial displays market. Touch-enabled displays allow for intuitive and interactive user interfaces, facilitating easy navigation and control of industrial processes and applications

General Purpose Electronic Test and Measurement Instrument Market:

Attributes General Purpose Electronic Test and Measurement Instrument Market

CAGR (2023 to 2033)

9.7%

Market Value (2033)

US$ 20.8 billion

Opportunity

The growing acceptance of IoT devices, the introduction of 5G technology and the deployment of 4G networks are expected to create multiple prospects in the testing and measurement equipment industry opportunities.

Key Trends

Increased modular T&M equipment utilization is trending in the market.

Country-Wise Insights

The United States is experiencing a surge in the digital readout (DRO) market as the manufacturing sector increasingly adopts advanced technologies.

Country Market Size (US$ million) by End of Forecast Period (2033)

The United States

US$ 174.9 million

Country CAGR % 2023 to End of Forecast (2033)

The United States

6.3%

The Unites States Digital Readout (DRO) system market, as detailed in the report by Future Market Insights, generated sales amounting to US$ 76.9 million in 2018. The market observed a 4.1% year-on-year growth in 2022 and is estimated to reach US$ 94.9 million in 2023. Over the assessment period from 2023 to 2033, the United States market is projected to expand at a compound annual growth rate (CAGR) of 6.3%, culminating in a market size of US$ 174.9 million by the end of 2033.

In the United States the Digital Readout (DRO) industry is expected to witness growth due to increasing focus of the users on reducing manual calculations and minimizing human errors, DRO systems enable faster and more accurate machining processes, resulting in increased productivity and output.

As a Key Player in Precision Engineering and High-Quality Manufacturing, Demand for DRO Systems in Germany is rising.

Country Market Size (US$ million) by End of Forecast Period (2033)

Germany

US$ 242.7 million

Country CAGR % 2023 to End of Forecast (2033)

Germany

5.8%

According to Future Market Insights, the Germany Digital Readout (DRO) system market reached US$ 242.7 million in 2018. Worldwide demand for Digital Readout (DRO) systems saw a 4.1% year-on-year growth in 2022, suggesting an expansion of the market to US$ 138.1 million in 2023. Projections for the period between 2023 and 2033 indicate a 5.8% compound annual growth rate (CAGR) for Germany Digital Readout (DRO) system sales.

Germany's manufacturing sector, which spans automotive, aerospace, medical devices, electronics, and other industries, relies heavily on precise measurements and machining processes. DRO systems offer a critical solution to ensure accuracy, efficiency, and quality in these precision-driven operations.

German manufacturers understand the importance of precise positioning and measurements in machining, turning, milling, and grinding processes. DRO systems provide real-time measurement feedback, enabling operators to achieve tight tolerances and maintain consistent quality throughout the manufacturing process.

Notable Growth Expected in Digital Readout (DRO) Market as Japan Focuses on advanced manufacturing technologies and automation contributes to the demand for DRO systems.

Country Market Size (US$ million) by End of Forecast Period (2033)

Japan

US$ 73.7 million

Country CAGR % 2023 to End of Forecast (2033)

Japan

5.5%

According to Future Market Insights, the Digital Readout (DRO) system market in Japan reached US$ 35.1 million in 2018. Demand for Digital Readout (DRO) systems saw a 4.2% year-on-year growth in 2022, suggesting an expansion of the Japan market to US$ 73.7 million in 2023. Projections for the period between 2023 and 2033 indicate a 5.5% compound annual growth rate (CAGR) for Digital Readout (DRO) system sales in the region, resulting in a market size of US$ 73.7 million by the end of 2033.

Key driver of the DRO market in Japan is the country's continuous pursuit of advanced manufacturing technologies. Japanese industries, including automotive, electronics, robotics, and aerospace, are known for their cutting-edge production processes. These industries adopted the state-of-the-art manufacturing technologies such as Computer Numerical Control (CNC), robotics, and smart factories, the need for precise measurement and control became paramount.

Get the data you need at a Fraction of the cost

Personalize your report by choosing insights you need
and save 40%!

Category-Wise Insights

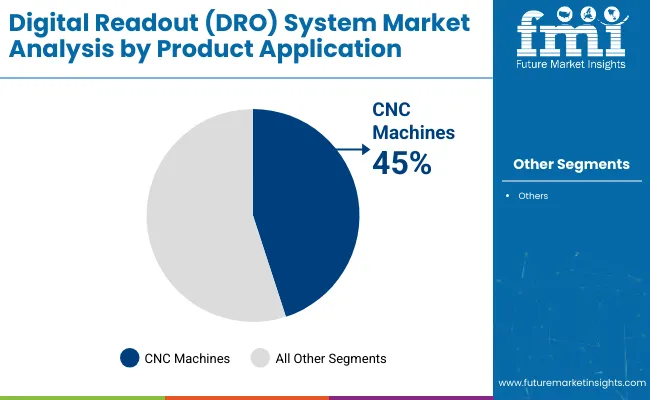
The CNC machine segment is expected to exhibit a dominant position in the Digital Readout (DRO) industry, with a projected Compound Annual Growth Rate (CAGR) of 6.8% through 2033.

The CNC Machine segment is expected to dominate the Digital Readout (DRO) industry with a CAGR of 6.8% from 2022 to 2033. This segment captures a significant market share in 2023 due to its cost-effectiveness, high efficiency, and low maintenance requirements.

CNC (Computer Numerical Control) machines, which include CNC milling machines, lathes, grinders and other automated machining tools are widely used in various industries for precision manufacturing. DRO systems provide precise measurements, position feedback and digital displays, enhancing the accuracy and efficiency of CNC machines. The increasing adoption of CNC machines in industries such as automotive, aerospace, electronics and general manufacturing is a significant driver for the growth of the DRO industry. As CNC machines become more prevalent, the demand for DRO systems to accompany these machines is expected to rise.

How Key Players Stay Competitive in the Digital Readout (DRO) Industry?

The Digital Readout (DRO) industry is highly competitive, with numerous players vying for market share. In such a scenario, key players must adopt effective strategies to stay ahead of the competition.

Key Strategies Adopted by the Players

  • Product Innovation

Companies invest hugely in research and development to introduce innovative products that offer enhanced efficiency, reliability, and cost-effectiveness. Product innovation enables companies to differentiate themselves from their competitors and cater to the evolving needs of customers.

  • Strategic Partnerships and Collaborations

Key players in the industry often form strategic partnerships and collaborations with other companies to leverage their strengths and expand their reach in the market. Such collaborations also allow companies to gain access to new technologies and markets.

  • Expansion into Emerging Markets

The Digital Readout (DRO) industry is witnessing significant growth in emerging markets such as China and India. Key players are expanding their presence in these markets by establishing local manufacturing facilities and strengthening their distribution networks.

  • Mergers and Acquisitions

Key players in the Digital Readout (DRO) industry often engage in mergers and acquisitions to consolidate their market position, expand their product portfolio, and gain access to new markets.

Key Players in the Digital Readout (DRO) Industry

  • Heidenhain
  • Newall Measurement Systems
  • Mitutoyo
  • Fagor Automation
  • DRO PROS
  • Electronica Mechatronic Systems

Key Developments in the Digital Readout (DRO) Market:

  • Newall has introduced an innovative feature called Tool Datum Memory for turning applications on the DP700 DRO (Digital Readout). This development is based on customer feedback and aims to enhance the use of tool offsets during turning operations, particularly when utilizing quick-change or turret style tool posts.
  • In 2022, Fagor Automation, a renowned provider of automation systems and solutions, has announced a collaboration with APLOS CNC Machine Tool Manufacturing, a leading manufacturer of CNC machine tools. This collaboration signifies a significant development in the industry.

Segmentation Analysis of the Digital Readout (DRO) Market

By Type:

  • 2-Axis
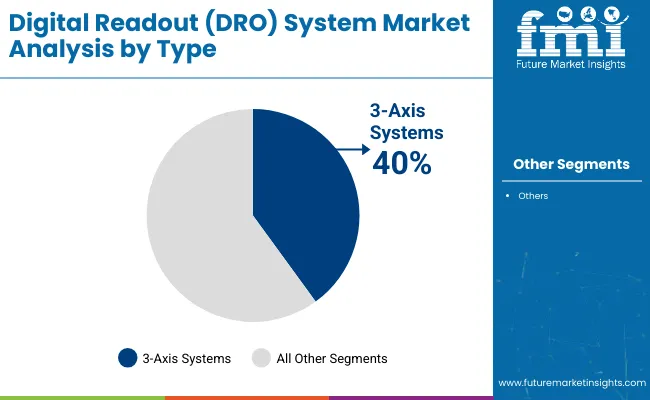
  • 3-Axis
  • 4-Axis
  • Others

By Product Application:

  • Manual Lathe
  • Milling Machine
  • Boring
  • Grinding Machine
  • CNC Machine
  • Measuring Instruments

By End-Use Industry:

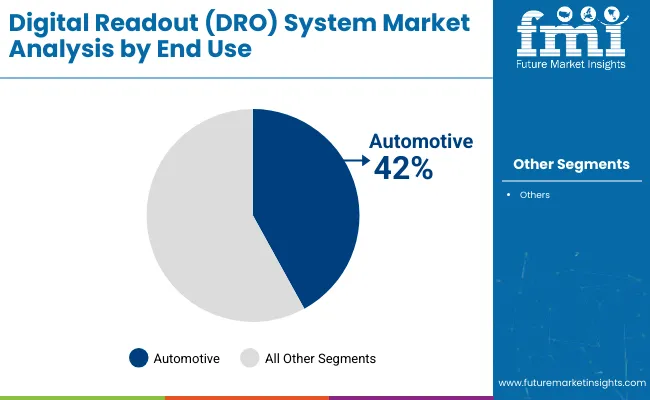
  • Automotive
  • Electronics Industry
  • Manufacturing
  • Shipping Industry
  • others

By Region:

  • North America
  • Latin America
  • Western Europe
  • Eastern Europe
  • East Asia
  • South Asia & Pacific
  • The Middle East & Africa

Frequently Asked Questions

The United States, Japan, and Germany dominate the global market.

The market is forecast to register a CAGR of 6.2% through 2033.

From 2018 to 2022, the market record a CAGR of 4.1%.

Novel applications and advanced manufacturing technologies disrupts the current market trends.

The global market size is to reach US$ 1,575.6 million by 2033.

Table of Content

1. Executive Summary

    1.1. Global Market Outlook

    1.2. Demand Side Trends

    1.3. Supply Side Trends

    1.4. Technology Roadmap

    1.5. Analysis and Recommendations

2. Market Overview

    2.1. Market Coverage / Taxonomy

    2.2. Market Definition / Scope / Limitations

3. Key Market Trends

    3.1. Key Trends Impacting the Market

    3.2. Product Innovation / Development Trends

4. Key Success Factors

    4.1. Product Adoption / Usage Analysis

    4.2. Product USPs / Features

    4.3. Strategic Promotional Strategies

5. Global Market Demand Analysis 2018 to 2022 and Forecast, 2023 to 2033

    5.1. Historical Market Volume (Units) Analysis, 2018 to 2022

    5.2. Current and Future Market Volume (Units) Projections, 2023 to 2033

    5.3. Y-o-Y Growth Trend Analysis

6. Global Market - Pricing Analysis

    6.1. Regional Pricing Analysis By Type

    6.2. Global Average Pricing Analysis Benchmark

7. Global Market Demand (in Value or Size in US$ Million) Analysis 2018 to 2022 and Forecast, 2023 to 2033

    7.1. Historical Market Value (US$ Million) Analysis, 2018 to 2022

    7.2. Current and Future Market Value (US$ Million) Projections, 2023 to 2033

        7.2.1. Y-o-Y Growth Trend Analysis

        7.2.2. Absolute $ Opportunity Analysis

8. Market Background

    8.1. Macro-Economic Factors

        8.1.1. Global GDP Growth Outlook

        8.1.2. Global Industrial industry Overview

        8.1.3. Manufacturing Value-Added

        8.1.4. Industry Value Added

        8.1.5. Parent Market Outlook

        8.1.6. Other Macro-Economic Factors

    8.2. Forecast Factors - Relevance & Impact

        8.2.1. Top Companies Historical Growth

        8.2.2. GDP Growth forecast

        8.2.3. Manufacturing Industry forecast

        8.2.4. Global Urbanization Growth Outlook

        8.2.5. Business Climate

        8.2.6. Covid-19 Impact Assessment

        8.2.7. End-use Industry Growth Outlook

    8.3. Value Chain

        8.3.1. Product Manufacturers

        8.3.2. End Users

        8.3.3. Avg. Profitability Margins

    8.4. COVID-19 Crisis – Impact Assessment

        8.4.1. Current Statistics

        8.4.2. Short-Mid-Long Term Outlook

        8.4.3. Likely Rebound

    8.5. Market Dynamics

        8.5.1. Drivers

        8.5.2. Restraints

        8.5.3. Opportunity Analysis

    8.6. Global Supply Demand Analysis

    8.7. Key Regulations & Certifications

    8.8. Production Process Overview

    8.9. Trade Scenario

9. Global Market Analysis 2018 to 2022 and Forecast 2023 to 2033, By Type 

    9.1. Introduction / Key Findings

    9.2. Historical Market Size (US$ Million) and Volume Analysis By Type, 2018 to 2022

    9.3. Current and Future Market Size (US$ Million) and Volume Analysis and Forecast By Type, 2023 to 2033

        9.3.1. 2-Axis

        9.3.2. 3-Axis

        9.3.3. 4-Axis

        9.3.4. Others

    9.4. Market Attractiveness Analysis By Type

10. Global Market Analysis 2018 to 2022 and Forecast 2023 to 2033, By Product Application

    10.1. Introduction / Key Findings

    10.2. Historical Market Size (US$ Million) and Volume Analysis By Product Application, 2018 to 2022

    10.3. Current and Future Market Size (US$ Million) and Volume Analysis and Forecast By Product Application, 2023 to 2033

        10.3.1. Manual Lathe

        10.3.2. Milling Machine

        10.3.3. Boring

        10.3.4. Grinding Machine

        10.3.5. CNC Machine

        10.3.6. Measuring Instruments

    10.4. Market Attractiveness Analysis By Product Application

11. Global Market Analysis 2018 to 2022 and Forecast 2023 to 2033, By End-Use Industry

    11.1. Introduction / Key Findings

    11.2. Historical Market Size (US$ Million) and Volume Analysis By End-Use Industry, 2018 to 2022

    11.3. Current and Future Market Size (US$ Million) and Volume Analysis and Forecast By End-Use Industry, 2023 to 2033

        11.3.1. Automotive

        11.3.2. Electronics Industry

        11.3.3. Manufacturing

        11.3.4. Shipping Industry

        11.3.5. Others

    11.4. Market Attractiveness Analysis By End-Use Industry

12. Global Market Analysis 2018 to 2022 and Forecast 2023 to 2033, by Region

    12.1. Introduction

    12.2. Historical Market Size (US$ Million) and Volume Analysis By Region, 2018 to 2022

    12.3. Current Market Size (US$ Million) and Volume Analysis and Forecast By Region, 2023 to 2033

        12.3.1. North America

        12.3.2. Latin America

        12.3.3. Western Europe

        12.3.4. Eastern Europe

        12.3.5. Central Asia

        12.3.6. Russia & Belarus

        12.3.7. Balkan & Baltic Countries

        12.3.8. Middle East and Africa (MEA)

        12.3.9. East Asia

        12.3.10. South Asia and Pacific

    12.4. Market Attractiveness Analysis By Region

13. North America Market Analysis 2018 to 2022 and Forecast 2023 to 2033

    13.1. Introduction

    13.2. Pricing Analysis

    13.3. Historical Market Size (US$ Million) and Volume Trend Analysis By Market Taxonomy, 2018 to 2022

    13.4. Market Size (US$ Million) and Volume Forecast By Market Taxonomy, 2023 to 2033

        13.4.1. By Country

            13.4.1.1. U.S.

            13.4.1.2. Canada

        13.4.2. By Type

        13.4.3. By Product Application

        13.4.4. By End-Use Industry

    13.5. Market Attractiveness Analysis

        13.5.1. By Country

        13.5.2. By Type

        13.5.3. By Product Application

        13.5.4. By End-Use Industry

    13.6. Market Trends

    13.7. Key Market Participants - Intensity Mapping

    13.8. Drivers and Restraints - Impact Analysis

14. Latin America Market Analysis 2018 to 2022 and Forecast 2023 to 2033

    14.1. Introduction

    14.2. Pricing Analysis

    14.3. Historical Market Size (US$ Million) and Volume Trend Analysis By Market Taxonomy, 2018 to 2022

    14.4. Market Size (US$ Million) and Volume Forecast By Market Taxonomy, 2023 to 2033

        14.4.1. By Country

            14.4.1.1. Brazil

            14.4.1.2. Mexico

            14.4.1.3. Argentina

            14.4.1.4. Rest of Latin America

        14.4.2. By Type

        14.4.3. By Product Application

        14.4.4. By End-Use Industry

    14.5. Market Attractiveness Analysis

        14.5.1. By Country

        14.5.2. By Type

        14.5.3. By Product Application

        14.5.4. By End-Use Industry

    14.6. Market Trends

    14.7. Key Market Participants - Intensity Mapping

    14.8. Drivers and Restraints - Impact Analysis

15. Western Europe Market Analysis 2018 to 2022 and Forecast 2023 to 2033

    15.1. Introduction

    15.2. Pricing Analysis

    15.3. Historical Market Size (US$ Million) and Volume Trend Analysis By Market Taxonomy, 2018 to 2022

    15.4. Market Size (US$ Million) and Volume Forecast By Market Taxonomy, 2023 to 2033

        15.4.1. By Country

            15.4.1.1. Germany

            15.4.1.2. Italy

            15.4.1.3. France

            15.4.1.4. U.K.

            15.4.1.5. Spain

            15.4.1.6. BENELUX

            15.4.1.7. NORDICS

            15.4.1.8. Rest of Western Europe

        15.4.2. By Type

        15.4.3. By Product Application

        15.4.4. By End-Use Industry

    15.5. Market Attractiveness Analysis

        15.5.1. By Country

        15.5.2. By Type

        15.5.3. By Product Application

        15.5.4. By End-Use Industry

    15.6. Market Trends

    15.7. Key Market Participants - Intensity Mapping

    15.8. Drivers and Restraints - Impact Analysis

16. Eastern Europe Market Analysis 2018 to 2022 and Forecast 2023 to 2033

    16.1. Introduction

    16.2. Pricing Analysis

    16.3. Historical Market Size (US$ Million) and Volume Trend Analysis By Market Taxonomy, 2018 to 2022

    16.4. Market Size (US$ Million) and Volume Forecast By Market Taxonomy, 2023 to 2033

        16.4.1. By Country

            16.4.1.1. Poland

            16.4.1.2. Hungary

            16.4.1.3. Romania

            16.4.1.4. Czech Republic

            16.4.1.5. Rest of Eastern Europe

        16.4.2. By Type

        16.4.3. By Product Application

        16.4.4. By End-Use Industry

    16.5. Market Attractiveness Analysis

        16.5.1. By Country

        16.5.2. By Type

        16.5.3. By Product Application

        16.5.4. By End-Use Industry

    16.6. Market Trends

    16.7. Key Market Participants - Intensity Mapping

    16.8. Drivers and Restraints - Impact Analysis

17. Central Asia Market Analysis 2018 to 2022 and Forecast 2023 to 2033

    17.1. Introduction

    17.2. Pricing Analysis

    17.3. Historical Market Size (US$ Million) and Volume Trend Analysis By Market Taxonomy, 2018 to 2022

    17.4. Market Size (US$ Million) and Volume Forecast By Market Taxonomy, 2023 to 2033

        17.4.1. By Type

        17.4.2. By Product Application

        17.4.3. By End-Use Industry

    17.5. Market Attractiveness Analysis

        17.5.1. By Type

        17.5.2. By Product Application

        17.5.3. By End-Use Industry

    17.6. Market Trends

    17.7. Key Market Participants - Intensity Mapping

    17.8. Drivers and Restraints - Impact Analysis

18. Russia & Belarus Market Analysis 2018 to 2022 and Forecast 2023 to 2033

    18.1. Introduction

    18.2. Pricing Analysis

    18.3. Historical Market Size (US$ Million) and Volume Trend Analysis By Market Taxonomy, 2018 to 2022

    18.4. Market Size (US$ Million) and Volume Forecast By Market Taxonomy, 2023 to 2033

        18.4.1. By Type

        18.4.2. By Product Application

        18.4.3. By End-Use Industry

    18.5. Market Attractiveness Analysis

        18.5.1. By Type

        18.5.2. By Product Application

        18.5.3. By End-Use Industry

    18.6. Market Trends

    18.7. Key Market Participants - Intensity Mapping

    18.8. Drivers and Restraints - Impact Analysis

19. Balkan & Baltic Countries Market Analysis 2018 to 2022 and Forecast 2023 to 2033

    19.1. Introduction

    19.2. Pricing Analysis

    19.3. Historical Market Size (US$ Million) and Volume Trend Analysis By Market Taxonomy, 2018 to 2022

    19.4. Market Size (US$ Million) and Volume Forecast By Market Taxonomy, 2023 to 2033

        19.4.1. By Type

        19.4.2. By Product Application

        19.4.3. By End-Use Industry

    19.5. Market Attractiveness Analysis

        19.5.1. By Type

        19.5.2. By Product Application

        19.5.3. By End-Use Industry

    19.6. Market Trends

    19.7. Key Market Participants - Intensity Mapping

    19.8. Drivers and Restraints - Impact Analysis

20. South Asia and Pacific Market Analysis 2018 to 2022 and Forecast 2023 to 2033

    20.1. Introduction

    20.2. Pricing Analysis

    20.3. Historical Market Size (US$ Million) and Volume Trend Analysis By Market Taxonomy, 2018 to 2022

    20.4. Market Size (US$ Million) and Volume Forecast By Market Taxonomy, 2023 to 2033

        20.4.1. By Country

            20.4.1.1. India

            20.4.1.2. ASEAN

            20.4.1.3. Oceania

            20.4.1.4. Rest of South Asia & Pacific

        20.4.2. By Type

        20.4.3. By Product Application

        20.4.4. By End-Use Industry

    20.5. Market Attractiveness Analysis

        20.5.1. By Country

        20.5.2. By Type

        20.5.3. By Product Application

        20.5.4. By End-Use Industry

    20.6. Market Trends

    20.7. Key Market Participants - Intensity Mapping

    20.8. Drivers and Restraints - Impact Analysis

21. East Asia Market Analysis 2018 to 2022 and Forecast 2023 to 2033

    21.1. Introduction

    21.2. Pricing Analysis

    21.3. Historical Market Size (US$ Million) and Volume Trend Analysis By Market Taxonomy, 2018 to 2022

    21.4. Market Size (US$ Million) and Volume Forecast By Market Taxonomy, 2023 to 2033

        21.4.1. By Country

            21.4.1.1. China

            21.4.1.2. Japan

            21.4.1.3. South Korea

        21.4.2. By Type

        21.4.3. By Product Application

        21.4.4. By End-Use Industry

    21.5. Market Attractiveness Analysis

        21.5.1. By Country

        21.5.2. By Type

        21.5.3. By Product Application

        21.5.4. By End-Use Industry

    21.6. Market Trends

    21.7. Key Market Participants - Intensity Mapping

    21.8. Drivers and Restraints - Impact Analysis

22. Middle East and Africa Market Analysis 2018 to 2022 and Forecast 2023 to 2033

    22.1. Introduction

    22.2. Pricing Analysis

    22.3. Historical Market Size (US$ Million) and Volume Trend Analysis By Market Taxonomy, 2018 to 2022

    22.4. Market Size (US$ Million) and Volume Forecast By Market Taxonomy, 2023 to 2033

        22.4.1. By Country

            22.4.1.1. GCC Countries

            22.4.1.2. Türkiye

            22.4.1.3. Northern Africa

            22.4.1.4. South Africa

            22.4.1.5. Rest of Middle East and Africa

        22.4.2. By Type

        22.4.3. By Product Application

        22.4.4. By End-Use Industry

    22.5. Market Attractiveness Analysis

        22.5.1. By Country

        22.5.2. By Type

        22.5.3. By Product Application

        22.5.4. By End-Use Industry

    22.6. Market Trends

    22.7. Key Market Participants - Intensity Mapping

    22.8. Drivers and Restraints - Impact Analysis

23. Country-wise Market Analysis 

    23.1. Introduction

        23.1.1. Market Value Proportion Analysis, By Key Countries

        23.1.2. Global Vs. Country Growth Comparison

    23.2. U.S. Market Analysis

        23.2.1. By Type

        23.2.2. By Product Application

        23.2.3. By End-Use Industry

    23.3. Canada Market Analysis

        23.3.1. By Type

        23.3.2. By Product Application

        23.3.3. By End-Use Industry

    23.4. Mexico Market Analysis

        23.4.1. By Type

        23.4.2. By Product Application

        23.4.3. By End-Use Industry

    23.5. Brazil Market Analysis

        23.5.1. By Type

        23.5.2. By Product Application

        23.5.3. By End-Use Industry

    23.6. Argentina Market Analysis

        23.6.1. By Type

        23.6.2. By Product Application

        23.6.3. By End-Use Industry

    23.7. Germany Market Analysis

        23.7.1. By Type

        23.7.2. By Product Application

        23.7.3. By End-Use Industry

    23.8. Italy Market Analysis

        23.8.1. By Type

        23.8.2. By Product Application

        23.8.3. By End-Use Industry

    23.9. France Market Analysis

        23.9.1. By Type

        23.9.2. By Product Application

        23.9.3. By End-Use Industry

    23.10. U.K. Market Analysis

        23.10.1. By Type

        23.10.2. By Product Application

        23.10.3. By End-Use Industry

    23.11. Spain Market Analysis

        23.11.1. By Type

        23.11.2. By Product Application

        23.11.3. By End-Use Industry

    23.12. NORDICS Market Analysis

        23.12.1. By Type

        23.12.2. By Product Application

        23.12.3. By End-Use Industry

    23.13. Poland Market Analysis

        23.13.1. By Type

        23.13.2. By Product Application

        23.13.3. By End-Use Industry

    23.14. Hungary Market Analysis

        23.14.1. By Type

        23.14.2. By Product Application

        23.14.3. By End-Use Industry

    23.15. Romania Market Analysis

        23.15.1. By Type

        23.15.2. By Product Application

        23.15.3. By End-Use Industry

    23.16. Czech Republic Market Analysis

        23.16.1. By Type

        23.16.2. By Product Application

        23.16.3. By End-Use Industry

    23.17. China Market Analysis

        23.17.1. By Type

        23.17.2. By Product Application

        23.17.3. By End-Use Industry

    23.18. Japan Market Analysis

        23.18.1. By Type

        23.18.2. By Product Application

        23.18.3. By End-Use Industry

    23.19. S. Korea Market Analysis

        23.19.1. By Type

        23.19.2. By Product Application

        23.19.3. By End-Use Industry

    23.20. India Market Analysis

        23.20.1. By Type

        23.20.2. By Product Application

        23.20.3. By End-Use Industry

    23.21. ASEAN Market Analysis

        23.21.1. By Type

        23.21.2. By Product Application

        23.21.3. By End-Use Industry

    23.22. Australia and New Zealand Market Analysis

        23.22.1. By Type

        23.22.2. By Product Application

        23.22.3. By End-Use Industry

    23.23. KSA Market Analysis

        23.23.1. By Type

        23.23.2. By Product Application

        23.23.3. By End-Use Industry

    23.24. UAE Market Analysis

        23.24.1. By Type

        23.24.2. By Product Application

        23.24.3. By End-Use Industry

    23.25. Northern Africa Market Analysis

        23.25.1. By Type

        23.25.2. By Product Application

        23.25.3. By End-Use Industry

    23.26. Türkiye Market Analysis

        23.26.1. By Type

        23.26.2. By Product Application

        23.26.3. By End-Use Industry

    23.27. South Africa Market Analysis

        23.27.1. By Type

        23.27.2. By Product Application

        23.27.3. By End-Use Industry

    23.28. Israel Market Analysis

        23.28.1. By Type

        23.28.2. By Product Application

        23.28.3. By End-Use Industry

24. Market Structure Analysis

    24.1. Market Analysis by Tier of Companies (WXYZ)

    24.2. Market Concentration

    24.3. Market Share Analysis of Top Players

    24.4. Production Capacity Analysis

    24.5. Market Presence Analysis

        24.5.1. By End-Use Industry Footprint of Players

        24.5.2. By Regional Footprint of Players

        24.5.3. By Channel Footprint of Players

25. Competition Analysis

    25.1. Competition Dashboard

    25.2. Competition Benchmarking

    25.3. Competition Deep Dive

        25.3.1. Heidenhain

            25.3.1.1. Overview

            25.3.1.2. Product Portfolio

            25.3.1.3. Profitability by Market Segments (Product/Channel/Region)

            25.3.1.4. Sales Footprint

            25.3.1.5. Strategy Overview

        25.3.2. Newall MeasureMillionts System

            25.3.2.1. Overview

            25.3.2.2. Product Portfolio

            25.3.2.3. Profitability by Market Segments (Product/Channel/Region)

            25.3.2.4. Sales Footprint

            25.3.2.5. Strategy Overview

        25.3.3. MItutoyo

            25.3.3.1. Overview

            25.3.3.2. Product Portfolio

            25.3.3.3. Profitability by Market Segments (Product/Channel/Region)

            25.3.3.4. Sales Footprint

            25.3.3.5. Strategy Overview

        25.3.4. Fagor Automation

            25.3.4.1. Overview

            25.3.4.2. Product Portfolio

            25.3.4.3. Profitability by Market Segments (Product/Channel/Region)

            25.3.4.4. Sales Footprint

            25.3.4.5. Strategy Overview

        25.3.5. DRO PROS

            25.3.5.1. Overview

            25.3.5.2. Product Portfolio

            25.3.5.3. Profitability by Market Segments (Product/Channel/Region)

            25.3.5.4. Sales Footprint

            25.3.5.5. Strategy Overview

        25.3.6. Electronica Mechatronics

            25.3.6.1. Overview

            25.3.6.2. Product Portfolio

            25.3.6.3. Profitability by Market Segments (Product/Channel/Region)

            25.3.6.4. Sales Footprint

            25.3.6.5. Strategy Overview

26. Primary Insights

27. Assumptions and Acronyms Used

28. Research Methodology

Don't pay for what you don't need

Customize your report by selecting specific countries or regions and save 30%!

List of Tables

Table 1: Global Value (US$ Million) Forecast by Region, 2018 & 2033

Table 2: Global Volume (Tons) Forecast by Region, 2018 & 2033

Table 3: Global Value (US$ Million) Forecast by Type, 2018 & 2033

Table 4: Global Volume (Tons) Forecast by Type, 2018 & 2033

Table 5: Global Value (US$ Million) Forecast by Product Application, 2018 & 2033

Table 6: Global Volume (Tons) Forecast by Product Application, 2018 & 2033

Table 7: Global Value (US$ Million) Forecast by End-Use Industry, 2018 & 2033

Table 8: Global Volume (Tons) Forecast by End-Use Industry, 2018 & 2033

Table 9: North America Value (US$ Million) Forecast by Country, 2018 & 2033

Table 10: North America Volume (Tons) Forecast by Country, 2018 & 2033

Table 11: North America Value (US$ Million) Forecast by Type, 2018 & 2033

Table 12: North America Volume (Tons) Forecast by Type, 2018 & 2033

Table 13: North America Value (US$ Million) Forecast by Product Application, 2018 & 2033

Table 14: North America Volume (Tons) Forecast by Product Application, 2018 & 2033

Table 15: North America Value (US$ Million) Forecast by End-Use Industry, 2018 & 2033

Table 16: North America Volume (Tons) Forecast by End-Use Industry, 2018 & 2033

Table 17: Latin America Value (US$ Million) Forecast by Country, 2018 & 2033

Table 18: Latin America Volume (Tons) Forecast by Country, 2018 & 2033

Table 19: Latin America Value (US$ Million) Forecast by Type, 2018 & 2033

Table 20: Latin America Volume (Tons) Forecast by Type, 2018 & 2033

Table 21: Latin America Value (US$ Million) Forecast by Product Application, 2018 & 2033

Table 22: Latin America Volume (Tons) Forecast by Product Application, 2018 & 2033

Table 23: Latin America Value (US$ Million) Forecast by End-Use Industry, 2018 & 2033

Table 24: Latin America Volume (Tons) Forecast by End-Use Industry, 2018 & 2033

Table 25: Western Europe Value (US$ Million) Forecast by Country, 2018 & 2033

Table 26: Western Europe Volume (Tons) Forecast by Country, 2018 & 2033

Table 27: Western Europe Value (US$ Million) Forecast by Type, 2018 & 2033

Table 28: Western Europe Volume (Tons) Forecast by Type, 2018 & 2033

Table 29: Western Europe Value (US$ Million) Forecast by Product Application, 2018 & 2033

Table 30: Western Europe Volume (Tons) Forecast by Product Application, 2018 & 2033

Table 31: Western Europe Value (US$ Million) Forecast by End-Use Industry, 2018 & 2033

Table 32: Western Europe Volume (Tons) Forecast by End-Use Industry, 2018 & 2033

Table 33: Eastern Europe Value (US$ Million) Forecast by Country, 2018 & 2033

Table 34: Eastern Europe Volume (Tons) Forecast by Country, 2018 & 2033

Table 35: Eastern Europe Value (US$ Million) Forecast by Type, 2018 & 2033

Table 36: Eastern Europe Volume (Tons) Forecast by Type, 2018 & 2033

Table 37: Eastern Europe Value (US$ Million) Forecast by Product Application, 2018 & 2033

Table 38: Eastern Europe Volume (Tons) Forecast by Product Application, 2018 & 2033

Table 39: Eastern Europe Value (US$ Million) Forecast by End-Use Industry, 2018 & 2033

Table 40: Eastern Europe Volume (Tons) Forecast by End-Use Industry, 2018 & 2033

Table 41: East Asia Value (US$ Million) Forecast by Country, 2018 & 2033

Table 42: East Asia Volume (Tons) Forecast by Country, 2018 & 2033

Table 43: East Asia Value (US$ Million) Forecast by Type, 2018 & 2033

Table 44: East Asia Volume (Tons) Forecast by Type, 2018 & 2033

Table 45: East Asia Value (US$ Million) Forecast by Product Application, 2018 & 2033

Table 46: East Asia Volume (Tons) Forecast by Product Application, 2018 & 2033

Table 47: East Asia Value (US$ Million) Forecast by End-Use Industry, 2018 & 2033

Table 48: East Asia Volume (Tons) Forecast by End-Use Industry, 2018 & 2033

Table 49: South Asia Value (US$ Million) Forecast by Country, 2018 & 2033

Table 50: South Asia Volume (Tons) Forecast by Country, 2018 & 2033

Table 51: South Asia Value (US$ Million) Forecast by Type, 2018 & 2033

Table 52: South Asia Volume (Tons) Forecast by Type, 2018 & 2033

Table 53: South Asia Value (US$ Million) Forecast by Product Application, 2018 & 2033

Table 54: South Asia Volume (Tons) Forecast by Product Application, 2018 & 2033

Table 55: South Asia Value (US$ Million) Forecast by End-Use Industry, 2018 & 2033

Table 56: South Asia Volume (Tons) Forecast by End-Use Industry, 2018 & 2033

Table 57: MEA Value (US$ Million) Forecast by Country, 2018 & 2033

Table 58: MEA Volume (Tons) Forecast by Country, 2018 & 2033

Table 59: MEA Value (US$ Million) Forecast by Type, 2018 & 2033

Table 60: MEA Volume (Tons) Forecast by Type, 2018 & 2033

Table 61: MEA Value (US$ Million) Forecast by Product Application, 2018 & 2033

Table 62: MEA Volume (Tons) Forecast by Product Application, 2018 & 2033

Table 63: MEA Value (US$ Million) Forecast by End-Use Industry, 2018 & 2033

Table 64: MEA Volume (Tons) Forecast by End-Use Industry, 2018 & 2033
Nikhil Kaitwade
Nikhil Kaitwade
Principal Consultant
LinkedIn
Talk to Analyst

Find your sweet spots for generating winning opportunities in this market.

List of Charts

Figure 1: Global Value (US$ Million) by Type, 2022 & 2032

Figure 2: Global Value (US$ Million) by Product Application, 2022 & 2032

Figure 3: Global Value (US$ Million) by End-Use Industry, 2022 & 2032

Figure 4: Global Value (US$ Million) by Region, 2022 & 2032

Figure 5: Global Value (US$ Million) Analysis by Region, 2018 & 2033

Figure 6: Global Volume (Tons) Analysis by Region, 2018 & 2033

Figure 7: Global Value Share (%) and BPS Analysis by Region, 2022 & 2032

Figure 8: Global Y-o-Y Growth (%) Projections by Region, 2022 to 2032

Figure 9: Global Value (US$ Million) Analysis by Type, 2018 & 2033

Figure 10: Global Volume (Tons) Analysis by Type, 2018 & 2033

Figure 11: Global Value Share (%) and BPS Analysis by Type, 2022 & 2032

Figure 12: Global Y-o-Y Growth (%) Projections by Type, 2022 to 2032

Figure 13: Global Value (US$ Million) Analysis by Product Application, 2018 & 2033

Figure 14: Global Volume (Tons) Analysis by Product Application, 2018 & 2033

Figure 15: Global Value Share (%) and BPS Analysis by Product Application, 2022 & 2032

Figure 16: Global Y-o-Y Growth (%) Projections by Product Application, 2022 to 2032

Figure 17: Global Value (US$ Million) Analysis by End-Use Industry, 2018 & 2033

Figure 18: Global Volume (Tons) Analysis by End-Use Industry, 2018 & 2033

Figure 19: Global Value Share (%) and BPS Analysis by End-Use Industry, 2022 & 2032

Figure 20: Global Y-o-Y Growth (%) Projections by End-Use Industry, 2022 to 2032

Figure 21: Global Attractiveness by Type, 2022 to 2032

Figure 22: Global Attractiveness by Product Application, 2022 to 2032

Figure 23: Global Attractiveness by End-Use Industry, 2022 to 2032

Figure 24: Global Attractiveness by Region, 2022 to 2032

Figure 25: North America Value (US$ Million) by Type, 2022 & 2032

Figure 26: North America Value (US$ Million) by Product Application, 2022 & 2032

Figure 27: North America Value (US$ Million) by End-Use Industry, 2022 & 2032

Figure 28: North America Value (US$ Million) by Country, 2022 & 2032

Figure 29: North America Value (US$ Million) Analysis by Country, 2018 & 2033

Figure 30: North America Volume (Tons) Analysis by Country, 2018 & 2033

Figure 31: North America Value Share (%) and BPS Analysis by Country, 2022 & 2032

Figure 32: North America Y-o-Y Growth (%) Projections by Country, 2022 to 2032

Figure 33: North America Value (US$ Million) Analysis by Type, 2018 & 2033

Figure 34: North America Volume (Tons) Analysis by Type, 2018 & 2033

Figure 35: North America Value Share (%) and BPS Analysis by Type, 2022 & 2032

Figure 36: North America Y-o-Y Growth (%) Projections by Type, 2022 to 2032

Figure 37: North America Value (US$ Million) Analysis by Product Application, 2018 & 2033

Figure 38: North America Volume (Tons) Analysis by Product Application, 2018 & 2033

Figure 39: North America Value Share (%) and BPS Analysis by Product Application, 2022 & 2032

Figure 40: North America Y-o-Y Growth (%) Projections by Product Application, 2022 to 2032

Figure 41: North America Value (US$ Million) Analysis by End-Use Industry, 2018 & 2033

Figure 42: North America Volume (Tons) Analysis by End-Use Industry, 2018 & 2033

Figure 43: North America Value Share (%) and BPS Analysis by End-Use Industry, 2022 & 2032

Figure 44: North America Y-o-Y Growth (%) Projections by End-Use Industry, 2022 to 2032

Figure 45: North America Attractiveness by Type, 2022 to 2032

Figure 46: North America Attractiveness by Product Application, 2022 to 2032

Figure 47: North America Attractiveness by End-Use Industry, 2022 to 2032

Figure 48: North America Attractiveness by Country, 2022 to 2032

Figure 49: Latin America Value (US$ Million) by Type, 2022 & 2032

Figure 50: Latin America Value (US$ Million) by Product Application, 2022 & 2032

Figure 51: Latin America Value (US$ Million) by End-Use Industry, 2022 & 2032

Figure 52: Latin America Value (US$ Million) by Country, 2022 & 2032

Figure 53: Latin America Value (US$ Million) Analysis by Country, 2018 & 2033

Figure 54: Latin America Volume (Tons) Analysis by Country, 2018 & 2033

Figure 55: Latin America Value Share (%) and BPS Analysis by Country, 2022 & 2032

Figure 56: Latin America Y-o-Y Growth (%) Projections by Country, 2022 to 2032

Figure 57: Latin America Value (US$ Million) Analysis by Type, 2018 & 2033

Figure 58: Latin America Volume (Tons) Analysis by Type, 2018 & 2033

Figure 59: Latin America Value Share (%) and BPS Analysis by Type, 2022 & 2032

Figure 60: Latin America Y-o-Y Growth (%) Projections by Type, 2022 to 2032

Figure 61: Latin America Value (US$ Million) Analysis by Product Application, 2018 & 2033

Figure 62: Latin America Volume (Tons) Analysis by Product Application, 2018 & 2033

Figure 63: Latin America Value Share (%) and BPS Analysis by Product Application, 2022 & 2032

Figure 64: Latin America Y-o-Y Growth (%) Projections by Product Application, 2022 to 2032

Figure 65: Latin America Value (US$ Million) Analysis by End-Use Industry, 2018 & 2033

Figure 66: Latin America Volume (Tons) Analysis by End-Use Industry, 2018 & 2033

Figure 67: Latin America Value Share (%) and BPS Analysis by End-Use Industry, 2022 & 2032

Figure 68: Latin America Y-o-Y Growth (%) Projections by End-Use Industry, 2022 to 2032

Figure 69: Latin America Attractiveness by Type, 2022 to 2032

Figure 70: Latin America Attractiveness by Product Application, 2022 to 2032

Figure 71: Latin America Attractiveness by End-Use Industry, 2022 to 2032

Figure 72: Latin America Attractiveness by Country, 2022 to 2032

Figure 73: Western Europe Value (US$ Million) by Type, 2022 & 2032

Figure 74: Western Europe Value (US$ Million) by Product Application, 2022 & 2032

Figure 75: Western Europe Value (US$ Million) by End-Use Industry, 2022 & 2032

Figure 76: Western Europe Value (US$ Million) by Country, 2022 & 2032

Figure 77: Western Europe Value (US$ Million) Analysis by Country, 2018 & 2033

Figure 78: Western Europe Volume (Tons) Analysis by Country, 2018 & 2033

Figure 79: Western Europe Value Share (%) and BPS Analysis by Country, 2022 & 2032

Figure 80: Western Europe Y-o-Y Growth (%) Projections by Country, 2022 to 2032

Figure 81: Western Europe Value (US$ Million) Analysis by Type, 2018 & 2033

Figure 82: Western Europe Volume (Tons) Analysis by Type, 2018 & 2033

Figure 83: Western Europe Value Share (%) and BPS Analysis by Type, 2022 & 2032

Figure 84: Western Europe Y-o-Y Growth (%) Projections by Type, 2022 to 2032

Figure 85: Western Europe Value (US$ Million) Analysis by Product Application, 2018 & 2033

Figure 86: Western Europe Volume (Tons) Analysis by Product Application, 2018 & 2033

Figure 87: Western Europe Value Share (%) and BPS Analysis by Product Application, 2022 & 2032

Figure 88: Western Europe Y-o-Y Growth (%) Projections by Product Application, 2022 to 2032

Figure 89: Western Europe Value (US$ Million) Analysis by End-Use Industry, 2018 & 2033

Figure 90: Western Europe Volume (Tons) Analysis by End-Use Industry, 2018 & 2033

Figure 91: Western Europe Value Share (%) and BPS Analysis by End-Use Industry, 2022 & 2032

Figure 92: Western Europe Y-o-Y Growth (%) Projections by End-Use Industry, 2022 to 2032

Figure 93: Western Europe Attractiveness by Type, 2022 to 2032

Figure 94: Western Europe Attractiveness by Product Application, 2022 to 2032

Figure 95: Western Europe Attractiveness by End-Use Industry, 2022 to 2032

Figure 96: Western Europe Attractiveness by Country, 2022 to 2032

Figure 97: Eastern Europe Value (US$ Million) by Type, 2022 & 2032

Figure 98: Eastern Europe Value (US$ Million) by Product Application, 2022 & 2032

Figure 99: Eastern Europe Value (US$ Million) by End-Use Industry, 2022 & 2032

Figure 100: Eastern Europe Value (US$ Million) by Country, 2022 & 2032

Figure 101: Eastern Europe Value (US$ Million) Analysis by Country, 2018 & 2033

Figure 102: Eastern Europe Volume (Tons) Analysis by Country, 2018 & 2033

Figure 103: Eastern Europe Value Share (%) and BPS Analysis by Country, 2022 & 2032

Figure 104: Eastern Europe Y-o-Y Growth (%) Projections by Country, 2022 to 2032

Figure 105: Eastern Europe Value (US$ Million) Analysis by Type, 2018 & 2033

Figure 106: Eastern Europe Volume (Tons) Analysis by Type, 2018 & 2033

Figure 107: Eastern Europe Value Share (%) and BPS Analysis by Type, 2022 & 2032

Figure 108: Eastern Europe Y-o-Y Growth (%) Projections by Type, 2022 to 2032

Figure 109: Eastern Europe Value (US$ Million) Analysis by Product Application, 2018 & 2033

Figure 110: Eastern Europe Volume (Tons) Analysis by Product Application, 2018 & 2033

Figure 111: Eastern Europe Value Share (%) and BPS Analysis by Product Application, 2022 & 2032

Figure 112: Eastern Europe Y-o-Y Growth (%) Projections by Product Application, 2022 to 2032

Figure 113: Eastern Europe Value (US$ Million) Analysis by End-Use Industry, 2018 & 2033

Figure 114: Eastern Europe Volume (Tons) Analysis by End-Use Industry, 2018 & 2033

Figure 115: Eastern Europe Value Share (%) and BPS Analysis by End-Use Industry, 2022 & 2032

Figure 116: Eastern Europe Y-o-Y Growth (%) Projections by End-Use Industry, 2022 to 2032

Figure 117: Eastern Europe Attractiveness by Type, 2022 to 2032

Figure 118: Eastern Europe Attractiveness by Product Application, 2022 to 2032

Figure 119: Eastern Europe Attractiveness by End-Use Industry, 2022 to 2032

Figure 120: Eastern Europe Attractiveness by Country, 2022 to 2032

Figure 121: East Asia Value (US$ Million) by Type, 2022 & 2032

Figure 122: East Asia Value (US$ Million) by Product Application, 2022 & 2032

Figure 123: East Asia Value (US$ Million) by End-Use Industry, 2022 & 2032

Figure 124: East Asia Value (US$ Million) by Country, 2022 & 2032

Figure 125: East Asia Value (US$ Million) Analysis by Country, 2018 & 2033

Figure 126: East Asia Volume (Tons) Analysis by Country, 2018 & 2033

Figure 127: East Asia Value Share (%) and BPS Analysis by Country, 2022 & 2032

Figure 128: East Asia Y-o-Y Growth (%) Projections by Country, 2022 to 2032

Figure 129: East Asia Value (US$ Million) Analysis by Type, 2018 & 2033

Figure 130: East Asia Volume (Tons) Analysis by Type, 2018 & 2033

Figure 131: East Asia Value Share (%) and BPS Analysis by Type, 2022 & 2032

Figure 132: East Asia Y-o-Y Growth (%) Projections by Type, 2022 to 2032

Figure 133: East Asia Value (US$ Million) Analysis by Product Application, 2018 & 2033

Figure 134: East Asia Volume (Tons) Analysis by Product Application, 2018 & 2033

Figure 135: East Asia Value Share (%) and BPS Analysis by Product Application, 2022 & 2032

Figure 136: East Asia Y-o-Y Growth (%) Projections by Product Application, 2022 to 2032

Figure 137: East Asia Value (US$ Million) Analysis by End-Use Industry, 2018 & 2033

Figure 138: East Asia Volume (Tons) Analysis by End-Use Industry, 2018 & 2033

Figure 139: East Asia Value Share (%) and BPS Analysis by End-Use Industry, 2022 & 2032

Figure 140: East Asia Y-o-Y Growth (%) Projections by End-Use Industry, 2022 to 2032

Figure 141: East Asia Attractiveness by Type, 2022 to 2032

Figure 142: East Asia Attractiveness by Product Application, 2022 to 2032

Figure 143: East Asia Attractiveness by End-Use Industry, 2022 to 2032

Figure 144: East Asia Attractiveness by Country, 2022 to 2032

Figure 145: South Asia Value (US$ Million) by Type, 2022 & 2032

Figure 146: South Asia Value (US$ Million) by Product Application, 2022 & 2032

Figure 147: South Asia Value (US$ Million) by End-Use Industry, 2022 & 2032

Figure 148: South Asia Value (US$ Million) by Country, 2022 & 2032

Figure 149: South Asia Value (US$ Million) Analysis by Country, 2018 & 2033

Figure 150: South Asia Volume (Tons) Analysis by Country, 2018 & 2033

Figure 151: South Asia Value Share (%) and BPS Analysis by Country, 2022 & 2032

Figure 152: South Asia Y-o-Y Growth (%) Projections by Country, 2022 to 2032

Figure 153: South Asia Value (US$ Million) Analysis by Type, 2018 & 2033

Figure 154: South Asia Volume (Tons) Analysis by Type, 2018 & 2033

Figure 155: South Asia Value Share (%) and BPS Analysis by Type, 2022 & 2032

Figure 156: South Asia Y-o-Y Growth (%) Projections by Type, 2022 to 2032

Figure 157: South Asia Value (US$ Million) Analysis by Product Application, 2018 & 2033

Figure 158: South Asia Volume (Tons) Analysis by Product Application, 2018 & 2033

Figure 159: South Asia Value Share (%) and BPS Analysis by Product Application, 2022 & 2032

Figure 160: South Asia Y-o-Y Growth (%) Projections by Product Application, 2022 to 2032

Figure 161: South Asia Value (US$ Million) Analysis by End-Use Industry, 2018 & 2033

Figure 162: South Asia Volume (Tons) Analysis by End-Use Industry, 2018 & 2033

Figure 163: South Asia Value Share (%) and BPS Analysis by End-Use Industry, 2022 & 2032

Figure 164: South Asia Y-o-Y Growth (%) Projections by End-Use Industry, 2022 to 2032

Figure 165: South Asia Attractiveness by Type, 2022 to 2032

Figure 166: South Asia Attractiveness by Product Application, 2022 to 2032

Figure 167: South Asia Attractiveness by End-Use Industry, 2022 to 2032

Figure 168: South Asia Attractiveness by Country, 2022 to 2032

Figure 169: MEA Value (US$ Million) by Type, 2022 & 2032

Figure 170: MEA Value (US$ Million) by Product Application, 2022 & 2032

Figure 171: MEA Value (US$ Million) by End-Use Industry, 2022 & 2032

Figure 172: MEA Value (US$ Million) by Country, 2022 & 2032

Figure 173: MEA Value (US$ Million) Analysis by Country, 2018 & 2033

Figure 174: MEA Volume (Tons) Analysis by Country, 2018 & 2033

Figure 175: MEA Value Share (%) and BPS Analysis by Country, 2022 & 2032

Figure 176: MEA Y-o-Y Growth (%) Projections by Country, 2022 to 2032

Figure 177: MEA Value (US$ Million) Analysis by Type, 2018 & 2033

Figure 178: MEA Volume (Tons) Analysis by Type, 2018 & 2033

Figure 179: MEA Value Share (%) and BPS Analysis by Type, 2022 & 2032

Figure 180: MEA Y-o-Y Growth (%) Projections by Type, 2022 to 2032

Figure 181: MEA Value (US$ Million) Analysis by Product Application, 2018 & 2033

Figure 182: MEA Volume (Tons) Analysis by Product Application, 2018 & 2033

Figure 183: MEA Value Share (%) and BPS Analysis by Product Application, 2022 & 2032

Figure 184: MEA Y-o-Y Growth (%) Projections by Product Application, 2022 to 2032

Figure 185: MEA Value (US$ Million) Analysis by End-Use Industry, 2018 & 2033

Figure 186: MEA Volume (Tons) Analysis by End-Use Industry, 2018 & 2033

Figure 187: MEA Value Share (%) and BPS Analysis by End-Use Industry, 2022 & 2032

Figure 188: MEA Y-o-Y Growth (%) Projections by End-Use Industry, 2022 to 2032

Figure 189: MEA Attractiveness by Type, 2022 to 2032

Figure 190: MEA Attractiveness by Product Application, 2022 to 2032

Figure 191: MEA Attractiveness by End-Use Industry, 2022 to 2032

Explore Industrial Automation Insights

View Reports

Digital Readout (DRO) System Market

We value your privacy

We use cookies to enhance your browsing experience, serve personalized ads or content, and analyze our traffic.

By clicking "Accept All", you consent to our use of cookies. Cookie Policy