Digital Cytology Market Size and Share Forecast Outlook 2025 to 2035

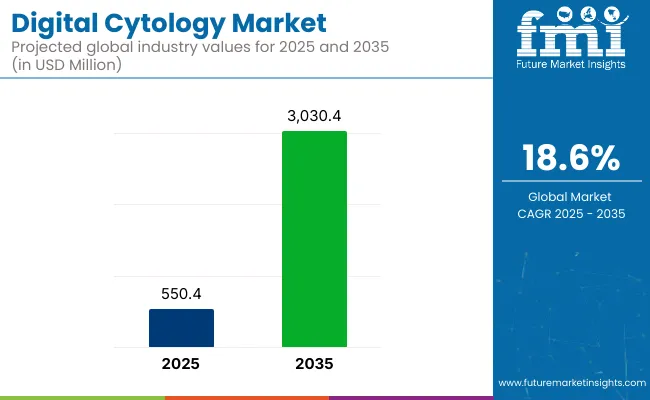
The digital cytology market is set to grow from USD 550.4 million in 2025 to USD 3,030.4 million by 2035. This significant growth reflects a CAGR of 18.6% between 2025 and 2035, driven by increasing demand for advanced diagnostic solutions in clinical and research settings. As healthcare systems around the world continue to digitize and adopt precision medicine approaches, digital cytology is emerging as a key component of modern pathology workflows.
Quick Stats for the Digital Cytology Market

  • Market Value (2025): USD 550.4 million
  • Forecast Value (2035): USD 3,030.4 million
  • Forecast CAGR: 18.6%
  • Leading Segment in 2025: Human cytology (72.0% share)
  • Key Growth Region: Asia Pacific (China 23.4% CAGR)
  • Top Key Players: Hologic, Inc., Antech Diagnostics, Inc., Techcyte, Inc., OptraScan, Wuhan Landing Intelligence Medical Co., Ltd.

Digital Cytology Market

As of 2025, the digital cytology market occupies a small but rapidly expanding share within its parent markets. In the global diagnostic imaging market, it holds an estimated 1-2%, as it complements radiology through microscopic image analysis. Within the global pathology market, digital cytology accounts for about 4-6%, driven by the shift from conventional to digital workflows.

In the digital health market, its share is around 0.5-1%, reflecting its emerging role in AI-assisted diagnostics. In the in vitro diagnostics (IVD) market, digital cytology represents approximately 2-3%, particularly in areas like automated Pap smear analysis. In the cancer diagnostics market, its contribution is about 3-5%, given its growing use in early cancer detection, especially cervical and lung cancers.

In February 2024, Hologic announced USA FDA clearance for its Genius™ Digital Diagnostics System. The first and only FDA-cleared digital cytology system integrating AI with volumetric imaging for cervical cancer screening. This system, including scanners, AI software, and image management platform, is already commercial in Europe, Australia, and New Zealand, with planned USA rollout in early 2024

Analyzing Digital Cytology Market by Top Investment Segments

Digital cytology scanners are set to lead the market due to their ability to digitize slides efficiently and support remote diagnostics. Human cytology dominates application areas, driven by rising cancer cases and the need for early, accurate screening.

Digital Cytology Scanners are expected to dominate the Component with a 35.2% Market Share in 2025

Digital cytology scanners are projected to dominate the market in 2025, accounting for 35.2% of the market share. They are the dominating segment in the market due to their critical role in transforming traditional microscopic examination into a streamlined, high-resolution digital process.

  • Growing demand for remote diagnostics and telepathology in rural and underserved areas is driving the use of digital scanners, enabling scalable, real-time collaboration among pathologists.
  • The push toward automation and data-driven diagnostics in healthcare systems is fueling the rapid adoption of digital cytology scanners.

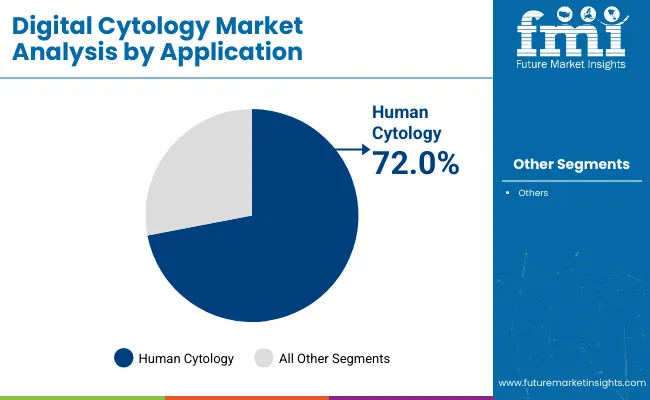
Human Cytology is Projected to Lead Applications with a 72.0% Market Share in 2025

Human cytology is projected to account for 72.0% of the digital cytology market share in 2025.It is the dominating segment in the market primarily due to the rising global burden of cancer and other chronic diseases that require regular cytological screening, such as cervical, lung, and bladder cancers.
  • The need for early and accurate diagnosis in human healthcare has driven the widespread adoption of digital cytology solutions in hospitals, diagnostic labs, and research institutions.
  • Increasing awareness about preventive healthcare and routine screening programs has significantly boosted demand for digital cytology in human healthcare application.

Digital Cytology Market Analysis By Application

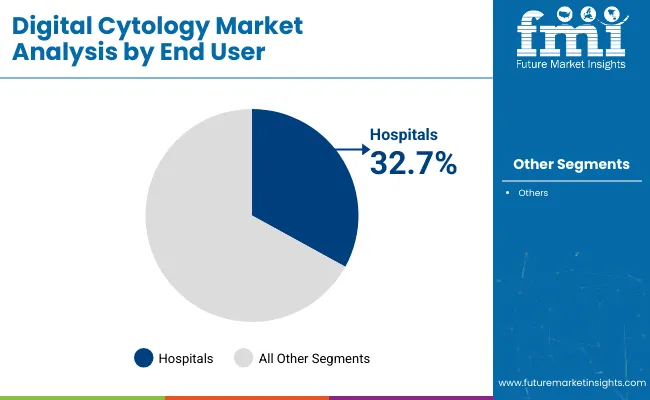
Hospitals are Expected to Lead End User with a 32.7% Share in 2025

The hospitals sales channel is projected to hold a 32.7% share of the digital cytology market in 2025.Hospitals are the dominating segment in the industry due to their central role in providing comprehensive diagnostic and treatment services to a broad patient population.
  • The growing need for rapid, accurate, and high-throughput diagnostic tools in hospital settings, particularly for cancer screening and other cytological evaluations, has accelerated the adoption of product.
  • The push for early disease detection, improved patient outcomes, and streamlined diagnostic processes further strengthens the demand for within hospitals.

Digital Cytology Market Analysis By End User

Top Digital Cytology Market Dynamics

Technological advancements and AI integration are enhancing diagnostic accuracy and enabling remote cytology analysis, addressing workforce shortages. Rising cancer prevalence and the push for early detection are driving demand for fast, reliable, and non-invasive digital cytology solutions globally.

Technological Advancements and AI Integration

One of the key dynamics driving the market is the rapid advancement in imaging technologies and the integration of artificial intelligence (AI). Modern digital cytology systems now offer high-resolution image capture, real-time analysis, and automated slide scanning, which significantly enhance diagnostic speed and accuracy. AI-powered algorithms are being increasingly used to detect abnormal cells with greater precision, reducing diagnostic errors and supporting early disease detection, particularly in cancer screening.

These technologies are also making remote diagnosis more accessible, enabling telepathology and facilitating consultations across geographical boundaries. The continuous evolution of AI in digital cytology not only improves diagnostic efficiency but also addresses the global shortage of skilled cytotechnologists and pathologists.

Rising Cancer Prevalence and Demand for Early Diagnosis

Another major market dynamic is the growing global burden of cancer and the corresponding need for early and accurate diagnostic tools. Digital cytology plays a critical role in screening for various cancers, including cervical, lung, and bladder cancer. The demand for non-invasive, fast, and reliable diagnostic methods has surged as healthcare systems emphasize early intervention to improve patient outcomes.

Additionally, awareness campaigns, government screening initiatives, and rising healthcare expenditures in both developed and emerging economies have further boosted the adoption of digital cytology. This increasing focus on preventive healthcare and timely diagnosis is pushing laboratories and hospitals to transition from traditional microscopy to more advanced, digital solutions.
Top Countries Advancing AI Diagnostics, Screening, and Workflow Automation in the Digital Cytology Market

Country Wise Analysis Of Digital Cytology Market

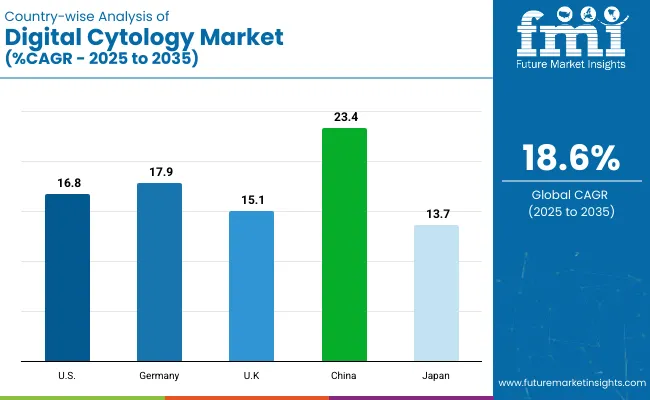
Countries Projected CAGR (2025 to 2035)
USA 16.8%
Germany 17.9%
UK 15.1%
China 23.4%
Japan 13.7%

The global market is witnessing double-digit growth driven by AI-based diagnostic automation, increasing cancer screening coverage, and the digitization of pathology labs. China is emerging as a hyper-growth market, expanding at 23.4% CAGR, fueled by centralized health infrastructure and aggressive AI adoption.

Germany (17.9%) leads in the EUs push for digital pathology regulation, while the USA (16.8%) anchors the market through early FDA clearances and reimbursement backing. The UK (15.1%) leverages NHS-funded pilots, and Japan (13.7%) demonstrates steady growth via its aging population and robotic lab integration.

Developed markets in the OECD bloc like the USA, Germany, and Japan emphasize high diagnostic accuracy, quality compliance, and patient-centric innovation. China, part of the BRICS group, is scaling through national health reforms and AI investments, reshaping cytology access for underserved regions.

The report provides insights across 40+ countries. The five below are highlighted for their strategic influence and growth trajectory.

In-depth Analysis of Digital Cytology in the United States

The USA market is growing at a 16.8% CAGR, anchored in regulatory innovation, insurance-driven adoption, and an advanced med-tech ecosystem. The country’s integration of digital cytology into cancer screening programs is backed by FDA-cleared AI solutions, reimbursement alignment through CMS, and private-sector lab digitization. As a leader among OECD nations and Agri-food Tech Pioneers, the USA benefits from a robust clinical trial ecosystem and global supplier partnerships.

  • Strong AI regulatory approvals via FDA fast-track pathways
  • Early reimbursement integration supports hospital and lab adoption
  • High-throughput labs drive demand for workflow automation

Opportunity Analysis of Digital Cytology in Germany

The digital cytology industry in Germany is expanding at 17.9% CAGR, driven by EU-backed digital health strategies, national cancer screening mandates, and growing AI trust within clinical workflows. As part of both the EU27 and Sustainability-Focused Nations, Germany is aligning pathology digitization with data privacy and diagnostic accuracy goals. Public and private insurers are jointly funding pilot programs across major hospital networks.

  • EU support for digital health interoperability and standards
  • Growing deployment in gynecological and oncology diagnostics
  • Centralized procurement for lab digitization across states

Market Dynamics for Digital Cytology in the United Kingdom

The UK is advancing at a 15.1% CAGR, focusing on digitizing its national cervical cancer screening program under NHS guidance. Government investments in telepathology hubs and AI pathology partnerships (especially in England and Scotland) support structured adoption. As an OECD member with high public health expenditure, the UK emphasizes outcome-based funding and data transparency, making it a policy leader in digital diagnostics.

  • NHS-funded pilots accelerating nationwide adoption
  • Use of AI-enabled tools to address pathologist shortage
  • Strong focus on data governance and result accuracy

Sales Outlook for Digital Cytology in China

China leads global growth with a 23.4% CAGR, enabled by government-driven healthcare digitization, domestic AI innovation, and regional screening initiatives in oncology. As a key BRICS country and Protein-Transition Market, China is reshaping cytology workflows in both urban and tier-2/3 hospitals through telemedicine and AI-based cytology tools. National mandates are accelerating digitization, particularly in cervical and lung cancer programs.

  • Mass-scale adoption in public hospitals under national digital health plan
  • Local AI companies developing automated cytology platforms
  • Health equity focus through screening access in rural zones

Demand Trends for Digital Cytology in Japan

Japan is expanding at a 13.7% CAGR, reflecting stable but measured adoption of digital cytology in aging-population diagnostics. As part of the OECD and known for precision-led healthcare, Japan focuses on integrating cytology with robotics, AI algorithms, and automated lab hardware. Uptake is highest in major oncology centers and university hospitals, with private-sector innovation filling workflow gaps in rural and satellite facilities.

  • Emphasis on high-precision, robot-assisted diagnostics
  • Aging population increasing demand for cervical and respiratory screening
  • Regulatory alignment with digital imaging and AI approval guidelines

Leading Suppliers in the Digital Cytology Market

Key players like Hologic, Inc. and Antech Diagnostics, Inc. dominate the digital cytology market due to their advanced imaging and diagnostic technologies. Hologic, Inc. is renowned for its innovative cytology solutions and AI-powered screening tools, enhancing accuracy in cancer detection. Antech Diagnostics, Inc. provides comprehensive veterinary diagnostic services, contributing to market growth through its extensive laboratory network. Other significant players, including Techcyte, Inc. and OptraScan, focus on AI-driven image analysis and high-resolution digital scanning, improving diagnostic efficiency.

Emerging companies such as Wuhan Landing Intelligence Medical Co., Ltd. and 3DHISTECH are expanding their footprint by developing cutting-edge digital pathology platforms, while established firms like Leica Biosystems, Becton, Dickinson and Company, IDEXX Laboratories, Inc., Zoetis Services LLC, and Glenbio Ltd. continue to innovate with specialized cytology products and integrated solutions for clinical and veterinary applications.

Recent Digital Cytology Industry News

In September 2024, the Institute of Biomedical Science (UK) collaborated with Hologic to publish a digital cytology roadmap aimed at addressing workforce shortages and backlogs in cervical screening. The report highlighted digital cytology as a transformative tool in the UK's screening programs.

Leading Players in the Digital Cytology Industry

  • Hologic, Inc
  • Antech Diagnostics, Inc.
  • Techcyte, Inc.
  • OptraScan
  • Wuhan Landing Intelligence Medical Co., Ltd.
  • IDEXX Laboratories, Inc.
  • Zoetis Services LLC
  • Leica Biosystems
  • Becton, Dickinson and Company
  • 3DHISTECH
  • Glenbio Ltd

Research Coverage and Scope Summary

Report Attributes Details
Current Total Market Size (2025) USD 550.4 million
Projected Market Size (2035) USD 3,030.4 million
CAGR (2025 to 2035) 18.6%
Base Year for Estimation 2024
Historical Period 2020 to 2024
Projections Period 2025 to 2035
Quantitative Units USD million for value
Component Analyzed (Segment 1) Digital Cytology Scanners, Slide Preparation Systems, Image Analysis Software, And Services.
Applications Covered (Segment 2) Human Cytology, Cervical Cancer Screening, HPV-Associated Screening, Bladder Cancer Screening, Urothelial Carcinoma Detection, Fine Needle Aspiration Cytology (FNAC) For Breast Lumps, FNAC For Thyroid Nodules, Sputum Cytology For Lung Carcinoma, Serous Fluid Cytology, Salivary Gland Cytology, Others Such As Ascitic , Pleural, Or CSF Fluid Cytology, Veterinary Cytology, Dermatologic Cytology, Oncologic Cytology, Effusion And Fluid Cytology, Hematologic Cytology, And Other Applications.
End User Covered (Segment 3) Hospitals, Diagnostic Laboratories, Cancer Research Institutes, Telepathology Providers, And Others.
Regions Covered North America , Western Europe , East Asia , South Asia
Countries Covered United States; Canada; United Kingdom; Germany; France; Italy; Spain; Netherlands; China; Japan; South Korea; India; Pakistan; Bangladesh
Key Players Influencing the Market Hologic , Inc., Antech Diagnostics, Inc., Techcyte , Inc., OptraScan , Wuhan Landing Intelligence Medical Co., Ltd., IDEXX Laboratories, Inc., Zoetis Services LLC, Leica Biosystems , Becton, Dickinson and Company, 3DHISTECH, and Glenbio Ltd.
Additional Attributes Dollar sales, market share, growth trends, key segments, competitive landscape, technological advancements, regional demand, customer needs, regulatory impact, and future opportunities to strategize product development and expand market presence effectively.

Digital Cytology Market Analyzed by Key Investment Segments

By Component:

The market is segmented into digital cytology scanners, slide preparation systems, image analysis software, and services.

By Application:

The market covers human cytology, cervical cancer screening, HPV-associated screening, bladder cancer screening, urothelial carcinoma detection, fine needle aspiration cytology (FNAC) for breast lumps, FNAC for thyroid nodules, sputum cytology for lung carcinoma, serous fluid cytology, salivary gland cytology, others such as ascitic, pleural, or CSF fluid cytology, veterinary cytology, dermatologic cytology, oncologic cytology, effusion and fluid cytology, hematologic cytology, and other applications.

By End User:

The market is categorized into hospitals, diagnostic laboratories, cancer research institutes, telepathology providers, and others.

By Region:

The market spans North America, Western Europe, East Asia, and South Asia.

Table of Content

  1. Executive Summary
    • Global Market Outlook
    • Demand-side Trends
    • Supply-side Trends
    • Technology Roadmap Analysis
    • Analysis and Recommendations
  2. Market Overview
    • Market Coverage / Taxonomy
    • Market Definition / Scope / Limitations
  3. Market Background
    • Market Dynamics
      • Drivers
      • Restraints
      • Opportunity
      • Trends
    • Scenario Forecast
      • Demand in Optimistic Scenario
      • Demand in Likely Scenario
      • Demand in Conservative Scenario
    • Opportunity Map Analysis
    • Product Life Cycle Analysis
    • Supply Chain Analysis
      • Supply Side Participants and their Roles
        • Producers
        • Mid-Level Participants (Traders/ Agents/ Brokers)
        • Wholesalers and Distributors
      • Value Added and Value Created at Node in the Supply Chain
      • List of Raw Material Suppliers
      • List of Existing and Potential Buyer’s
    • Investment Feasibility Matrix
    • Value Chain Analysis
      • Profit Margin Analysis
      • Wholesalers and Distributors
      • Retailers
    • PESTLE and Porter’s Analysis
    • Regulatory Landscape
      • By Key Regions
      • By Key Countries
    • Regional Parent Market Outlook
    • Production and Consumption Statistics
    • Import and Export Statistics
  4. Global Market Analysis 2020 to 2024 and Forecast, 2025 to 2035
    • Historical Market Size Value (USD Million) Analysis, 2020 to 2024
    • Current and Future Market Size Value (USD Million) Projections, 2025 to 2035
      • Y-o-Y Growth Trend Analysis
      • Absolute $ Opportunity Analysis
  5. Global Market Pricing Analysis 2020 to 2024 and Forecast 2025 to 2035
  6. Global Market Analysis 2020 to 2024 and Forecast 2025 to 2035, By Components
    • Introduction / Key Findings
    • Historical Market Size Value (USD Million) Analysis By Components, 2020 to 2024
    • Current and Future Market Size Value (USD Million) Analysis and Forecast By Components, 2025 to 2035
      • Scanners
      • Slide Preparation Systems
      • Image Analysis Software
      • Services
    • Y-o-Y Growth Trend Analysis By Components, 2020 to 2024
    • Absolute $ Opportunity Analysis By Components, 2025 to 2035
  7. Global Market Analysis 2020 to 2024 and Forecast 2025 to 2035, By Application
    • Introduction / Key Findings
    • Historical Market Size Value (USD Million) Analysis By Application, 2020 to 2024
    • Current and Future Market Size Value (USD Million) Analysis and Forecast By Application, 2025 to 2035
      • Human Cytology
      • Cervical Cancer Screening
      • HPV Associated Screening
      • Bladder Cancer Screening
      • Urothelial Carcinoma Detection
      • Fine Needle Aspiration Cytology (FNAC) for Breast Lumps
      • FNAC for Thyroid Nodules
      • Sputum Cytology for Lung Carcinoma
      • Serous Fluid Cytology
      • Salivary Gland Cytology
      • Others (Ascitic, Pleural or CSF Fluid Cytology)
      • Veterinary Cytology
    • Y-o-Y Growth Trend Analysis By Application, 2020 to 2024
    • Absolute $ Opportunity Analysis By Application, 2025 to 2035
  8. Global Market Analysis 2020 to 2024 and Forecast 2025 to 2035, By End User
    • Introduction / Key Findings
    • Historical Market Size Value (USD Million) Analysis By End User, 2020 to 2024
    • Current and Future Market Size Value (USD Million) Analysis and Forecast By End User, 2025 to 2035
      • Hospitals
      • Diagnostic Laboratories
      • Cancer Research Institutes
      • Telepathology Providers
      • Others
    • Y-o-Y Growth Trend Analysis By End User, 2020 to 2024
    • Absolute $ Opportunity Analysis By End User, 2025 to 2035
  9. Global Market Analysis 2020 to 2024 and Forecast 2025 to 2035, By Region
    • Introduction
    • Historical Market Size Value (USD Million) Analysis By Region, 2020 to 2024
    • Current Market Size Value (USD Million) Analysis and Forecast By Region, 2025 to 2035
      • North America
      • Latin America
      • Western Europe
      • Eastern Europe
      • East Asia
      • South Asia & Pacific
      • Middle East and Africa
    • Market Attractiveness Analysis By Region
  10. North America Market Analysis 2020 to 2024 and Forecast 2025 to 2035, By Country
    • Historical Market Size Value (USD Million) Trend Analysis By Market Taxonomy, 2020 to 2024
    • Market Size Value (USD Million) Forecast By Market Taxonomy, 2025 to 2035
      • By Country
        • USA
        • Canada
        • Mexico
      • By Components
      • By Application
      • By End User
    • Market Attractiveness Analysis
      • By Country
      • By Components
      • By Application
      • By End User
    • Key Takeaways
  11. Latin America Market Analysis 2020 to 2024 and Forecast 2025 to 2035, By Country
    • Historical Market Size Value (USD Million) Trend Analysis By Market Taxonomy, 2020 to 2024
    • Market Size Value (USD Million) Forecast By Market Taxonomy, 2025 to 2035
      • By Country
        • Brazil
        • Argentina
        • Rest of LATAM
      • By Components
      • By Application
      • By End User
    • Market Attractiveness Analysis
      • By Country
      • By Components
      • By Application
      • By End User
    • Key Takeaways
  12. Western Europe Market Analysis 2020 to 2024 and Forecast 2025 to 2035, By Country
    • Historical Market Size Value (USD Million) Trend Analysis By Market Taxonomy, 2020 to 2024
    • Market Size Value (USD Million) Forecast By Market Taxonomy, 2025 to 2035
      • By Country
        • Germany
        • Italy
        • France
        • UK
        • Spain
        • BENELUX
        • Nordic
        • Rest of W.Europe
      • By Components
      • By Application
      • By End User
    • Market Attractiveness Analysis
      • By Country
      • By Components
      • By Application
      • By End User
    • Key Takeaways
  13. Eastern Europe Market Analysis 2020 to 2024 and Forecast 2025 to 2035, By Country
    • Historical Market Size Value (USD Million) Trend Analysis By Market Taxonomy, 2020 to 2024
    • Market Size Value (USD Million) Forecast By Market Taxonomy, 2025 to 2035
      • By Country
        • Russia
        • Hungary
        • Poland
        • Balkan & Baltics
        • Rest of E. Europe
      • By Components
      • By Application
      • By End User
    • Market Attractiveness Analysis
      • By Country
      • By Components
      • By Application
      • By End User
    • Key Takeaways
  14. East Asia Market Analysis 2020 to 2024 and Forecast 2025 to 2035, By Country
    • Historical Market Size Value (USD Million) Trend Analysis By Market Taxonomy, 2020 to 2024
    • Market Size Value (USD Million) Forecast By Market Taxonomy, 2025 to 2035
      • By Country
        • China
        • Japan
        • South Korea
      • By Components
      • By Application
      • By End User
    • Market Attractiveness Analysis
      • By Country
      • By Components
      • By Application
      • By End User
    • Key Takeaways
  15. South Asia & Pacific Market Analysis 2020 to 2024 and Forecast 2025 to 2035, By Country
    • Historical Market Size Value (USD Million) Trend Analysis By Market Taxonomy, 2020 to 2024
    • Market Size Value (USD Million) Forecast By Market Taxonomy, 2025 to 2035
      • By Country
        • India
        • Australia & New Zealand
        • ASEAN
        • Rest of SAP
      • By Components
      • By Application
      • By End User
    • Market Attractiveness Analysis
      • By Country
      • By Components
      • By Application
      • By End User
    • Key Takeaways
  16. Middle East and Africa Market Analysis 2020 to 2024 and Forecast 2025 to 2035, By Country
    • Historical Market Size Value (USD Million) Trend Analysis By Market Taxonomy, 2020 to 2024
    • Market Size Value (USD Million) Forecast By Market Taxonomy, 2025 to 2035
      • By Country
        • GCC Countries
        • Northern Africa
        • South Africa
        • Turkiye
        • Rest of MEA
      • By Components
      • By Application
      • By End User
    • Market Attractiveness Analysis
      • By Country
      • By Components
      • By Application
      • By End User
    • Key Takeaways
  17. Key Countries Market Analysis
    • USA
      • Pricing Analysis
      • Market Share Analysis, 2024
        • By Components
        • By Application
        • By End User
    • Canada
      • Pricing Analysis
      • Market Share Analysis, 2024
        • By Components
        • By Application
        • By End User
    • Brazil
      • Pricing Analysis
      • Market Share Analysis, 2024
        • By Components
        • By Application
        • By End User
    • Mexico
      • Pricing Analysis
      • Market Share Analysis, 2024
        • By Components
        • By Application
        • By End User
    • Argentina
      • Pricing Analysis
      • Market Share Analysis, 2024
        • By Components
        • By Application
        • By End User
  18. Market Structure Analysis
    • Competition Dashboard
    • Competition Benchmarking
    • Market Share Analysis of Top Players
      • By Regional
      • By Components
      • By Application
      • By End User
  19. Competition Analysis
    • Competition Deep Dive
      • Hologic, Inc
        • Overview
        • Product Portfolio
        • Profitability by Market Segments (Product/Age /Sales Channel/Region)
        • Sales Footprint
        • Strategy Overview
          • Marketing Strategy
          • Product Strategy
          • Channel Strategy
      • Antech Diagnostics, Inc.
        • Overview
        • Product Portfolio
        • Profitability by Market Segments (Product/Age /Sales Channel/Region)
        • Sales Footprint
        • Strategy Overview
          • Marketing Strategy
          • Product Strategy
          • Channel Strategy
      • Techcyte, Inc.
        • Overview
        • Product Portfolio
        • Profitability by Market Segments (Product/Age /Sales Channel/Region)
        • Sales Footprint
        • Strategy Overview
          • Marketing Strategy
          • Product Strategy
          • Channel Strategy
      • OptraScan
        • Overview
        • Product Portfolio
        • Profitability by Market Segments (Product/Age /Sales Channel/Region)
        • Sales Footprint
        • Strategy Overview
          • Marketing Strategy
          • Product Strategy
          • Channel Strategy
      • Wuhan Landing Intelligence Medical Co., Ltd.
        • Overview
        • Product Portfolio
        • Profitability by Market Segments (Product/Age /Sales Channel/Region)
        • Sales Footprint
        • Strategy Overview
          • Marketing Strategy
          • Product Strategy
          • Channel Strategy
      • IDEXX Laboratories, Inc.
        • Overview
        • Product Portfolio
        • Profitability by Market Segments (Product/Age /Sales Channel/Region)
        • Sales Footprint
        • Strategy Overview
          • Marketing Strategy
          • Product Strategy
          • Channel Strategy
      • Zoetis Services LLC
        • Overview
        • Product Portfolio
        • Profitability by Market Segments (Product/Age /Sales Channel/Region)
        • Sales Footprint
        • Strategy Overview
          • Marketing Strategy
          • Product Strategy
          • Channel Strategy
      • Leica Biosystems
        • Overview
        • Product Portfolio
        • Profitability by Market Segments (Product/Age /Sales Channel/Region)
        • Sales Footprint
        • Strategy Overview
          • Marketing Strategy
          • Product Strategy
          • Channel Strategy
      • Becton, Dickinson and Company
        • Overview
        • Product Portfolio
        • Profitability by Market Segments (Product/Age /Sales Channel/Region)
        • Sales Footprint
        • Strategy Overview
          • Marketing Strategy
          • Product Strategy
          • Channel Strategy
      • 3DHISTECH
        • Overview
        • Product Portfolio
        • Profitability by Market Segments (Product/Age /Sales Channel/Region)
        • Sales Footprint
        • Strategy Overview
          • Marketing Strategy
          • Product Strategy
          • Channel Strategy
      • Glenbio Ltd
        • Overview
        • Product Portfolio
        • Profitability by Market Segments (Product/Age /Sales Channel/Region)
        • Sales Footprint
        • Strategy Overview
          • Marketing Strategy
          • Product Strategy
          • Channel Strategy
  20. Assumptions & Acronyms Used
  21. Research Methodology

List of Tables

  • Table 1: Global Market Value (USD Million) Forecast by Region, 2020 to 2035
  • Table 2: Global Market Value (USD Million) Forecast by Components, 2020 to 2035
  • Table 3: Global Market Value (USD Million) Forecast by Application, 2020 to 2035
  • Table 4: Global Market Value (USD Million) Forecast by End User, 2020 to 2035
  • Table 5: North America Market Value (USD Million) Forecast by Country, 2020 to 2035
  • Table 6: North America Market Value (USD Million) Forecast by Components, 2020 to 2035
  • Table 7: North America Market Value (USD Million) Forecast by Application, 2020 to 2035
  • Table 8: North America Market Value (USD Million) Forecast by End User, 2020 to 2035
  • Table 9: Latin America Market Value (USD Million) Forecast by Country, 2020 to 2035
  • Table 10: Latin America Market Value (USD Million) Forecast by Components, 2020 to 2035
  • Table 11: Latin America Market Value (USD Million) Forecast by Application, 2020 to 2035
  • Table 12: Latin America Market Value (USD Million) Forecast by End User, 2020 to 2035
  • Table 13: Western Europe Market Value (USD Million) Forecast by Country, 2020 to 2035
  • Table 14: Western Europe Market Value (USD Million) Forecast by Components, 2020 to 2035
  • Table 15: Western Europe Market Value (USD Million) Forecast by Application, 2020 to 2035
  • Table 16: Western Europe Market Value (USD Million) Forecast by End User, 2020 to 2035
  • Table 17: Eastern Europe Market Value (USD Million) Forecast by Country, 2020 to 2035
  • Table 18: Eastern Europe Market Value (USD Million) Forecast by Components, 2020 to 2035
  • Table 19: Eastern Europe Market Value (USD Million) Forecast by Application, 2020 to 2035
  • Table 20: Eastern Europe Market Value (USD Million) Forecast by End User, 2020 to 2035
  • Table 21: East Asia Market Value (USD Million) Forecast by Country, 2020 to 2035
  • Table 22: East Asia Market Value (USD Million) Forecast by Components, 2020 to 2035
  • Table 23: East Asia Market Value (USD Million) Forecast by Application, 2020 to 2035
  • Table 24: East Asia Market Value (USD Million) Forecast by End User, 2020 to 2035
  • Table 25: South Asia & Pacific Market Value (USD Million) Forecast by Country, 2020 to 2035
  • Table 26: South Asia & Pacific Market Value (USD Million) Forecast by Components, 2020 to 2035
  • Table 27: South Asia & Pacific Market Value (USD Million) Forecast by Application, 2020 to 2035
  • Table 28: South Asia & Pacific Market Value (USD Million) Forecast by End User, 2020 to 2035
  • Table 29: Middle East and Africa Market Value (USD Million) Forecast by Country, 2020 to 2035
  • Table 30: Middle East and Africa Market Value (USD Million) Forecast by Components, 2020 to 2035
  • Table 31: Middle East and Africa Market Value (USD Million) Forecast by Application, 2020 to 2035
  • Table 32: Middle East and Africa Market Value (USD Million) Forecast by End User, 2020 to 2035

List of Figures

  • Figure 1: Global Market Pricing Analysis
  • Figure 2: Global Market Value (USD Million) Forecast 2020 to 2035
  • Figure 3: Global Market Value Share and BPS Analysis by Components, 2025 and 2035
  • Figure 4: Global Market Y-o-Y Growth Comparison by Components, 2025 to 2035
  • Figure 5: Global Market Attractiveness Analysis by Components
  • Figure 6: Global Market Value Share and BPS Analysis by Application, 2025 and 2035
  • Figure 7: Global Market Y-o-Y Growth Comparison by Application, 2025 to 2035
  • Figure 8: Global Market Attractiveness Analysis by Application
  • Figure 9: Global Market Value Share and BPS Analysis by End User, 2025 and 2035
  • Figure 10: Global Market Y-o-Y Growth Comparison by End User, 2025 to 2035
  • Figure 11: Global Market Attractiveness Analysis by End User
  • Figure 12: Global Market Value (USD Million) Share and BPS Analysis by Region, 2025 and 2035
  • Figure 13: Global Market Y-o-Y Growth Comparison by Region, 2025 to 2035
  • Figure 14: Global Market Attractiveness Analysis by Region
  • Figure 15: North America Market Incremental $ Opportunity, 2025 to 2035
  • Figure 16: Latin America Market Incremental $ Opportunity, 2025 to 2035
  • Figure 17: Western Europe Market Incremental $ Opportunity, 2025 to 2035
  • Figure 18: Eastern Europe Market Incremental $ Opportunity, 2025 to 2035
  • Figure 19: East Asia Market Incremental $ Opportunity, 2025 to 2035
  • Figure 20: South Asia & Pacific Market Incremental $ Opportunity, 2025 to 2035
  • Figure 21: Middle East and Africa Market Incremental $ Opportunity, 2025 to 2035
  • Figure 22: North America Market Value Share and BPS Analysis by Country, 2025 and 2035
  • Figure 23: North America Market Value Share and BPS Analysis by Components, 2025 and 2035
  • Figure 24: North America Market Y-o-Y Growth Comparison by Components, 2025 to 2035
  • Figure 25: North America Market Attractiveness Analysis by Components
  • Figure 26: North America Market Value Share and BPS Analysis by Application, 2025 and 2035
  • Figure 27: North America Market Y-o-Y Growth Comparison by Application, 2025 to 2035
  • Figure 28: North America Market Attractiveness Analysis by Application
  • Figure 29: North America Market Value Share and BPS Analysis by End User, 2025 and 2035
  • Figure 30: North America Market Y-o-Y Growth Comparison by End User, 2025 to 2035
  • Figure 31: North America Market Attractiveness Analysis by End User
  • Figure 32: Latin America Market Value Share and BPS Analysis by Country, 2025 and 2035
  • Figure 33: Latin America Market Value Share and BPS Analysis by Components, 2025 and 2035
  • Figure 34: Latin America Market Y-o-Y Growth Comparison by Components, 2025 to 2035
  • Figure 35: Latin America Market Attractiveness Analysis by Components
  • Figure 36: Latin America Market Value Share and BPS Analysis by Application, 2025 and 2035
  • Figure 37: Latin America Market Y-o-Y Growth Comparison by Application, 2025 to 2035
  • Figure 38: Latin America Market Attractiveness Analysis by Application
  • Figure 39: Latin America Market Value Share and BPS Analysis by End User, 2025 and 2035
  • Figure 40: Latin America Market Y-o-Y Growth Comparison by End User, 2025 to 2035
  • Figure 41: Latin America Market Attractiveness Analysis by End User
  • Figure 42: Western Europe Market Value Share and BPS Analysis by Country, 2025 and 2035
  • Figure 43: Western Europe Market Value Share and BPS Analysis by Components, 2025 and 2035
  • Figure 44: Western Europe Market Y-o-Y Growth Comparison by Components, 2025 to 2035
  • Figure 45: Western Europe Market Attractiveness Analysis by Components
  • Figure 46: Western Europe Market Value Share and BPS Analysis by Application, 2025 and 2035
  • Figure 47: Western Europe Market Y-o-Y Growth Comparison by Application, 2025 to 2035
  • Figure 48: Western Europe Market Attractiveness Analysis by Application
  • Figure 49: Western Europe Market Value Share and BPS Analysis by End User, 2025 and 2035
  • Figure 50: Western Europe Market Y-o-Y Growth Comparison by End User, 2025 to 2035
  • Figure 51: Western Europe Market Attractiveness Analysis by End User
  • Figure 52: Eastern Europe Market Value Share and BPS Analysis by Country, 2025 and 2035
  • Figure 53: Eastern Europe Market Value Share and BPS Analysis by Components, 2025 and 2035
  • Figure 54: Eastern Europe Market Y-o-Y Growth Comparison by Components, 2025 to 2035
  • Figure 55: Eastern Europe Market Attractiveness Analysis by Components
  • Figure 56: Eastern Europe Market Value Share and BPS Analysis by Application, 2025 and 2035
  • Figure 57: Eastern Europe Market Y-o-Y Growth Comparison by Application, 2025 to 2035
  • Figure 58: Eastern Europe Market Attractiveness Analysis by Application
  • Figure 59: Eastern Europe Market Value Share and BPS Analysis by End User, 2025 and 2035
  • Figure 60: Eastern Europe Market Y-o-Y Growth Comparison by End User, 2025 to 2035
  • Figure 61: Eastern Europe Market Attractiveness Analysis by End User
  • Figure 62: East Asia Market Value Share and BPS Analysis by Country, 2025 and 2035
  • Figure 63: East Asia Market Value Share and BPS Analysis by Components, 2025 and 2035
  • Figure 64: East Asia Market Y-o-Y Growth Comparison by Components, 2025 to 2035
  • Figure 65: East Asia Market Attractiveness Analysis by Components
  • Figure 66: East Asia Market Value Share and BPS Analysis by Application, 2025 and 2035
  • Figure 67: East Asia Market Y-o-Y Growth Comparison by Application, 2025 to 2035
  • Figure 68: East Asia Market Attractiveness Analysis by Application
  • Figure 69: East Asia Market Value Share and BPS Analysis by End User, 2025 and 2035
  • Figure 70: East Asia Market Y-o-Y Growth Comparison by End User, 2025 to 2035
  • Figure 71: East Asia Market Attractiveness Analysis by End User
  • Figure 72: South Asia & Pacific Market Value Share and BPS Analysis by Country, 2025 and 2035
  • Figure 73: South Asia & Pacific Market Value Share and BPS Analysis by Components, 2025 and 2035
  • Figure 74: South Asia & Pacific Market Y-o-Y Growth Comparison by Components, 2025 to 2035
  • Figure 75: South Asia & Pacific Market Attractiveness Analysis by Components
  • Figure 76: South Asia & Pacific Market Value Share and BPS Analysis by Application, 2025 and 2035
  • Figure 77: South Asia & Pacific Market Y-o-Y Growth Comparison by Application, 2025 to 2035
  • Figure 78: South Asia & Pacific Market Attractiveness Analysis by Application
  • Figure 79: South Asia & Pacific Market Value Share and BPS Analysis by End User, 2025 and 2035
  • Figure 80: South Asia & Pacific Market Y-o-Y Growth Comparison by End User, 2025 to 2035
  • Figure 81: South Asia & Pacific Market Attractiveness Analysis by End User
  • Figure 82: Middle East and Africa Market Value Share and BPS Analysis by Country, 2025 and 2035
  • Figure 83: Middle East and Africa Market Value Share and BPS Analysis by Components, 2025 and 2035
  • Figure 84: Middle East and Africa Market Y-o-Y Growth Comparison by Components, 2025 to 2035
  • Figure 85: Middle East and Africa Market Attractiveness Analysis by Components
  • Figure 86: Middle East and Africa Market Value Share and BPS Analysis by Application, 2025 and 2035
  • Figure 87: Middle East and Africa Market Y-o-Y Growth Comparison by Application, 2025 to 2035
  • Figure 88: Middle East and Africa Market Attractiveness Analysis by Application
  • Figure 89: Middle East and Africa Market Value Share and BPS Analysis by End User, 2025 and 2035
  • Figure 90: Middle East and Africa Market Y-o-Y Growth Comparison by End User, 2025 to 2035
  • Figure 91: Middle East and Africa Market Attractiveness Analysis by End User
  • Figure 92: Global Market - Tier Structure Analysis
  • Figure 93: Global Market - Company Share Analysis

Frequently Asked Questions

What is the projected size of the digital cytology market by 2035?

The market is expected to reach USD 3,030.4 million by 2035.

What is the estimated market size of the digital cytology market in 2025?

The market size is projected to be USD 550.4 million in 2025.

What is the CAGR of the digital cytology market from 2025 to 2035?

The market is expected to grow at a CAGR of 18.6% from 2025 to 2035.

Which country is the fastest growing in the digital cytology market?

China is expected to be the fastest growing with a CAGR of 23.4%.

Which segment leads the digital cytology market for application?

Human cytology, accounting for over 72.0% of the market in 2025.

Explore Similar Insights

Future Market Insights

Digital Cytology Market