The Digital Barometer Market is estimated to be valued at USD 1.1 billion in 2025 and is projected to reach USD 1.6 billion by 2035, registering a compound annual growth rate (CAGR) of 3.5% over the forecast period.
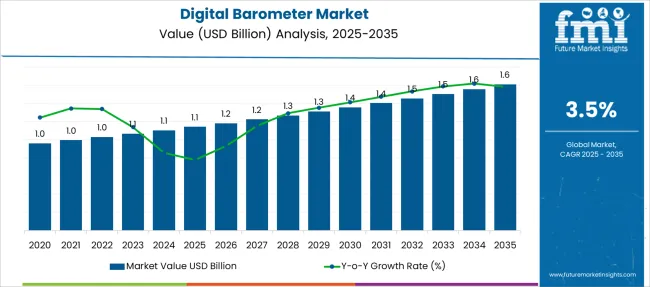
| Metric | Value |
|---|---|
| Digital Barometer Market Estimated Value in (2025 E) | USD 1.1 billion |
| Digital Barometer Market Forecast Value in (2035 F) | USD 1.6 billion |
| Forecast CAGR (2025 to 2035) | 3.5% |
The digital barometer market is expanding steadily due to the increasing need for accurate atmospheric pressure measurement across various scientific and industrial domains. Advances in sensor technology, combined with miniaturization and integration with mobile devices, have enhanced the utility and accessibility of digital barometers.
These instruments are being widely adopted for research, weather forecasting, industrial monitoring, and pharmaceutical applications, where precise pressure readings are critical. Additionally, growing demand for portable and wireless-enabled devices has broadened their applicability in both field and laboratory settings.
Enhanced digital calibration features and compatibility with real-time data logging systems have further driven market penetration. As precision, portability, and real-time analytics become central to operational efficiency, the demand for digital barometers is expected to continue rising across multiple sectors.
The market is segmented by Modality and End Users and region. By Modality, the market is divided into Hand-held, Table-top, and Wall-mounted. In terms of End Users, the market is classified into Pharmaceutical Companies, Research Laboratories, Academic Research Institutes, Winery and Breweries, Oil & Gas Industries, CMOS, and Meteorological Departments. Regionally, the market is classified into North America, Latin America, Western Europe, Eastern Europe, Balkan & Baltic Countries, Russia & Belarus, Central Asia, East Asia, South Asia & Pacific, and the Middle East & Africa.
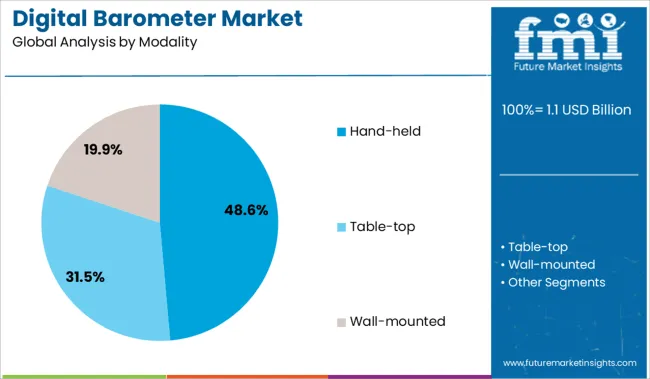
The hand held modality segment is projected to contribute 48.60% of the total market revenue by 2025, making it the leading modality type. This dominance is attributed to the increasing demand for portable and user friendly instruments that offer accurate and fast atmospheric pressure readings in field conditions.
Hand held digital barometers are widely favored by meteorologists, environmental researchers, and technicians due to their lightweight design, battery efficiency, and ease of operation. Additionally, their utility in on site diagnostics and mobile data acquisition has reinforced their use in environmental studies and industrial inspections.
As operational needs continue to shift toward field deployable and real time monitoring equipment, the hand held modality remains the most adaptable and widely adopted format in the market.
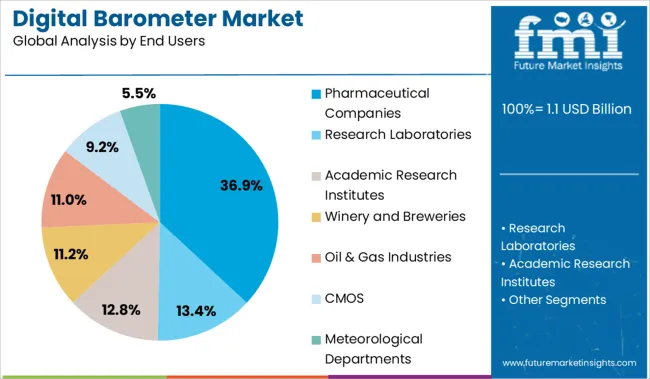
The pharmaceutical companies segment is expected to hold 36.90% of the market revenue by 2025, positioning it as the most prominent end user. This growth is driven by the critical role atmospheric pressure plays in the stability, quality control, and environmental regulation of pharmaceutical products during manufacturing and storage.
Digital barometers are being integrated into controlled environments such as cleanrooms and production areas to ensure regulatory compliance and process consistency. The demand for precision monitoring tools within good manufacturing practice protocols has also contributed to higher adoption rates.
As pharmaceutical operations scale up and emphasize automation and monitoring accuracy, digital barometers have become essential instruments, reinforcing this segment's leadership in the market.
Maintenance of specific atmospheric conditions is very important in research laboratories and pharmaceutical manufacturing as well as research and laboratory sites. Increasing demand for biotechnology and drug designing propel the growth of research institutes and pharmaceutical companies.
This is considered an important driver of the digital barometer market. The advancements in technologies fuel the growth of digital barometers in the market to develop new innovative product types with additional features and greater sensitivity in a compact size with affordability. Today’s digital barometers are popular for a variety of reasons ranging from contemporary styling, advanced features, greater precision, long life, and low-on-pocket nature. These characteristics make digital barometers a great choice for numerous applications in pharmaceutical industries, research laboratories, academic research institutes, and many more.
Apart from laboratories, digital barometers find applications in meteorological departments for weather forecasts. Digital barometers can efficiently tell the short-term expected changes in the climate. Modern-day digital barometers are wall-mounted tablets from digital barometers that come with multi-specialties such as temperature, future forecast, time, etc. Digital barometer display enables easy interpretation of measurements and allows computer storage of the analysis. The electronic format of digital barometers allows multiple scales for precision and sensitivity. Moreover, digital barometers track the atmospheric pressure for every minute.
The challenges associated with the growth of the global digital barometer market are variations in regulatory standards for different regions or countries. In addition, the cheaper cost of normal barometers with the same functionality makes end users not opt for digital barometers creating a restraint in the global expansion of the digital barometer market. However, digital barometer manufacturers are continuously focused on manufacturing digital barometers based on regional standards and are expected to overcome this challenge by the end of the forecast period.
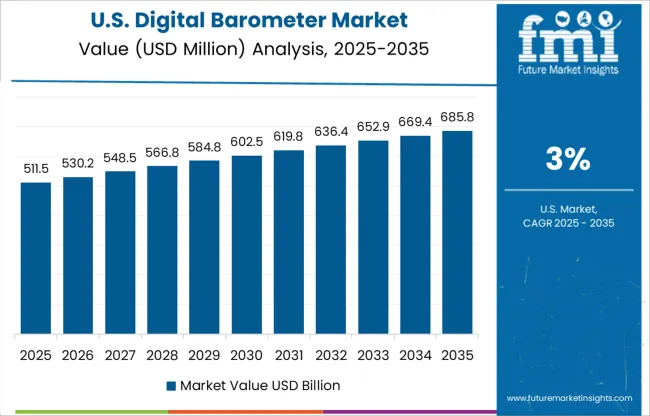
According to Future Market Insights, North America is the most dominating market and holds the largest revenue share, due to the higher presence of research and academic laboratories. Increasing expenditure and funding on biotechnology and research and developmental programs are also a contributor to the domination of North America in the digital barometer market.
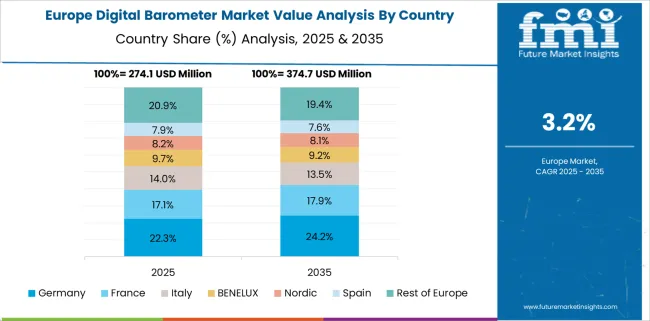
As per the FMI analysis, Europe accounts for the second large revenue share in the global digital barometer market, owing to the increasing adoption of digital barometers by end users and higher expenditure on research and development. Moreover, rapid growth is expected in the digital barometer market, due to advances in technology and the establishment of science research groups and laboratories.
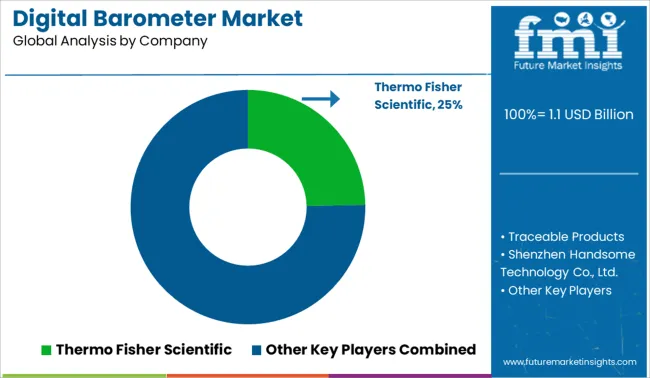
Some of the key participants present in the global digital barometer market include Thermo Fisher Scientific, Traceable Products, Meteorologische Instrumente KG, Fotronic Corporation, Shenzhen Handsome Technology Co., Ltd., NovaLynx Corporation, WIKA Alexander Wiegand SE & Co. KG, Ahlborn Mess- und Regelungstechnik GmbH, Aquatech Scientific Instruments LLC and Omegadyne, Inc., and others. Attributed to the presence of such a high number of participants, the market is highly competitive.
| Report Attribute | Details |
|---|---|
| Market Value in 2025 | USD 1.1 billion |
| Market Value in 2035 | USD 1.6 billion |
| Growth Rate | CAGR of 3.5% from 2025 to 2035 |
| Base Year for Estimation | 2024 |
| Historical Data | 2020 to 2024 |
| Forecast Period | 2025 to 2035 |
| Quantitative Units | Revenue in USD Million CAGR from 2025 to 2035 |
| Report Coverage | Revenue Forecast, Volume Forecast, Company Ranking, Competitive Landscape, Growth Factors, Trends, and Pricing Analysis |
| Segments Covered | Modality, End-Use, Region |
| Regions Covered | North America; Latin America; Europe; East Asia; South Asia and the Pacific; Middle East and Africa |
| Key Countries Profiled | USA, Canada, Brazil, Mexico, Germany, Italy, France, United Kingdom, Spain, BENELUX, Russia, China, Japan, South Korea, India, ASIAN, Australia and New Zealand, GCC Countries, Turkey, South Africa |
| Key Companies Profiled | Thermo Fisher Scientific; Traceable Products; Shenzhen Handsome Technology Co. Ltd.; NovaLynx Corporation; WIKA Alexander Wiegand SE & Co. KG; Ahlborn Mess- und Regelungstechnik GmbH; Aquatech Scientific Instruments LLC; Omegadyne Inc. |
| Customization | Available Upon Request |
The global digital barometer market is estimated to be valued at USD 1.1 billion in 2025.
The market size for the digital barometer market is projected to reach USD 1.6 billion by 2035.
The digital barometer market is expected to grow at a 3.5% CAGR between 2025 and 2035.
The key product types in digital barometer market are hand-held, table-top and wall-mounted.
In terms of end users, pharmaceutical companies segment to command 36.9% share in the digital barometer market in 2025.


Our Research Products

The "Full Research Suite" delivers actionable market intel, deep dives on markets or technologies, so clients act faster, cut risk, and unlock growth.

The Leaderboard benchmarks and ranks top vendors, classifying them as Established Leaders, Leading Challengers, or Disruptors & Challengers.

Locates where complements amplify value and substitutes erode it, forecasting net impact by horizon

We deliver granular, decision-grade intel: market sizing, 5-year forecasts, pricing, adoption, usage, revenue, and operational KPIs—plus competitor tracking, regulation, and value chains—across 60 countries broadly.

Spot the shifts before they hit your P&L. We track inflection points, adoption curves, pricing moves, and ecosystem plays to show where demand is heading, why it is changing, and what to do next across high-growth markets and disruptive tech

Real-time reads of user behavior. We track shifting priorities, perceptions of today’s and next-gen services, and provider experience, then pace how fast tech moves from trial to adoption, blending buyer, consumer, and channel inputs with social signals (#WhySwitch, #UX).

Partner with our analyst team to build a custom report designed around your business priorities. From analysing market trends to assessing competitors or crafting bespoke datasets, we tailor insights to your needs.
Supplier Intelligence
Discovery & Profiling
Capacity & Footprint
Performance & Risk
Compliance & Governance
Commercial Readiness
Who Supplies Whom
Scorecards & Shortlists
Playbooks & Docs
Category Intelligence
Definition & Scope
Demand & Use Cases
Cost Drivers
Market Structure
Supply Chain Map
Trade & Policy
Operating Norms
Deliverables
Buyer Intelligence
Account Basics
Spend & Scope
Procurement Model
Vendor Requirements
Terms & Policies
Entry Strategy
Pain Points & Triggers
Outputs
Pricing Analysis
Benchmarks
Trends
Should-Cost
Indexation
Landed Cost
Commercial Terms
Deliverables
Brand Analysis
Positioning & Value Prop
Share & Presence
Customer Evidence
Go-to-Market
Digital & Reputation
Compliance & Trust
KPIs & Gaps
Outputs
Full Research Suite comprises of:
Market outlook & trends analysis
Interviews & case studies
Strategic recommendations
Vendor profiles & capabilities analysis
5-year forecasts
8 regions and 60+ country-level data splits
Market segment data splits
12 months of continuous data updates
DELIVERED AS:
PDF EXCEL ONLINE
Digital Hall Effect Gaussmeter Market Size and Share Forecast Outlook 2025 to 2035
Digital Group Dining Service Market Size and Share Forecast Outlook 2025 to 2035
Digital Pathology Displays Market Size and Share Forecast Outlook 2025 to 2035
Digital Rights Management Market Size and Share Forecast Outlook 2025 to 2035
Digital Liquid Filling Systems Market Size and Share Forecast Outlook 2025 to 2035
Digital Transformation Industry Analysis in MENA Size and Share Forecast Outlook 2025 to 2035
Digital X-Ray Equipment Market Size and Share Forecast Outlook 2025 to 2035
Digital Marketing Analytics Industry Analysis in Latin America Forecast Outlook 2025 to 2035
Digital Health Market Forecast and Outlook 2025 to 2035
Digital Pen Market Forecast and Outlook 2025 to 2035
Digital X-ray Market Size and Share Forecast Outlook 2025 to 2035
Digital Elevation Model Market Size and Share Forecast Outlook 2025 to 2035
Digital Pump Controller Market Size and Share Forecast Outlook 2025 to 2035
Digital Textile Printing Market Size and Share Forecast Outlook 2025 to 2035
Barometer Market Size and Share Forecast Outlook 2025 to 2035
Digital Printing Paper Market Size and Share Forecast Outlook 2025 to 2035
Digital Battlefield Market Size and Share Forecast Outlook 2025 to 2035
Digital Product Passport Software Market Size and Share Forecast Outlook 2025 to 2035
Digital Lending Platform Market Size and Share Forecast Outlook 2025 to 2035
Digital Shipyard Market Size and Share Forecast Outlook 2025 to 2035

Thank you!
You will receive an email from our Business Development Manager. Please be sure to check your SPAM/JUNK folder too.
Chat With
MaRIA