This site uses cookies, including third-party cookies, that help us to provide and improve our services.

Privacy Policy
- Global Locations -
Headquarters
Future Market Insights, Inc.
Christiana Corporate, 200 Continental Drive, Suite 401, Newark, Delaware - 19713, United States
T: +1-845-579-5705
MEA
Market Access DMCC

1602-6 Jumeirah Bay X2 Tower, Plot No: JLT-PH2-X2A,

Jumeirah Lakes Towers, Dubai,

United Arab Emirates

Americas
Future Market Insights
616 Corporate Way, Suite 2-9018,
Valley Cottage, NY 10989,
United States
T: +1-347-918-3531
Europe
Future Market Insights
3rd Floor, 207 Regent Street,
London W1B 3HH
United Kingdom
T: + 44 (0) 20 8123 9659
D: +44 (0) 20 3287 4268
APAC
Future Market Insights
Office No. 401-A, 4th Floor,
VANTAGE 9, S.No. 36/1/1,
Baner, Pune 411045 India

Pharmaceutical Filtration Market

Know How the Preference for Microfiltration Technology Benefiting the Pharmaceutical Filtration Manufacturers with FMI’s Latest Study!

Pharmaceutical Filtration Market By Product Type, Scale of Operation, Technology & Region - Forecast 2022 - 2032

Pharmaceutical Filtration Market Outlook (2022-2032)

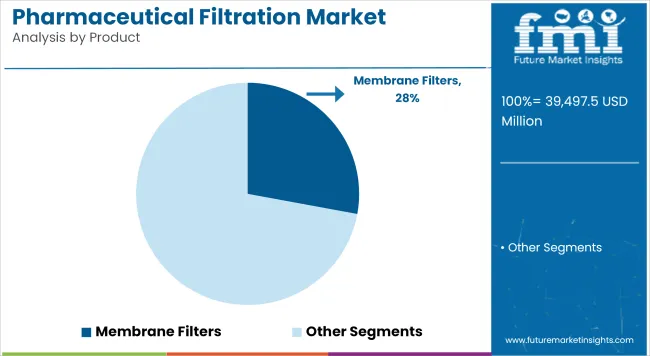
[170 Pages Report] The global pharmaceutical filtration market is expected to enjoy a valuation of US$ 17.8 Bn by the end of 2022 and further expand at a CAGR of 8.7% to reach a valuation of ~US$ 41.0 Bn by 2032. According to the recent study, membrane filters segment by product is leading the market with a share of about 33.3% in 2021.

Attributes

Key Insights

Pharmaceutical Filtration Market Value 2021

US$ 16.6 Bn

Estimated Market Value 2022

US$ 17.8 Bn

Projected Market Value 2032

US$ 41.0 Bn

CAGR 2022-2032

8.7%

Market Share of Top 6 Countries

48.9%

Pharmaceutical filtration process is a physical separation method, which has the ability to distinguish independent molecules of different sizes and characteristics. Different types of materials utilized to build membranes. They are frequently referred to as thin-film composite membranes when used in reverse osmosis (RO). Based on the size of material they are required to separate from the feed liquid, these filters are divided into, ultrafiltration, nanofiltration, microfiltration, others.

Customize this Report

Let us know your requirement to get
100% FREE customization

Sales Analysis of Pharmaceutical Filtration Market from 2017 to 2021 Vs Market Outlook for 2022 to 2032

The market value for pharmaceutical filtration was approximately 17.1% of the overall ~US$ 97.3 Bn global filtration & separation market in 2021. The sales of pharmaceutical filters expanded at a CAGR of 7.2% from 2017 to 2021, owing to their increasing applications in the industrial biotechnology sector.

The filtration process is an important part of biopharmaceutical manufacturing and production. The clarifying process influences yield, product uniformity, and reproducibility. Microfiltration is an important and widely used method for removing entire cells, cell debris, and colloids from mammalian and bacterial fermentation broths.

These optimised systems are crucial in increasing the efficiency of the overall clarifying process. By dispersing particle loading throughout numerous phases, the overall efficiency and capacity of the process are improved. The microfiltration filters provide the clearest products because they function as a positive size exclusion barrier for particles larger than the membrane's pore size.

Large-molecule biopharmaceuticals have gained prominence in recent years because of their medicinal potential. Membrane separation is an important technique in biopharmaceutical manufacturing and will help the growth of membrane separation product manufacturers. Thus, owing to the aforementioned factors, the global pharmaceutical filtration market is expected to grow at a CAGR of 8.7% during the forecast period from 2022 to 2032.

Pharmaceutical Filtration Market Download Report Brochure

What are the Key Opportunities in the Global Pharmaceutical Filtration Market?

Growth in the pharmaceutical filtration market is due to rising R&D expenditures. This factor ranks among the top indicators used by biopharmaceutical companies to identify and develop novel drugs and medical interventions.

According to the annual survey of members of PhMRA (a powerful industry lobbying group), biopharmaceutical companies reported spending around US$ 83.0 Billion on R&D in 2019. Investments in biopharmaceutical innovation are driving contributions to the economies of various countries. The biopharmaceutical industry supports 4.7 million Jobs across the US, and over 800,000 employees are working daily to create new treatments and cures for patients.

In addition, manufacturers are developing microfiltration units that use large filter cartridges rather than an amalgamation of many small filtration units. The system would occupy a smaller area. This would reduce the number of connections with the filtration system and lower the maintenance cost.

High demand exists for mechanically strong membranes that can tolerate chemical cleanings and still have good selectivity and permeability. Multidisciplinary improvements have resulted in the production of polymeric, inorganic, composite, and biomimetic membranes.

During the foreseeable years, these factors are expected to provide lucrative growth opportunities in the pharmaceutical filtration market.

Sabyasachi Ghosh
Sabyasachi Ghosh
Principal Consultant
LinkedIn
Talk to Analyst

Find your sweet spots for generating winning opportunities in this market.

Talk to Analyst

What are the Factors Restraining Demand in Pharmaceutical Filtration Market?

The production of membrane filtration demands a considerable amount of raw materials. Supply and demand govern the pricing and availability of the necessary raw materials. Additionally, the limitations, disruptions, and lack of resources on the market may push production prices and ultimately cause it to halt.

Various low-cost alternatives to traditional materials, like alumina and zirconia, have been investigated. As a result, the global pharmaceutical filtration market's growth is being hampered.

After 2-3 years of operation, polymeric microfiltration membranes and related systems encounter a significant increase in pressure in the membrane due to permanent degradation in almost all of the sectors they are utilised in. Increased membrane pressure reduces membrane life, increases power usage and expense, and subsequently boosts maintenance costs. These factors cumulatively will impede the expansion of the pharmaceutical filtration market.

Country-Wise Insights

What Makes the U.S. a Highly Lucrative Pharmaceutical Filtration Market?

Presence of Leading Pharmaceutical Companies in the U.S. to Aid the Sales

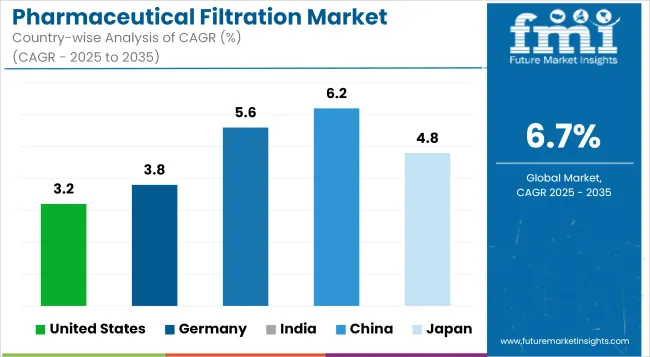
The U.S. held approximately a 21.9% share in the global market in 2021. This can be attributed to the large presence of leading pharmaceutical companies like Pfizer, Johnson & Johnson, etc. Moreover, with R&D and production activities on the rise, the pharmaceutical sector undergoes rigorous overlooking from regulatory bodies governing the quality of pharmaceuticals produced. These factors promote the market for pharmaceutical filtration in the U.S.

Will Demand in China Pharmaceutical Filtration Market Surge at a Rapid Pace?

Pharmaceutical Filtration Manufacturers Establishing Production Units in China to Gain Revenue

China held approximately a 6.9% share in the global market in 2021. With the presence of numerous CROs for pharmaceutical manufacturing, the market for pharmaceutical filtration is set to gain traction in China over the forecast period. Moreover, the key manufacturers are establishing new production units within the country to preserve their market presence in developing nations.

What is the Outlook of Germany Pharmaceutical Filtration Market?

Increased Product Launches and Advancements in Pharma Sector to Spur Demand

Germany held a market share of around 3.9% in 2021. This is because market participants like Koch Membrane Systems, Merck KGA, etc., are making new launches and growth efforts to establish themselves as the market's dominant figure.

For instance, Merck spent over €440 million to grow its membrane filtration business. These industry advancements are driving up demand for pharmaceutical filtration and fostering market expansion.

MarketNage
Become a MarketNgage Insider

A unified Market Research Subscription Platform, built for today's disparate research needs.

Category-Wise Insights

Which Product is Driving Growth for Pharmaceutical Filtration Market?

Membrane Filters to Account for over 1/3rd of Pharmaceutical Filtration Sales

Membrane filters presented high growth at a CAGR of 10.6% by the end of 2021, with a projected market share of about 33.3%. Membrane filtration are more affordable than those of several alternative technologies. They also have lower energy expenses and installation costs. This segment, hence, is expected to promote the growth in the pharmaceutical filtration market.

Which Technology will Benefit the Most in Pharmaceutical Filtration Market?

Microfiltration to be the Most Preferred Technology in Pharmaceutical Filtration Market

Microfiltration held the highest market share of around 32.4% in 2021, as per FMI. The growing prevalence of waterborne disease diseases and the increasing need for good quality water has driven this segment to be a dominant fragment. This technology is considered effective during the pharmaceutical process, propelling the overall pharmaceutical filtration sales.

Competitive Landscape

As per FMI, the overall pharmaceutical filtration market is highly fragmented with several competitors in the production sphere. To meet consumer demand and expand their customer base, these companies are implementing methods such as mergers and acquisitions, partnerships and collaborations, and new product launches.

  • In October 2021, 3M Health Care and Thermo Fisher Scientific collaborated to increase process efficiency and scalability in commercial therapeutic manufacturing.
  • In May 2021, Meissner secured around US$ 13.4 million contract from BARDA, the U.S. government agency, to bolster the production capability for components needed for vaccines and therapies. The company would be manufacturing single-use systems for filtration, filling assemblies, bottle assemblies and bio-container assemblies, etc.

Report Scope as per Pharmaceutical Filtration Market Analysis

Attribute

Details

Estimated Market Value 2022

US$ 17.8 Bn

Projected Market Value 2032

US$ 41.0 Bn

CAGR 2022-2032

8.7%

Forecast Period

2017-2021

Historical Data Available for

2022-2032

Market Analysis

US$ Mn for Value

Key Regions Covered

North America, Latin America, Europe, South Asia, East Asia, Oceania, and Middle East & Africa

Key Countries Covered

US, Canada, Mexico, Brazil, Argentina, Germany, Italy, France, UK, Spain, BENELUX, Russia, India, Indonesia, Malaysia, Thailand, China, Japan, South Korea, Australia, New Zealand, GCC, Turkey, South Africa, North Africa

Key Market Segments Covered

Product type, Scale of Operation, Technology and Region

Key Companies Profiled

  • 3M
  • Amazon Filters
  • Eaton Corporation Plc
  • GE Healthcare Inc.
  • Merck KGaA
  • Pall Corporation
  • Parker Hannifin Corporation
  • Meissner Filtration Products
  • Sartorius Stedim Biotech
  • The Marmon Group LLC.
  • Koch Membrane Systems

Key Market Segments Covered in Pharmaceutical Filtration Industry Research

By Product:

  • Membrane Filters
  • Prefilters and Depth Media Filters
  • Single-use Systems
  • Cartridge & Capsule Filters
  • Filter Holders
  • Filtration Accessories
  • Other Products

By Scale of Operation:

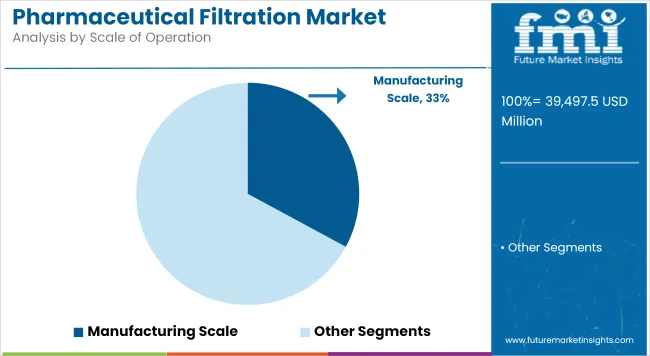
  • Manufacturing Scale
  • Pilot Scale
  • R&D Scale Application
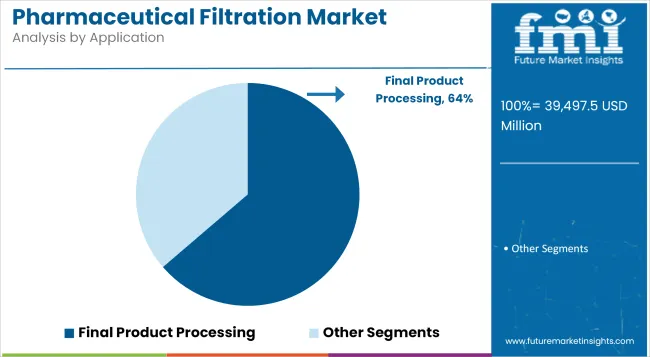
  • Final Product Processing
  • Raw Material Filtration
  • Cell Separation
  • Water Purification
  • Air Purification

By End User:

  • Microfiltration
  • Ultrafiltration
  • Nanofiltration
  • Other techniques

By Region:

  • North America
  • Latin America
  • Europe
  • South Asia
  • East Asia
  • Oceania
  • Middle East and Africa (MEA)

Frequently Asked Questions

The global pharmaceutical filtration market is worth US$ 16.6 Bn in 2021, and is set to expand 2.3 X over the next ten years.

The pharmaceutical filtration market is expected to reach US$ 41.0 Bn by the end of 2032, with sales revenue expected to register 8.7% CAGR.

Increasing R&D Investments, increasing applications in industrial biotechnology, and the growing use of large-molecule biopharmaceuticals, are some of the key drivers in this market.

US, China, Canada, Australia, Japan, and India, are expected to drive demand for the pharmaceutical filtration industry.

North America is one of the key markets for pharmaceutical filtration, accounting for about 27.6% of the pharmaceutical filtration market in the year 2021.

Demand for pharmaceutical filtration market in Europe is expected to register a CAGR of 7.9% over the next ten years.

The US and Germany are the key producers within the pharmaceutical filtration market.

3M, Amazon Filters, Eaton Corporation Plc. GE Healthcare Inc., Merck KGaA, Pall Corporation, Parker Hannifin Corporation, Meissner Filtration Products, Sartorius Stedim Biotech, and The Marmon Group LLC., are some of the key players in the pharmaceutical filtration industry.

China pharmaceutical filtration market held a market share of around 6.9% in 2021.

The pharmaceutical filtration market in Japan holds a market share of around 4.8% within the global market.

Table of Content

1. Executive Summary

    1.1. Global Market Outlook

    1.2. Demand Side Trends

    1.3. Supply Side Trends

    1.4. Analysis and Recommendations

2. Market Overview

    2.1. Market Coverage / Taxonomy

    2.2. Market Definition / Scope / Limitations

    2.3. Inclusions and Exclusions

3. Key Market Trends

    3.1. Key Trends Impacting the Market

    3.2. Product Development and Innovation Trends

4. Key Success Factors

    4.1. Product USPs/Features

    4.2. Product Adoption Analysis by Region

    4.3. Key Industry Developments

    4.4. Regulatory Landscape

    4.5. Reimbursement Scenario

    4.6. Key Promotional Strategies

    4.7. Technology Assessment

    4.8. Porter’s Analysis

    4.9. PESTLE Analysis

    4.10. Value Chain Analysis

5. Market Background

    5.1. Macro-Economic Factors

        5.1.1. Global GDP Growth Outlook

        5.1.2. Global Healthcare Expenditure Outlook

        5.1.3. Global Filtration & Separation Market

    5.2. Forecast Factors - Relevance & Impact

        5.2.1. Growing Investment in Healthcare Sector

        5.2.2. Rising Prevalence of Diseases

        5.2.3. New Product Launches

        5.2.4. Regulatory Dynamics

        5.2.5. Key Strategic Developments

        5.2.6. Biopharmaceutical Industry Growth

    5.3. Market Dynamics

        5.3.1. Drivers

        5.3.2. Restraints

        5.3.3. Opportunity Analysis

6. COVID-19 Crisis – Impact Assessment

    6.1. COVID19 and Impact Analysis

        6.1.1. By Product

        6.1.2. By Scale of Operation

        6.1.3. By Technology

        6.1.4. By Country

7. Global Market Volume (Units) Analysis 2017-2021 and Forecast, 2022–2032

    7.1. Historical Market Volume (Units) Analysis, 2017-2021

    7.2. Current and Future Market Volume (Units) Projections, 2022–2032

        7.2.1. Y-o-Y Growth Trend Analysis

8. Global Market - Pricing Analysis

    8.1. Region-wise Analysis By Product

    8.2. Pricing Break-up

        8.2.1. Manufacturer Level Pricing

        8.2.2. Distributor Level Pricing

    8.3.  Global Average Pricing Analysis Benchmark

9. Global Market Demand (in Value or Size in US$ Mn) Analysis 2017-2021 and Forecast, 2022–2032

    9.1. Historical Market Value (US$ Mn) Analysis, 2017-2021

    9.2. Current and Future Market Value (US$ Mn) Projections, 2022–2032

        9.2.1. Y-o-Y Growth Trend Analysis

        9.2.2. Absolute $ Opportunity Analysis

10. Global Market Analysis 2017-2021 and Forecast 2022–2032, By Product

    10.1. Introduction / Key Findings

    10.2. Historical Market Size (US$ Mn) and Volume (Units) Analysis, By Product, 2017-2021

    10.3. Current and Future Market Size (US$ Mn) and Volume (Units) Analysis, By Product, 2022–2032

        10.3.1. Membrane Filters

        10.3.2. Prefilters and Depth Media Filters

        10.3.3. Single-use Systems

        10.3.4. Cartridge & Capsule Filters

        10.3.5. Filter Holders

        10.3.6. Filtration Accessories

        10.3.7. Other Products

    10.4. Market Attractiveness Analysis By Product

11. Global Market Analysis 2017-2021 and Forecast 2022–2032, By Scale of Operation

    11.1. Introduction / Key Findings

    11.2. Historical Market Size (US$ Mn) Analysis By Scale of Operation , 2017-2021

    11.3. Current and Future Market Size (US$ Mn) Analysis By Scale of Operation , 2022–2032

        11.3.1. Manufacturing Scale

        11.3.2. Pilot Scale

        11.3.3. R&D Scale Application

        11.3.4. Final Product Processing

        11.3.5. Raw Material Filtration

        11.3.6. Cell Separation

        11.3.7. Water Purification

        11.3.8. Air Purification

    11.4. Market Attractiveness Analysis By Scale of Operation

12. Global Market Analysis 2017-2021 and Forecast 2022–2032, By Technology

    12.1. Introduction / Key Findings

    12.2. Historical Market Size (US$ Mn) Analysis, By Technology, 2017-2021

    12.3. Current and Future Market Size (US$ Mn) Analysis By Technology, 2022–2032

        12.3.1. Microfiltration

        12.3.2. Ultrafiltration

        12.3.3. Nanofiltration

        12.3.4. Other techniques

    12.4. Market Attractiveness Analysis By Technology

13. Global Market Analysis 2017-2021 and Forecast 2022–2032, By Region

    13.1. Introduction

    13.2. Historical Market Size (US$ Mn) and Volume (Units) Analysis By Region, 2017-2021

    13.3. Current and Future Market Size (US$ Mn) and Volume (Units) Analysis By Region, 2022–2032

        13.3.1. North America

        13.3.2. Latin America

        13.3.3. Europe

        13.3.4. South Asia

        13.3.5. East Asia

        13.3.6. Oceania

        13.3.7. Middle East and Africa (MEA)

    13.4. Market Attractiveness Analysis By Region

14. North America Market Analysis 2017-2021 and Forecast 2022–2032

    14.1. Introduction

    14.2. Historical Market Size (US$ Mn) and Volume (Units) Analysis, By Market Taxonomy, 2017-2021

    14.3. Current and Future Market Size (US$ Mn) and Volume (Units) Analysis, By Market Taxonomy 2022–2032

        14.3.1. By Country

            14.3.1.1. U.S.

            14.3.1.2. Canada

        14.3.2. By Product

        14.3.3. By Scale of Operation

        14.3.4. By Technology

    14.4. Market Attractiveness Analysis

        14.4.1. By Country

        14.4.2. By Product

        14.4.3. By Scale of Operation

        14.4.4. By Technology

    14.5. Market Trends

    14.6. Key Market Participants - Intensity Mapping

    14.7. Drivers and Restraints - Impact Analysis

    14.8. Country Level Analysis & Forecast

        14.8.1. U.S. Market Analysis

            14.8.1.1. .Introduction

            14.8.1.2. Market Analysis and Forecast by Market Taxonomy

                14.8.1.2.1. By Product

                14.8.1.2.2. By Scale of Operation

                14.8.1.2.3. By Technology

        14.8.2. Canada Market Analysis

            14.8.2.1. Introduction

            14.8.2.2. Market Analysis and Forecast by Market Taxonomy

                14.8.2.2.1. By Product

                14.8.2.2.2. By Scale of Operation

                14.8.2.2.3. By Technology

15. Latin America Market Analysis 2017-2021 and Forecast 2022–2032

    15.1. Introduction

    15.2. Historical Market Size (US$ Mn) and Volume (Units) Analysis By Market Taxonomy, 2017-2021

    15.3. Current and Future Market Size (US$ Mn) and Volume (Units) Analysis, By Market Taxonomy, 2022–2032

        15.3.1. By Country

            15.3.1.1. Mexico

            15.3.1.2. Brazil

            15.3.1.3. Argentina

            15.3.1.4. Rest of Latin America

        15.3.2. By Product

        15.3.3. By Scale of Operation

        15.3.4. By Technology

    15.4. Market Attractiveness Analysis

        15.4.1. By Product

        15.4.2. By Scale of Operation

        15.4.3. By Technology

    15.5. Market Trends

    15.6. Key Market Participants - Intensity Mapping

    15.7. Drivers and Restraints - Impact Analysis

    15.8. Country Level Analysis & Forecast

        15.8.1. Mexico Market Analysis

            15.8.1.1. Introduction

            15.8.1.2. Market Analysis and Forecast by Market Taxonomy

                15.8.1.2.1. By Product

                15.8.1.2.2. By Scale of Operation

                15.8.1.2.3. By Technology

        15.8.2. Brazil Market Analysis

            15.8.2.1. Introduction

            15.8.2.2. Market Analysis and Forecast by Market Taxonomy

                15.8.2.2.1. By Product

                15.8.2.2.2. By Scale of Operation

                15.8.2.2.3. By Technology

        15.8.3. Argentina Market Analysis

            15.8.3.1. Introduction

            15.8.3.2. Market Analysis and Forecast by Market Taxonomy

                15.8.3.2.1. By Product

                15.8.3.2.2. By Scale of Operation

                15.8.3.2.3. By Technology

16. Europe Market Analysis 2017-2021 and Forecast 2022–2032

    16.1. Introduction

    16.2. Historical Market Size (US$ Mn) and Volume (Units) Analysis, By Market Taxonomy, 2017-2021

    16.3. Current and Future Market Size (US$ Mn) and Volume (Units) Analysis, By Market Taxonomy, 2022–2032

        16.3.1. By Country

            16.3.1.1. Germany

            16.3.1.2. Italy

            16.3.1.3. France

            16.3.1.4. U.K.

            16.3.1.5. Spain

            16.3.1.6. BENELUX

            16.3.1.7. Russia

            16.3.1.8. Rest of Europe

        16.3.2. By Product

        16.3.3. By Scale of Operation

        16.3.4. By Technology

    16.4. Market Attractiveness Analysis

        16.4.1. By Country

        16.4.2. By Product

        16.4.3. By Scale of Operation

        16.4.4. By Technology

    16.5. Market Trends

    16.6. Key Market Participants - Intensity Mapping

    16.7. Drivers and Restraints - Impact Analysis

    16.8. Country Level Analysis & Forecast

        16.8.1. Germany Market Analysis

            16.8.1.1. Introduction

            16.8.1.2. Market Analysis and Forecast by Market Taxonomy

                16.8.1.2.1. By Product

                16.8.1.2.2. By Scale of Operation

                16.8.1.2.3. By Technology

        16.8.2. Italy Market Analysis

            16.8.2.1. Introduction

            16.8.2.2. Market Analysis and Forecast by Market Taxonomy

                16.8.2.2.1. By Product

                16.8.2.2.2. By Scale of Operation

                16.8.2.2.3. By Technology

        16.8.3. France Market Analysis

            16.8.3.1. Introduction

            16.8.3.2. Market Analysis and Forecast by Market Taxonomy

                16.8.3.2.1. By Product

                16.8.3.2.2. By Scale of Operation

                16.8.3.2.3. By Technology

        16.8.4. U.K. Market Analysis

            16.8.4.1. Introduction

            16.8.4.2. Market Analysis and Forecast by Market Taxonomy

                16.8.4.2.1. By Product

                16.8.4.2.2. By Scale of Operation

                16.8.4.2.3. By Technology

        16.8.5. Spain Market Analysis

            16.8.5.1. Introduction

            16.8.5.2. Market Analysis and Forecast by Market Taxonomy

                16.8.5.2.1. By Product

                16.8.5.2.2. By Scale of Operation

                16.8.5.2.3. By Technology

        16.8.6. BENELUX Market Analysis

            16.8.6.1. Introduction

            16.8.6.2. Market Analysis and Forecast by Market Taxonomy

                16.8.6.2.1. By Product

                16.8.6.2.2. By Scale of Operation

                16.8.6.2.3. By Technology

        16.8.7. Russia Market Analysis

            16.8.7.1. Introduction

            16.8.7.2. Market Analysis and Forecast by Market Taxonomy

                16.8.7.2.1. By Product

                16.8.7.2.2. By Scale of Operation

                16.8.7.2.3. By Technology

17. South Asia Market Analysis 2017-2021 and Forecast 2022–2032

    17.1. Introduction

    17.2. Historical Market Size (US$ Mn) and Volume (Units) Analysis By Market Taxonomy, 2017-2021

    17.3. Current and Future Market Size (US$ Mn) and Volume (Units) Analysis, By Market Taxonomy, 2022–2032

        17.3.1. By Country

            17.3.1.1. India

            17.3.1.2. Indonesia

            17.3.1.3. Malaysia

            17.3.1.4. Thailand

            17.3.1.5. Rest of South Asia

        17.3.2. By Product

        17.3.3. By Scale of Operation

        17.3.4. By Technology

        17.3.5. By End User

    17.4. Market Attractiveness Analysis

        17.4.1. By Country

        17.4.2. By Product

        17.4.3. By Scale of Operation

        17.4.4. By Technology

    17.5. Market Trends

    17.6. Key Market Participants - Intensity Mapping

    17.7. Drivers and Restraints - Impact Analysis

    17.8. Country Level Analysis & Forecast

        17.8.1. India Market Analysis

            17.8.1.1. Introduction

            17.8.1.2. Market Analysis and Forecast by Market Taxonomy

                17.8.1.2.1. By Product

                17.8.1.2.2. By Scale of Operation

        17.8.2. Indonesia Market Analysis

            17.8.2.1. Introduction

            17.8.2.2. Market Analysis and Forecast by Market Taxonomy

                17.8.2.2.1. By Product

                17.8.2.2.2. By Scale of Operation

                17.8.2.2.3. By Technology

        17.8.3. Malaysia Market Analysis

            17.8.3.1. Introduction

            17.8.3.2. Market Analysis and Forecast by Market Taxonomy

                17.8.3.2.1. By Product

                17.8.3.2.2. By Scale of Operation

                17.8.3.2.3. By Technology

        17.8.4. Thailand Market Analysis

            17.8.4.1. Introduction

            17.8.4.2. Market Analysis and Forecast by Market Taxonomy

                17.8.4.2.1. By Product

                17.8.4.2.2. By Scale of Operation

                17.8.4.2.3. By Technology

18. East Asia Market Analysis 2017-2021 and Forecast 2022–2032

    18.1. Introduction

    18.2. Historical Market Size (US$ Mn) and Volume (Units) Analysis By Market Taxonomy, 2017-2021

    18.3. Current and Future Market Size (US$ Mn) and Volume (Units) Analysis, By Market Taxonomy, 2022–2032

        18.3.1. By Country

            18.3.1.1. China

            18.3.1.2. Japan

            18.3.1.3. South Korea

        18.3.2. By Product

        18.3.3. By Scale of Operation

        18.3.4. By Technology

    18.4. Market Attractiveness Analysis

        18.4.1. By Country

        18.4.2. By Product

        18.4.3. By Scale of Operation

        18.4.4. By Technology

    18.5. Market Trends

    18.6. Key Market Participants - Intensity Mapping

    18.7. Drivers and Restraints - Impact Analysis

    18.8. Country Level Analysis & Forecast

        18.8.1. China Market Analysis

            18.8.1.1. Introduction

            18.8.1.2. Market Analysis and Forecast by Market Taxonomy

                18.8.1.2.1. By Product

                18.8.1.2.2. By Scale of Operation

                18.8.1.2.3. By Technology

        18.8.2. Japan Market Analysis

            18.8.2.1. Introduction

            18.8.2.2. Market Analysis and Forecast by Market Taxonomy

                18.8.2.2.1. By Product

                18.8.2.2.2. By Scale of Operation

                18.8.2.2.3. By Technology

        18.8.3. South Korea Market Analysis

            18.8.3.1. Introduction

            18.8.3.2. Market Analysis and Forecast by Market Taxonomy

                18.8.3.2.1. By Product

                18.8.3.2.2. By Scale of Operation

                18.8.3.2.3. By Technology

19. Oceania Market 2017-2021 and Forecast 2022-2032

    19.1. Introduction

    19.2. Historical Market Size (US$ Mn) and Volume (Units) Analysis By Market Taxonomy, 2017-2021

    19.3. Current and Future Market Size (US$ Mn) and Volume (Units) Analysis, By Market Taxonomy, 2022–2032

        19.3.1. By Country

            19.3.1.1. Australia

            19.3.1.2. New Zealand

        19.3.2. By Product

        19.3.3. By Scale of Operation

        19.3.4. By Technology

    19.4. Market Attractiveness Analysis

        19.4.1. By Product

        19.4.2. By Scale of Operation

        19.4.3. By Technology

    19.5. Market Trends

    19.6. Key Market Participants - Intensity Mapping

    19.7. Drivers and Restraints - Impact Analysis

    19.8. Country Level Analysis & Forecast

        19.8.1. Australia Market Analysis

            19.8.1.1. Introduction

            19.8.1.2. Market Analysis and Forecast by Market Taxonomy

                19.8.1.2.1. By Product

                19.8.1.2.2. By Scale of Operation

                19.8.1.2.3. By Technology

        19.8.2. New Zealand Market Analysis

            19.8.2.1. Introduction

            19.8.2.2. Market Analysis and Forecast by Market Taxonomy

                19.8.2.2.1. By Product

                19.8.2.2.2. By Scale of Operation

                19.8.2.2.3. By Technology

20. Middle East and Africa (MEA) Market Analysis 2017-2021 and Forecast 2022–2032

    20.1. Introduction

    20.2. Historical Market Size (US$ Mn) and Volume (Units) Analysis By Market Taxonomy, 2017-2021

    20.3. Current and Future Market Size (US$ Mn) and Volume (Units) Analysis, By Market Taxonomy, 2022–2032

        20.3.1. By Country

            20.3.1.1. GCC Countries

            20.3.1.2. South Africa

            20.3.1.3. North Africa

            20.3.1.4. Turkey

            20.3.1.5. Rest of Middle East and Africa

    20.4. By Product

    20.5. By Scale of Operation

    20.6. By Technology

    20.7. Market Attractiveness Analysis

        20.7.1. By Country

        20.7.2. By Product

        20.7.3. By Scale of Operation

        20.7.4. By Technology

    20.8. Market Trends

    20.9. Key Market Participants - Intensity Mapping

    20.10. Drivers and Restraints - Impact Analysis

    20.11. Country Level Analysis & Forecast

        20.11.1. GCC Countries Market Analysis

            20.11.1.1. Introduction

            20.11.1.2. Market Analysis and Forecast by Market Taxonomy

                20.11.1.2.1. By Product

                20.11.1.2.2. By Scale of Operation

                20.11.1.2.3. By Technology

        20.11.2. Turkey Market Analysis

            20.11.2.1. Introduction

            20.11.2.2. Market Analysis and Forecast by Market Taxonomy

                20.11.2.2.1. By Product

                20.11.2.2.2. By Scale of Operation

                20.11.2.2.3. By Technology

        20.11.3. South Africa Market Analysis

            20.11.3.1. Introduction

            20.11.3.2. Market Analysis and Forecast by Market Taxonomy

                20.11.3.2.1. By Product

                20.11.3.2.2. By Scale of Operation

                20.11.3.2.3. By Technology

        20.11.4. North Africa Market Analysis

            20.11.4.1. Introduction

            20.11.4.2. Market Analysis and Forecast by Market Taxonomy

                20.11.4.2.1. By Product

                20.11.4.2.2. By Scale of Operation

                20.11.4.2.3. By Technology

21. Market Structure Analysis

    21.1. Market Analysis by Tier of Companies

    21.2. Market Share Analysis of Top Players

    21.3. Market Presence Analysis

        21.3.1. By Regional footprint of Players

        21.3.2. Product footprint by Players

        21.3.3. Channel Foot Print by Players

22. Competition Analysis

    22.1. Competition Dashboard

    22.2. Competition Benchmarking

    22.3. Competition Deep Dive (Tentative List)

        22.3.1. 3M

            22.3.1.1. Overview

            22.3.1.2. Product Portfolio

            22.3.1.3. Key Financials

            22.3.1.4. SWOT Analysis

            22.3.1.5. Sales Footprint

            22.3.1.6. Key developments

            22.3.1.7. Strategy Overview

                22.3.1.7.1. Marketing Strategies

                22.3.1.7.2. Channel Strategies

        22.3.2. Amazon Filters

            22.3.2.1. Overview

            22.3.2.2. Product Portfolio

            22.3.2.3. Key Financials

            22.3.2.4. SWOT Analysis

            22.3.2.5. Sales Footprint

            22.3.2.6. Key developments

            22.3.2.7. Strategy Overview

                22.3.2.7.1. Marketing Strategies

                22.3.2.7.2. Channel Strategies

        22.3.3. Eaton Corporation Plc

            22.3.3.1. Overview

            22.3.3.2. Product Portfolio

            22.3.3.3. Key Financials

            22.3.3.4. SWOT Analysis

            22.3.3.5. Sales Footprint

            22.3.3.6. Key developments

            22.3.3.7. Strategy Overview

                22.3.3.7.1. Marketing Strategies

                22.3.3.7.2. Channel Strategies

        22.3.4. GE Healthcare Inc.

            22.3.4.1. Overview

            22.3.4.2. Product Portfolio

            22.3.4.3. Key Financials

            22.3.4.4. SWOT Analysis

            22.3.4.5. Sales Footprint

            22.3.4.6. Key developments

            22.3.4.7. Strategy Overview

                22.3.4.7.1. Marketing Strategies

                22.3.4.7.2. Channel Strategies

        22.3.5. Merck KGaA

            22.3.5.1. Overview

            22.3.5.2. Product Portfolio

            22.3.5.3. Key Financials

            22.3.5.4. SWOT Analysis

            22.3.5.5. Sales Footprint

            22.3.5.6. Key developments

            22.3.5.7. Strategy Overview

                22.3.5.7.1. Marketing Strategies

                22.3.5.7.2. Channel Strategies

        22.3.6. Pall Corporation

            22.3.6.1. Overview

            22.3.6.2. Product Portfolio

            22.3.6.3. Key Financials

            22.3.6.4. SWOT Analysis

            22.3.6.5. Sales Footprint

            22.3.6.6. Key developments

            22.3.6.7. Strategy Overview

                22.3.6.7.1. Marketing Strategies

                22.3.6.7.2. Channel Strategies

        22.3.7. Parker Hannifin Corporation

            22.3.7.1. Overview

            22.3.7.2. Product Portfolio

            22.3.7.3. Key Financials

            22.3.7.4. SWOT Analysis

            22.3.7.5. Sales Footprint

            22.3.7.6. Key developments

            22.3.7.7. Strategy Overview

                22.3.7.7.1. Marketing Strategies

                22.3.7.7.2. Channel Strategies

        22.3.8. Meissner Filtration Products

            22.3.8.1. Overview

            22.3.8.2. Product Portfolio

            22.3.8.3. Key Financials

            22.3.8.4. SWOT Analysis

            22.3.8.5. Sales Footprint

            22.3.8.6. Key developments

            22.3.8.7. Strategy Overview

                22.3.8.7.1. Marketing Strategies

                22.3.8.7.2. Channel Strategies

        22.3.9. Sartorius Stedim Biotech

            22.3.9.1. Overview

            22.3.9.2. Product Portfolio

            22.3.9.3. Key Financials

            22.3.9.4. SWOT Analysis

            22.3.9.5. Sales Footprint

            22.3.9.6. Key developments

            22.3.9.7. Strategy Overview

                22.3.9.7.1. Marketing Strategies

                22.3.9.7.2. Channel Strategies

        22.3.10. The Marmon Group LLC.

            22.3.10.1. Overview

            22.3.10.2. Product Portfolio

            22.3.10.3. Key Financials

            22.3.10.4. SWOT Analysis

            22.3.10.5. Sales Footprint

            22.3.10.6. Key developments

            22.3.10.7. Strategy Overview

                22.3.10.7.1. Marketing Strategies

                22.3.10.7.2. Channel Strategies

        22.3.11. Koch Membrane Systems

            22.3.11.1. Overview

            22.3.11.2. Product Portfolio

            22.3.11.3. Key Financials

            22.3.11.4. SWOT Analysis

            22.3.11.5. Sales Footprint

            22.3.11.6. Key developments

            22.3.11.7. Strategy Overview

                22.3.11.7.1. Marketing Strategies

                22.3.11.7.2. Channel Strategies

23. Assumptions and Acronyms Used

24. Research Methodology
Customize this Report

Let us know your requirement to get
100% FREE customization

List of Tables

Table 01: Global Market Value (US$ Mn) Analysis and Forecast 2017–2032, by Product type

Table 02: Global Market Volume (Units) Analysis and Forecast 2017–2032, by Product type

Table 03: Global Market Value (US$ Mn) Analysis and Forecast 2017–2032, by Scale of Operation

Table 04: Global Market Value (US$ Mn) Analysis and Forecast 2017–2032, by Technology

Table 05: Global Market Value (US$ Mn) Analysis and Forecast 2017–2032, by Region

Table 06: North America Market Value (US$ Mn) Analysis 2017-2021 and Forecast 2022–2032, by Country

Table 07: North America Market Value (US$ Mn) Analysis and Forecast 2017–2032, by Product type

Table 08: North America Market Volume (Units) Analysis and Forecast 2017–2032, by Product type

Table 09: North America Market Value (US$ Mn) Analysis and Forecast 2017–2032, by Scale of Operation

Table 10: North America Market Value (US$ Mn) Analysis and Forecast 2017–2032, by Technology

Table 11: Latin America Market Value (US$ Mn) Analysis 2017-2021 and Forecast 2022–2032, by Country

Table 12: Latin America Market Value (US$ Mn) Analysis and Forecast 2017–2032, by Product type

Table 13: Latin America Market Volume (Units) Analysis and Forecast 2017–2032, by Product type

Table 14: Latin America Market Value (US$ Mn) Analysis and Forecast 2017–2032, by Scale of Operation

Table 15: Latin America Market Value (US$ Mn) Analysis and Forecast 2017–2032, by Technology

Table 16: Europe Market Value (US$ Mn) Analysis 2017-2021 and Forecast 2022–2032, by Country

Table 17: Europe Market Value (US$ Mn) Analysis and Forecast 2017–2032, by Product type

Table 18: Europe Market Volume (Units) Analysis and Forecast 2017–2032, by Product type

Table 19: Europe Market Value (US$ Mn) Analysis and Forecast 2017–2032, by Scale of Operation

Table 20: Europe Market Value (US$ Mn) Analysis and Forecast 2017–2032, by Technology

Table 21: South Asia Market Value (US$ Mn) Analysis 2017-2021 and Forecast 2022–2032, by Country

Table 22: South Asia Market Value (US$ Mn) Analysis and Forecast 2017–2032, by Product type

Table 23: South Asia Market Volume (Units) Analysis and Forecast 2017–2032, by Product type

Table 24: South Asia Market Value (US$ Mn) Analysis and Forecast 2017–2032, by Scale of Operation

Table 25: South Asia Market Value (US$ Mn) Analysis and Forecast 2017–2032, by Technology

Table 26: East Asia Market Value (US$ Mn) Analysis 2017-2021 and Forecast 2022–2032, by Country

Table 27: East Asia Market Value (US$ Mn) Analysis and Forecast 2017–2032, by Product type

Table 28: East Asia Market Volume (Units) Analysis and Forecast 2017–2032, by Product type

Table 29: East Asia Market Value (US$ Mn) Analysis and Forecast 2017–2032, by Scale of Operation

Table 30: East Asia Market Value (US$ Mn) Analysis and Forecast 2017–2032, by Technology

Table 31: Oceania Market Value (US$ Mn) Analysis 2017-2021 and Forecast 2022–2032, by Country

Table 32: Oceania Market Value (US$ Mn) Analysis and Forecast 2017–2032, by Product type

Table 33: Oceania Market Volume (Units) Analysis and Forecast 2017–2032, by Product type

Table 34: Oceania Market Value (US$ Mn) Analysis and Forecast 2017–2032, by Scale of Operation

Table 35: Oceania Market Value (US$ Mn) Analysis and Forecast 2017–2032, by Technology

Table 36: MEA Market Value (US$ Mn) Analysis 2017-2021 and Forecast 2022–2032, by Country

Table 37: MEA Market Value (US$ Mn) Analysis and Forecast 2017–2032, by Product type

Table 38: MEA Market Volume (Units) Analysis and Forecast 2017–2032, by Product type

Table 39: MEA Market Value (US$ Mn) Analysis and Forecast 2017–2032, by Scale of Operation

Table 40: MEA Market Value (US$ Mn) Analysis and Forecast 2017–2032, by Technology
Sabyasachi Ghosh
Principal Consultant
LinkedIn
Talk to Analyst

Find your sweet spots for generating winning opportunities in this market.

Talk to Analyst

List of Charts

Figure 01: Global Market Volume (Units), 2017 – 2021

Figure 02: Global Market Volume (Units) & Y-o-Y Growth (%) Analysis, 2022–2032

Figure 03: Pharmaceutical Filtration, Pricing Analysis per unit (US$), in 2022

Figure 04: Pharmaceutical Filtration, Pricing Forecast per unit (US$), in 2032

Figure 05: Global Market Value (US$ Mn) Analysis, 2017–2021

Figure 06: Global Market Forecast & Y-o-Y Growth, 2022–2032

Figure 07: Global Market Absolute $ Opportunity (US$ Mn) Analysis, 2021–2032

Figure 08: Global Market Value Share (%) Analysis 2022 and 2032, by Product type

Figure 09: Global Market Y-o-Y Growth (%) Analysis 2021-2032, by Product type

Figure 10: Global Market Attractiveness Analysis 2022–2032, by Product type

Figure 11: Global Market Value Share (%) Analysis 2022 and 2032, by Scale of Operation

Figure 12: Global Market Y-o-Y Growth (%) Analysis 2021-2032, by Scale of Operation

Figure 13: Global Market Attractiveness Analysis 2022–2032, by Scale of Operation

Figure 14: Global Market Value Share (%) Analysis 2022 and 2032, by Technology

Figure 15: Global Market Y-o-Y Growth (%) Analysis 2021-2032, by Technology

Figure 16: Global Market Attractiveness Analysis 2022–2032, by Technology

Figure 17: Global Market Value Share (%) Analysis 2022 and 2032, by Region

Figure 18: Global Market Y-o-Y Growth (%) Analysis 2021-2032, by Region

Figure 19: Global Market Attractiveness Analysis 2022–2032, by Region

Figure 20: North America Market Value (US$ Mn) Analysis, 2017–2021

Figure 21: North America Market Value (US$ Mn) Forecast, 2022-2032

Figure 22: North America Market Value Share, by Product type (2022 E)

Figure 23: North America Market Value Share, by Scale of Operation (2022 E)

Figure 24: North America Market Value Share, by Technology (2022 E)

Figure 25: North America Market Value Share, by Country (2022 E)

Figure 26: North America Market Attractiveness Analysis by Product type, 2022–2032

Figure 27: North America Market Attractiveness Analysis by Scale of Operation, 2022–2032

Figure 28: North America Market Attractiveness Analysis by Technology, 2022–2032

Figure 29: North America Market Attractiveness Analysis by Country, 2022–2032

Figure 30: U.S. Market Value Proportion Analysis, 2021

Figure 31: Global Vs. U.S. Growth Comparison

Figure 32: U.S. Market Share Analysis (%) by Product type, 2021 & 2032

Figure 33: U.S. Market Share Analysis (%) by Scale of Operation, 2021 & 2032

Figure 34: U.S. Market Share Analysis (%) by Technology, 2021 & 2032

Figure 35: Canada Market Value Proportion Analysis, 2021

Figure 36: Global Vs. Canada. Growth Comparison

Figure 37: Canada Market Share Analysis (%) by Product type, 2021 & 2032

Figure 38: Canada Market Share Analysis (%) by Scale of Operation, 2021 & 2032

Figure 39: Canada Market Share Analysis (%) by Technology, 2021 & 2032

Figure 40: Latin America Market Value (US$ Mn) Analysis, 2017–2021

Figure 41: Latin America Market Value (US$ Mn) Forecast, 2022-2032

Figure 42: Latin America Market Value Share, by Product type (2022 E)

Figure 43: Latin America Market Value Share, by Scale of Operation (2022 E)

Figure 44: Latin America Market Value Share, by Technology (2022 E)

Figure 45: Latin America Market Value Share, by Country (2022 E)

Figure 46: Latin America Market Attractiveness Analysis by Product type, 2022–2032

Figure 47: Latin America Market Attractiveness Analysis by Scale of Operation, 2022–2032

Figure 48: Latin America Market Attractiveness Analysis by Technology, 2022–2032

Figure 49: Latin America Market Attractiveness Analysis by Country, 2022–2032

Figure 50: Mexico Market Value Proportion Analysis, 2021

Figure 51: Global Vs Mexico Growth Comparison

Figure 52: Mexico Market Share Analysis (%) by Product type, 2021 & 2032

Figure 53: Mexico Market Share Analysis (%) by Scale of Operation, 2021 & 2032

Figure 54: Mexico Market Share Analysis (%) by Technology, 2021 & 2032

Figure 55: Brazil Market Value Proportion Analysis, 2021

Figure 56: Global Vs. Brazil. Growth Comparison

Figure 57: Brazil Market Share Analysis (%) by Product type, 2021 & 2032

Figure 58: Brazil Market Share Analysis (%) by Scale of Operation, 2021 & 2032

Figure 59: Brazil Market Share Analysis (%) by Technology, 2021 & 2032

Figure 60: Argentina Market Value Proportion Analysis, 2021

Figure 61: Global Vs Argentina Growth Comparison

Figure 62: Argentina Market Share Analysis (%) by Product type, 2021 & 2032

Figure 63: Argentina Market Share Analysis (%) by Scale of Operation, 2021 & 2032

Figure 64: Argentina Market Share Analysis (%) by Technology, 2021 & 2032

Figure 65: Europe Market Value (US$ Mn) Analysis, 2017–2021

Figure 66: Europe Market Value (US$ Mn) Forecast, 2022-2032

Figure 67: Europe Market Value Share, by Product type (2022 E)

Figure 68: Europe Market Value Share, by Scale of Operation (2022 E)

Figure 69: Europe Market Value Share, by Technology (2022 E)

Figure 70: Europe Market Value Share, by Country (2022 E)

Figure 71: Europe Market Attractiveness Analysis by Product type, 2022–2032

Figure 72: Europe Market Attractiveness Analysis by Scale of Operation, 2022–2032

Figure 73: Europe Market Attractiveness Analysis by Technology, 2022–2032

Figure 74: Europe Market Attractiveness Analysis by Country, 2022–2032

Figure 75: UK Market Value Proportion Analysis, 2021

Figure 76: Global Vs. UK Growth Comparison

Figure 77: UK Market Share Analysis (%) by Product type, 2021 & 2032

Figure 78: UK Market Share Analysis (%) by Scale of Operation, 2021 & 2032

Figure 79: UK Market Share Analysis (%) by Technology, 2021 & 2032

Figure 80: Germany Market Value Proportion Analysis, 2021

Figure 81: Global Vs. Germany Growth Comparison

Figure 82: Germany Market Share Analysis (%) by Product type, 2021 & 2032

Figure 83: Germany Market Share Analysis (%) by Scale of Operation, 2021 & 2032

Figure 84: Germany Market Share Analysis (%) by Technology, 2021 & 2032

Figure 85: Italy Market Value Proportion Analysis, 2021

Figure 86: Global Vs. Italy Growth Comparison

Figure 87: Italy Market Share Analysis (%) by Product type, 2021 & 2032

Figure 88: Italy Market Share Analysis (%) by Scale of Operation, 2021 & 2032

Figure 89: Italy Market Share Analysis (%) by Technology, 2021 & 2032

Figure 90: France Market Value Proportion Analysis, 2021

Figure 91: Global Vs France Growth Comparison

Figure 92: France Market Share Analysis (%) by Product type, 2021 & 2032

Figure 93: France Market Share Analysis (%) by Scale of Operation, 2021 & 2032

Figure 94: France Market Share Analysis (%) by Technology, 2021 & 2032

Figure 95: Spain Market Value Proportion Analysis, 2021

Figure 96: Global Vs Spain Growth Comparison

Figure 97: Spain Market Share Analysis (%) by Product type, 2021 & 2032

Figure 98: Spain Market Share Analysis (%) by Scale of Operation, 2021 & 2032

Figure 99: Spain Market Share Analysis (%) by Technology, 2021 & 2032

Figure 100: Russia Market Value Proportion Analysis, 2021

Figure 101: Global Vs Russia Growth Comparison

Figure 102: Russia Market Share Analysis (%) by Product type, 2021 & 2032

Figure 103: Russia Market Share Analysis (%) by Scale of Operation, 2021 & 2032

Figure 104: Russia Market Share Analysis (%) by Technology, 2021 & 2032

Figure 105: BENELUX Market Value Proportion Analysis, 2021

Figure 106: Global Vs BENELUX Growth Comparison

Figure 107: BENELUX Market Share Analysis (%) by Product type, 2021 & 2032

Figure 108: BENELUX Market Share Analysis (%) by Scale of Operation, 2021 & 2032

Figure 109: BENELUX Market Share Analysis (%) by Technology, 2021 & 2032

Figure 110: East Asia Market Value (US$ Mn) Analysis, 2017–2021

Figure 111: East Asia Market Value (US$ Mn) Forecast, 2022-2032

Figure 112: East Asia Market Value Share, by Product type (2022 E)

Figure 113: East Asia Market Value Share, by Scale of Operation (2022 E)

Figure 114: East Asia Market Value Share, by Technology (2022 E)

Figure 115: East Asia Market Value Share, by Country (2022 E)

Figure 116: East Asia Market Attractiveness Analysis by Product type, 2022–2032

Figure 117: East Asia Market Attractiveness Analysis by Scale of Operation, 2022–2032

Figure 118: East Asia Market Attractiveness Analysis by Technology, 2022–2032

Figure 119: East Asia Market Attractiveness Analysis by Country, 2022–2032

Figure 120: China Market Value Proportion Analysis, 2021

Figure 121: Global Vs. China Growth Comparison

Figure 122: China Market Share Analysis (%) by Product type, 2021 & 2032

Figure 123: China Market Share Analysis (%) by Scale of Operation, 2021 & 2032

Figure 124: China Market Share Analysis (%) by Technology, 2021 & 2032

Figure 125: Japan Market Value Proportion Analysis, 2021

Figure 126: Global Vs. Japan Growth Comparison

Figure 127: Japan Market Share Analysis (%) by Product type, 2021 & 2032

Figure 128: Japan Market Share Analysis (%) by Scale of Operation, 2021 & 2032

Figure 129: Japan Market Share Analysis (%) by Technology, 2021 & 2032

Figure 130: South Korea Market Value Proportion Analysis, 2021

Figure 131: Global Vs South Korea Growth Comparison

Figure 132: South Korea Market Share Analysis (%) by Product type, 2021 & 2032

Figure 133: South Korea Market Share Analysis (%) by Scale of Operation, 2021 & 2032

Figure 134: South Korea Market Share Analysis (%) by Technology, 2021 & 2032

Figure 135: South Asia Market Value (US$ Mn) Analysis, 2017–2021

Figure 136: South Asia Market Value (US$ Mn) Forecast, 2022-2032

Figure 137: South Asia Market Value Share, by Product type (2022 E)

Figure 138: South Asia Market Value Share, by Scale of Operation (2022 E)

Figure 139: South Asia Market Value Share, by Technology (2022 E)

Figure 140: South Asia Market Value Share, by Country (2022 E)

Figure 141: South Asia Market Attractiveness Analysis by Product type, 2022–2032

Figure 142: South Asia Market Attractiveness Analysis by Scale of Operation, 2022–2032

Figure 143: South Asia Market Attractiveness Analysis by Technology, 2022–2032

Figure 144: South Asia Market Attractiveness Analysis by Country, 2022–2032

Figure 145: India Market Value Proportion Analysis, 2021

Figure 146: Global Vs. India Growth Comparison

Figure 147: India Market Share Analysis (%) by Product type, 2021 & 2032

Figure 148: India Market Share Analysis (%) by Scale of Operation, 2021 & 2032

Figure 149: India Market Share Analysis (%) by Technology, 2021 & 2032

Figure 150: Indonesia Market Value Proportion Analysis, 2021

Figure 151: Global Vs. Indonesia Growth Comparison

Figure 152: Indonesia Market Share Analysis (%) by Product type, 2021 & 2032

Figure 153: Indonesia Market Share Analysis (%) by Scale of Operation, 2021 & 2032

Figure 154: Indonesia Market Share Analysis (%) by Technology, 2021 & 2032

Figure 155: Malaysia Market Value Proportion Analysis, 2021

Figure 156: Global Vs. Malaysia Growth Comparison

Figure 157: Malaysia Market Share Analysis (%) by Product type, 2021 & 2032

Figure 158: Malaysia Market Share Analysis (%) by Scale of Operation, 2021 & 2032

Figure 159: Malaysia Market Share Analysis (%) by Technology, 2021 & 2032

Figure 160: Thailand Market Value Proportion Analysis, 2021

Figure 161: Global Vs. Thailand Growth Comparison

Figure 162: Thailand Market Share Analysis (%) by Product type, 2021 & 2032

Figure 163: Thailand Market Share Analysis (%) by Scale of Operation, 2021 & 2032

Figure 164: Thailand Market Share Analysis (%) by Technology, 2021 & 2032

Figure 165: Oceania Market Value (US$ Mn) Analysis, 2017–2021

Figure 166: Oceania Market Value (US$ Mn) Forecast, 2022-2032

Figure 167: Oceania Market Value Share, by Product type (2022 E)

Figure 168: Oceania Market Value Share, by Scale of Operation (2022 E)

Figure 169: Oceania Market Value Share, by Technology (2022 E)

Figure 170: Oceania Market Value Share, by Country (2022 E)

Figure 171: Oceania Market Attractiveness Analysis by Product type, 2022–2032

Figure 172: Oceania Market Attractiveness Analysis by Scale of Operation, 2022–2032

Figure 173: Oceania Market Attractiveness Analysis by Technology, 2022–2032

Figure 174: Oceania Market Attractiveness Analysis by Country, 2022–2032

Figure 175: Australia Market Value Proportion Analysis, 2021

Figure 176: Global Vs. Australia Growth Comparison

Figure 177: Australia Market Share Analysis (%) by Product type, 2021 & 2032

Figure 178: Australia Market Share Analysis (%) by Scale of Operation, 2021 & 2032

Figure 179: Australia Market Share Analysis (%) by Technology, 2021 & 2032

Figure 180: New Zealand Market Value Proportion Analysis, 2021

Figure 181: Global Vs New Zealand Growth Comparison

Figure 182: New Zealand Market Share Analysis (%) by Product type, 2021 & 2032

Figure 183: New Zealand Market Share Analysis (%) by Scale of Operation, 2021 & 2032

Figure 184: New Zealand Market Share Analysis (%) by Technology, 2021 & 2032

Figure 185: Middle East & Africa Market Value (US$ Mn) Analysis, 2017–2021

Figure 186: Middle East & Africa Market Value (US$ Mn) Forecast, 2022-2032

Figure 187: Middle East & Africa Market Value Share, by Product type (2022 E)

Figure 188: Middle East & Africa Market Value Share, by Scale of Operation (2022 E)

Figure 189: Middle East & Africa Market Value Share, by Technology (2022 E)

Figure 190: Middle East & Africa Market Value Share, by Country (2022 E)

Figure 191: Middle East & Africa Market Attractiveness Analysis by Product type, 2022–2032

Figure 192: Middle East & Africa Market Attractiveness Analysis by Scale of Operation, 2022–2032

Figure 193: Middle East & Africa Market Attractiveness Analysis by Technology, 2022–2032

Figure 194: Middle East & Africa Market Attractiveness Analysis by Country, 2022–2032

Figure 195: GCC Countries Market Value Proportion Analysis, 2021

Figure 196: Global Vs GCC Countries Growth Comparison

Figure 197: GCC Countries Market Share Analysis (%) by Product type, 2021 & 2032

Figure 198: GCC Countries Market Share Analysis (%) by Scale of Operation, 2021 & 2032

Figure 199: GCC Countries Market Share Analysis (%) by Technology, 2021 & 2032

Figure 200: Turkey Market Value Proportion Analysis, 2021

Figure 201: Global Vs. Turkey Growth Comparison

Figure 202: Turkey Market Share Analysis (%) by Product type, 2021 & 2032

Figure 203: Turkey Market Share Analysis (%) by Scale of Operation, 2021 & 2032

Figure 204: Turkey Market Share Analysis (%) by Technology, 2021 & 2032

Figure 205: South Africa Market Value Proportion Analysis, 2021

Figure 206: Global Vs. South Africa Growth Comparison

Figure 207: South Africa Market Share Analysis (%) by Product type, 2021 & 2032

Figure 208: South Africa Market Share Analysis (%) by Scale of Operation, 2021 & 2032

Figure 209: South Africa Market Share Analysis (%) by Technology, 2021 & 2032

Figure 210: North Africa Market Value Proportion Analysis, 2021

Figure 211: Global Vs North Africa Growth Comparison

Figure 212: North Africa Market Share Analysis (%) by Product type, 2021 & 2032

Figure 213: North Africa Market Share Analysis (%) by Scale of Operation, 2021 & 2032

Figure 214: North Africa Market Share Analysis (%) by Technology, 2021 & 2032

Need specific information?

Request Customization

Explore Healthcare Insights

View Reports

Recommendations

Healthcare

Membrane Microfiltration Market

Published : January 2022

Healthcare

Membrane Filter Cartridge Market

Published : September 2017

Healthcare

Laboratory Filtration Devices Market

Published : January 2017

Healthcare

Specialty Active Pharmaceutical Ingredients Market

Published : June 2020

Google translate

Pharmaceutical Filtration Market