The pharmaceutical plastic packaging market is valued at USD 42.3 billion in 2025 and is projected to reach USD 98.3 billion by 2035, rising at an 8.8% CAGR, with expansion driven by the escalating need for drug-safe, regulation-compliant packaging formats across global healthcare systems. Growth is unfolding as pharmaceutical production scales in emerging economies, while mature markets upgrade toward more tamper-evident, high-integrity packaging aligned with stringent safety mandates. As prescription drugs, OTC formulations, biologics, and specialty therapies become more sensitive to contamination, moisture, and chemical degradation, plastics, especially medical-grade polyethylene and polypropylene, remain essential because they combine barrier protection, durability, design flexibility, and certification compatibility without forcing changes in filling-line infrastructure.
Within product segmentation, bottles account for ~47% of demand, anchored in their universal compatibility with tablets, capsules, syrups, and suspensions, along with their dominance in pharmacy dispensing systems. Material selection reinforces this hierarchy: polyethylene holds ~39% share, supported by its chemical resistance, moldability, and stable cost profile. On the application side, prescription drugs and OTC medications collectively represent the largest consumption base, reflecting high-volume manufacturing, strict safety norms, and the necessity of consistent barrier performance across global distribution networks.
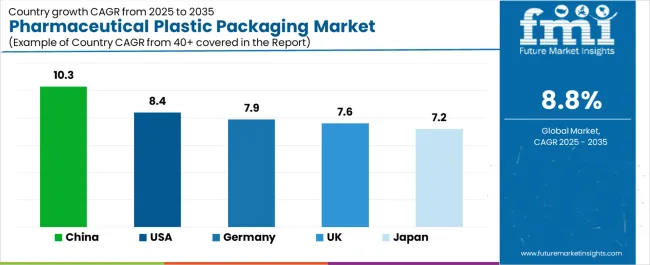
Geographically, growth is led by China (10.3% CAGR) and India (10.8%), driven by rapid pharmaceutical production expansion, government-backed healthcare infrastructure upgrades, and rising adoption of regulated packaging formats. The USA (8.4%), Germany (7.9%), and UK (7.6%) grow through modernization cycles, biologics production, and compliance-driven packaging upgrades rather than new capacity creation. Competitive dynamics favor companies with deep regulatory expertise, material science capabilities, and global supply reach. Amcor, Berry Global, AptarGroup, Gerresheimer, and Alpla hold structural advantage through integrated molding capacity, validated drug-contact materials, and established partnerships with major pharma producers. Emerging players compete via lightweight designs, higher barrier formulations, and improved child-resistant and tamper-evident features rather than price.
A significant share of the momentum comes from the increased production of biologics, vaccines, parenteral drugs, and sensitive formulations that require sterilizable, tamper-evident, and contamination-free containers. Plastic bottles, vials, pre-fillable syringes, blister packs, closures, and dispensing systems support these complex needs more efficiently than many traditional materials. Growth is further supported by the rise of home healthcare, telemedicine-linked drug delivery, and self-administration therapies, all of which favor lightweight, user-friendly plastic packaging that reduces breakage risks and enhances portability.
Manufacturers are responding to evolving regulatory expectations, particularly those concerning sterility assurance, extractables and leachables, and product–pack compatibility. High-performance plastics such as cyclic olefin polymers (COP), cyclic olefin copolymers (COC), HDPE, PP, and PET are increasingly used to ensure consistent protection for sensitive APIs and biologics. The industry is also witnessing a strong shift toward multi-layer structures, advanced barrier coatings, and molded components designed for better heat resistance, higher clarity, and improved chemical inertness.
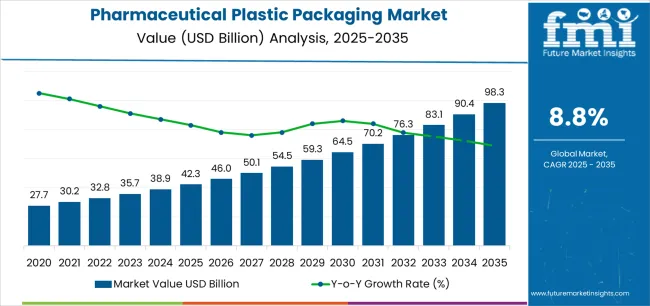
| Metric | Value |
|---|---|
| Estimated Value in (2025E) | USD 42.3 billion |
| Forecast Value in (2035F) | USD 98.3 billion |
| Forecast CAGR (2025 to 2035) | 8.8% |
Market expansion is being supported by the increasing global demand for pharmaceutical safety solutions and the corresponding shift toward regulatory-compliant packaging that can provide superior protective outcomes while meeting user requirements for medication integrity and reliable drug delivery processes. Modern pharmaceutical manufacturers are increasingly focused on incorporating packaging solutions that can enhance drug stability while satisfying demands for durable, consistently performing materials and optimized handling practices. Pharmaceutical plastic packaging's proven ability to deliver protection benefits, medication safety, and diverse application possibilities makes them essential products for quality-conscious manufacturers and healthcare organizations.
The growing emphasis on patient safety and operational efficiency is driving demand for high-quality pharmaceutical plastic packaging that can support distinctive protection outcomes and comprehensive regulatory positioning across prescription medications, over-the-counter drugs, and specialty pharmaceutical categories. User preference for products that combine protective excellence with cost-effectiveness characteristics is creating opportunities for innovative implementations in both traditional and emerging pharmaceutical applications. The rising influence of healthcare standards and medication safety initiatives is also contributing to increased adoption of pharmaceutical plastic packaging that can provide authentic barrier benefits and reliability characteristics.
The market is segmented by product type, material type, end-use application, and region. By product type, the market is divided into bottles, caps & closures, blister packs, prefillable syringes, vials, pouches, and other packaging formats. Based on material type, the market is categorized into polyethylene, polypropylene, polyvinyl chloride, polyethylene terephthalate, and other polymers. By end-use application, the market includes prescription drugs, over-the-counter medications, biologics, medical devices, and other applications. Regionally, the market is divided into North America, Europe, Asia Pacific, Latin America, Middle East & Africa, and other regions.
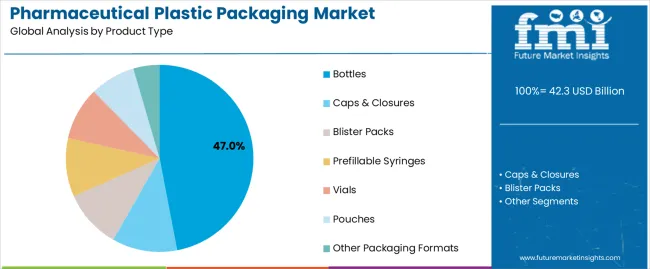
The bottles segment is projected to account for 47% of the pharmaceutical plastic packaging market in 2025, reaffirming its position as the leading product category. Pharmaceutical manufacturers and healthcare organizations increasingly utilize bottles for their superior storage characteristics, established medication containment, and essential functionality in drug packaging applications across diverse pharmaceutical categories. Bottles' standardized compatibility characteristics and proven protective effectiveness directly address user requirements for reliable medication safety and optimal packaging value in pharmaceutical applications.
This product segment forms the foundation of modern pharmaceutical packaging patterns, as it represents the format with the greatest manufacturing acceptance potential and established compatibility across multiple drug delivery systems. Manufacturing investments in packaging optimization and safety standardization continue to strengthen adoption among quality-conscious organizations. With users prioritizing medication integrity and packaging reliability, bottles align with both safety objectives and performance requirements, making them the central component of comprehensive pharmaceutical packaging strategies.
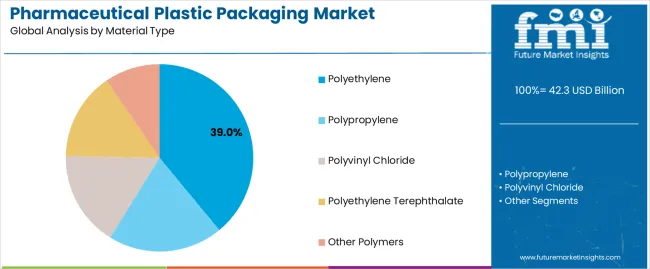
Polyethylene is projected to represent 39% of the pharmaceutical plastic packaging market growth through 2035, underscoring its critical role as the primary choice for cost-focused manufacturers seeking superior flexibility benefits and enhanced processing credentials. Pharmaceutical manufacturers and packaging specialists prefer polyethylene for their enhanced moldability standards, proven chemical resistance superiority, and ability to maintain exceptional barrier profiles while supporting long-term usage during high-volume production experiences. Positioned as essential materials for versatile applications, polyethylene offerings provide both manufacturing excellence and performance advantages.
The segment is supported by continuous improvement in polymer technology and the widespread availability of established production infrastructure that enables quality assurance and competitive positioning at the manufacturing level. Additionally, packaging manufacturers are optimizing polyethylene processing methods to support market differentiation and accessible pricing. As materials technology continues to advance and users seek versatile packaging solutions, polyethylene will continue to drive market growth while supporting drug protection and pharmaceutical handling strategies.
The pharmaceutical plastic packaging market is advancing rapidly due to increasing medication safety consciousness and growing need for regulatory-compliant packaging choices that emphasize superior protective outcomes across healthcare segments and pharmaceutical applications. However, the market faces challenges, including regulatory complexity, material compatibility considerations for sensitive drugs, and supply chain uncertainties affecting pricing stability. Innovation in barrier materials and specialized product development continues to influence market development and expansion patterns.
The growing adoption of pharmaceutical plastic packaging in biologics programs and specialty medication applications is enabling manufacturers to develop packaging patterns that provide distinctive protection benefits while commanding premium positioning and enhanced safety characteristics. Specialty applications provide superior barrier density while allowing more sophisticated drug delivery across various pharmaceutical categories. Manufacturers are increasingly recognizing the competitive advantages of pharmaceutical plastic packaging positioning for premium medication protection and safety-conscious regulatory integration.
Modern pharmaceutical packaging manufacturers are incorporating advanced serialization systems, track-and-trace technologies, and quality management protocols to enhance authentication capabilities, improve patient outcomes, and meet regulatory demands for medication-specific identification solutions. These systems improve packaging effectiveness while enabling new applications, including integrated temperature monitoring and anti-counterfeiting programs. Advanced technology integration also allows manufacturers to support premium market positioning and safety leadership beyond traditional packaging operations.
| Country | CAGR (2025-2035) |
|---|---|
| USA | 8.4% |
| Germany | 7.9% |
| UK | 7.6% |
| China | 10.3% |
| Japan | 7.2% |
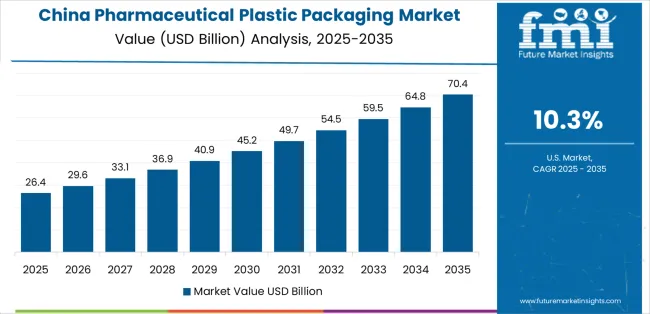
The pharmaceutical plastic packaging market is experiencing robust growth globally, with China leading at a 10.3% CAGR through 2035, driven by the expanding pharmaceutical manufacturing sector, growing healthcare infrastructure, and increasing adoption of advanced packaging technologies. The USA follows at 8.4%, supported by rising biologics production, expanding regulatory requirements, and growing acceptance of innovative packaging solutions. Germany shows growth at 7.9%, emphasizing established pharmaceutical markets and comprehensive quality development. The UK records 7.6%, focusing on premium packaging products and pharmaceutical innovation expansion. Japan demonstrates 7.2% growth, prioritizing quality packaging solutions and technological advancement.
The report covers an in-depth analysis of 40+ countries top-performing countries are highlighted below.
Revenue from pharmaceutical plastic packaging consumption and sales in the USA is projected to exhibit exceptional growth with a CAGR of 8.4% through 2035, driven by the country's rapidly expanding pharmaceutical sector, favorable regulatory attitudes toward innovative solutions, and initiatives promoting medication safety optimization across major manufacturing regions. The USA's position as a leading pharmaceutical market and increasing focus on patient safety development are creating substantial demand for high-quality pharmaceutical plastic packaging in both prescription and over-the-counter markets. Major pharmaceutical manufacturers and specialty packaging providers are establishing comprehensive distribution capabilities to serve growing healthcare demand and emerging safety opportunities.
Revenue from pharmaceutical plastic packaging products in Germany is expanding at a CAGR of 7.9%, supported by rising pharmaceutical sophistication, growing manufacturing precision, and expanding medication safety infrastructure. The country's developing pharmaceutical capabilities and increasing industry investment in quality packaging are driving demand for pharmaceutical plastic packaging across both imported and domestically produced applications. International pharmaceutical companies and domestic manufacturers are establishing comprehensive distribution networks to address growing market demand for quality pharmaceutical plastic packaging and protective solutions.
Revenue from pharmaceutical plastic packaging products in the UK is projected to grow at a CAGR of 7.6% through 2035, supported by the country's mature pharmaceutical market, established regulatory culture, and leadership in quality standards. Britain's sophisticated healthcare infrastructure and strong support for medication safety are creating steady demand for both traditional and innovative pharmaceutical plastic packaging varieties. Leading pharmaceutical manufacturers and specialty packaging providers are establishing comprehensive operational strategies to serve both domestic markets and growing export opportunities.
Revenue from pharmaceutical plastic packaging products in China is projected to grow at a CAGR of 10.3% through 2035, driven by the country's emphasis on pharmaceutical expansion, manufacturing leadership, and sophisticated production capabilities for medications requiring specialized protective varieties. Chinese manufacturers and distributors consistently seek pharmaceutical-grade products that enhance drug protection and support healthcare operations for both traditional and innovative pharmaceutical applications. The country's position as an Asian pharmaceutical leader continues to drive innovation in specialty pharmaceutical plastic packaging applications and regulatory product standards.
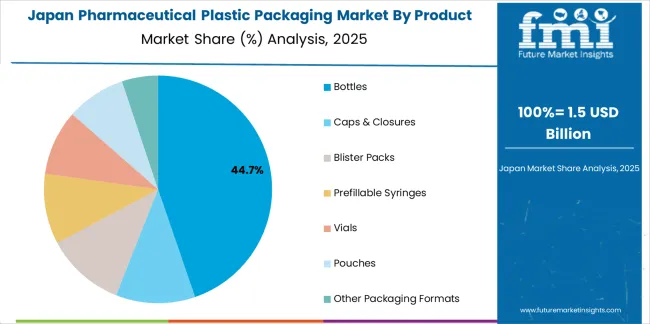
Revenue from pharmaceutical plastic packaging products in Japan is projected to grow at a CAGR of 7.2% through 2035, supported by the country's emphasis on quality pharmaceutical manufacturing, medication safety standards, and advanced technology integration requiring efficient protective solutions. Japanese pharmaceutical professionals and medication handlers prioritize quality performance and precision protection, making pharmaceutical plastic packaging essential components for both traditional and modern healthcare applications. The country's comprehensive pharmaceutical excellence and advancing healthcare patterns support continued market expansion.
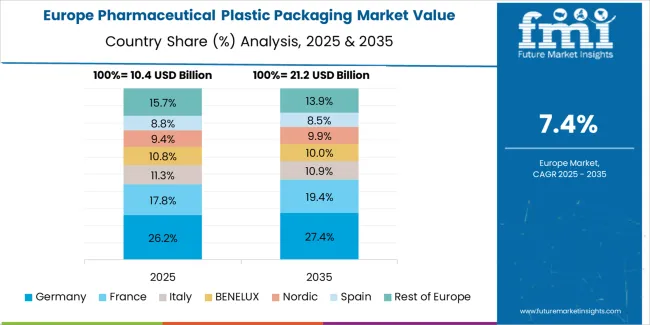
The Europe pharmaceutical plastic packaging market is projected to grow from USD 11.7 billion in 2025 to USD 24.9 billion by 2035, recording a CAGR of 7.8% over the forecast period. Germany leads the region with a 35.0% share in 2025, moderating slightly to 34.5% by 2035, supported by its strong pharmaceutical manufacturing culture and demand for premium, regulatory-compliant pharmaceutical plastic packaging. The United Kingdom follows with 21.0% in 2025, easing to 20.5% by 2035, driven by a sophisticated pharmaceutical market and emphasis on quality and safety standards. France accounts for 19.5% in 2025, rising to 20.0% by 2035, reflecting steady adoption of medication safety solutions and pharmaceutical consciousness.
Italy holds 10.5% in 2025, expanding to 11.2% by 2035 as pharmaceutical modernization and specialty medication applications grow. Spain contributes 7.0% in 2025, growing to 7.5% by 2035, supported by expanding pharmaceutical manufacturing and medication handling. The Nordic countries rise from 4.5% in 2025 to 5.0% by 2035 on the back of strong quality adoption and advanced pharmaceutical integration. BENELUX remains at 2.5% share across both 2025 and 2035, reflecting mature, premium-focused markets.
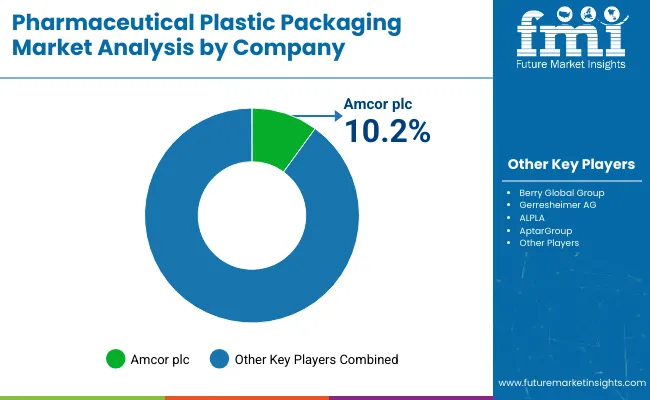
The pharmaceutical plastic packaging market features 12–18 players with moderate concentration, where the top three companies collectively hold around 46–52% of global market share, driven by strong regulatory compliance capabilities, advanced plastic conversion technologies, and long-term partnerships with pharma manufacturers, CMOs, and healthcare distributors. The leading company, Amcor plc, commands roughly 6% of the market share, supported by its extensive portfolio of pharmaceutical-grade bottles, blister films, closures, and sterile barrier solutions. Competition centers on material purity, barrier performance, sterilizability, regulatory certifications, and supply chain reliability rather than price-based competition alone.
Market leaders such as Amcor plc, Berry Global Inc., and AptarGroup Inc. maintain dominant positions by offering high-performance primary packaging solutions including bottles, vials, dispensing systems, and high-barrier films. Their strengths lie in GMP-compliant facilities, strong R&D pipelines, and the ability to meet stringent global regulatory requirements, including FDA, EU, and USP standards.
Challenger companies including Gerresheimer AG, Alpla Group, and CCL Industries Inc. compete through specialized pharmaceutical plastic packaging such as PET bottles, prefillable containers, closures, and labeling-integrated solutions tailored for prescription, OTC, and nutraceutical applications.
Additional competition comes from Constantia Flexibles, Sealed Air Corporation, Sonoco Products Company, and Huhtamaki Oyj, which enhance their positions through advanced flexible formats, sterile packaging, and cost-effective regional manufacturing footprints.
The success of pharmaceutical plastic packaging in meeting healthcare protection demands, medication-driven safety requirements, and quality assurance integration will not only enhance protective outcomes but also strengthen global pharmaceutical capabilities. It will consolidate emerging regions' positions as hubs for efficient packaging manufacturing and align advanced economies with pharmaceutical safety systems. This calls for a concerted effort by all stakeholders -- governments, industry bodies, suppliers, distributors, and investors. Each can be a crucial enabler in preparing the market for its next phase of growth.
How Governments Could Spur Local Production and Adoption?
How Industry Bodies Could Support Market Development?
How Distributors and Healthcare Players Could Strengthen the Ecosystem?
How Suppliers Could Navigate the Shift?
| Items | Values |
|---|---|
| Quantitative Units (2025) | USD 42.3 billion |
| Product Type | Bottles, Caps & Closures, Blister Packs, Prefillable Syringes, Vials, Pouches, Other Packaging Formats |
| Material Type | Polyethylene, Polypropylene, Polyvinyl Chloride, Polyethylene Terephthalate, Other Polymers |
| End-Use Application | Prescription Drugs, Over-the-Counter Medications, Biologics, Medical Devices, Other Applications |
| Regions Covered | North America, Europe, Asia Pacific, Latin America, Middle East & Africa, Other Regions |
| Countries Covered | United States, Germany, United Kingdom, China, Japan, and 40+ countries |
| Key Companies Profiled | Amcor plc, Berry Global Inc., AptarGroup Inc., Gerresheimer AG, Alpla Group, CCL Industries Inc., Constantia Flexibles Group GmbH, Sealed Air Corporation, Sonoco Products Company, and Huhtamaki Oyj |
| Additional Attributes | Dollar sales by product type, material type, end-use application, and region; regional demand trends, competitive landscape, technological advancements in barrier engineering, pharmaceutical design integration initiatives, quality enhancement programs, and premium product development strategies |
The global pharmaceutical plastic packaging market is estimated to be valued at USD 42.3 billion in 2025.
The market size for the pharmaceutical plastic packaging market is projected to reach USD 98.3 billion by 2035.
The pharmaceutical plastic packaging market is expected to grow at a 8.8% CAGR between 2025 and 2035.
The key product types in pharmaceutical plastic packaging market are bottles, caps & closures, blister packs, prefillable syringes, vials, pouches and other packaging formats.
In terms of material type, polyethylene segment to command 39.0% share in the pharmaceutical plastic packaging market in 2025.


Our Research Products

The "Full Research Suite" delivers actionable market intel, deep dives on markets or technologies, so clients act faster, cut risk, and unlock growth.

The Leaderboard benchmarks and ranks top vendors, classifying them as Established Leaders, Leading Challengers, or Disruptors & Challengers.

Locates where complements amplify value and substitutes erode it, forecasting net impact by horizon

We deliver granular, decision-grade intel: market sizing, 5-year forecasts, pricing, adoption, usage, revenue, and operational KPIs—plus competitor tracking, regulation, and value chains—across 60 countries broadly.

Spot the shifts before they hit your P&L. We track inflection points, adoption curves, pricing moves, and ecosystem plays to show where demand is heading, why it is changing, and what to do next across high-growth markets and disruptive tech

Real-time reads of user behavior. We track shifting priorities, perceptions of today’s and next-gen services, and provider experience, then pace how fast tech moves from trial to adoption, blending buyer, consumer, and channel inputs with social signals (#WhySwitch, #UX).

Partner with our analyst team to build a custom report designed around your business priorities. From analysing market trends to assessing competitors or crafting bespoke datasets, we tailor insights to your needs.
Supplier Intelligence
Discovery & Profiling
Capacity & Footprint
Performance & Risk
Compliance & Governance
Commercial Readiness
Who Supplies Whom
Scorecards & Shortlists
Playbooks & Docs
Category Intelligence
Definition & Scope
Demand & Use Cases
Cost Drivers
Market Structure
Supply Chain Map
Trade & Policy
Operating Norms
Deliverables
Buyer Intelligence
Account Basics
Spend & Scope
Procurement Model
Vendor Requirements
Terms & Policies
Entry Strategy
Pain Points & Triggers
Outputs
Pricing Analysis
Benchmarks
Trends
Should-Cost
Indexation
Landed Cost
Commercial Terms
Deliverables
Brand Analysis
Positioning & Value Prop
Share & Presence
Customer Evidence
Go-to-Market
Digital & Reputation
Compliance & Trust
KPIs & Gaps
Outputs
Full Research Suite comprises of:
Market outlook & trends analysis
Interviews & case studies
Strategic recommendations
Vendor profiles & capabilities analysis
5-year forecasts
8 regions and 60+ country-level data splits
Market segment data splits
12 months of continuous data updates
DELIVERED AS:
PDF EXCEL ONLINE
Market Share Breakdown of Pharmaceutical Plastic Packaging
Plastic Packaging For Food and Beverage Market Size and Share Forecast Outlook 2025 to 2035
Plastic Packaging Market Size and Share Forecast Outlook 2025 to 2035
Plastic Jar Packaging Market Forecast and Outlook 2025 to 2035
Competitive Overview of Plastic Jar Packaging Companies
Plastic-free Packaging Market Size and Share Forecast Outlook 2025 to 2035
Plastic Tube Packaging Market Size and Share Forecast Outlook 2025 to 2035
Bioplastic Packaging Bag Market Growth – Demand & Forecast 2025 to 2035
Pharmaceutical Plastic Bottle Market Forecast and Outlook 2025 to 2035
Pharmaceutical Packaging Market Size and Share Forecast Outlook 2025 to 2035
Pharmaceutical Plastic Pots Market Size and Share Forecast Outlook 2025 to 2035
Pharmaceutical Packaging Machine Market Size and Share Forecast Outlook 2025 to 2035
Pharmaceutical Packaging Equipment Market Size, Share & Forecast 2025 to 2035
Market Share Breakdown of Pharmaceutical Packaging Companies
PCR Plastic Packaging Market Size and Share Forecast Outlook 2025 to 2035
Plastic Aerosol Packaging Market
Plastic Healthcare Packaging Market Size and Share Forecast Outlook 2025 to 2035
Plastic Healthcare Packaging Industry Analysis in Western Europe Size and Share Forecast Outlook 2025 to 2035
Plastic Healthcare Packaging Industry Analysis in Korea Size and Share Forecast Outlook 2025 to 2035
Plastic Healthcare Packaging Industry Analysis in Japan Size and Share Forecast Outlook 2025 to 2035

Thank you!
You will receive an email from our Business Development Manager. Please be sure to check your SPAM/JUNK folder too.
Chat With
MaRIA