Pharmaceutical Tubes Market Size, Share & Forecast 2025 to 2035

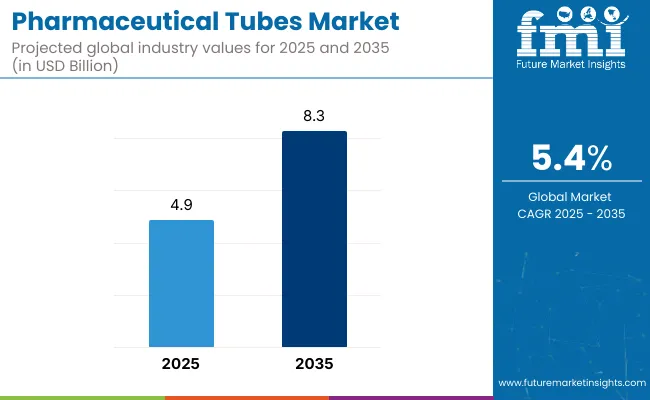
The pharmaceutical tubes market is projected to grow from USD 4.9 billion in 2025 to USD 8.3 billion by 2035, at a CAGR of 5.4%. The estimated 2024 sales value stood at USD 4.5 billion. Growth is being propelled by the increasing demand for topical and transdermal drug delivery systems, which favor tubes for their hygiene, portability, and precision. Aluminum, laminate, and plastic tube formats continue to support antibiotic creams, gels, and dermatology applications in both OTC and prescription drugs. Regulatory push for single-use formats post-COVID has further accelerated demand across hospital and clinical supply chains.
Quick Stats of Pharmaceutical Tubes Market

  • Market Value (2025): USD 4.9 billion
  • Forecast Value (2035): USD 8.3 billion
  • Forecast CAGR: 5.4%
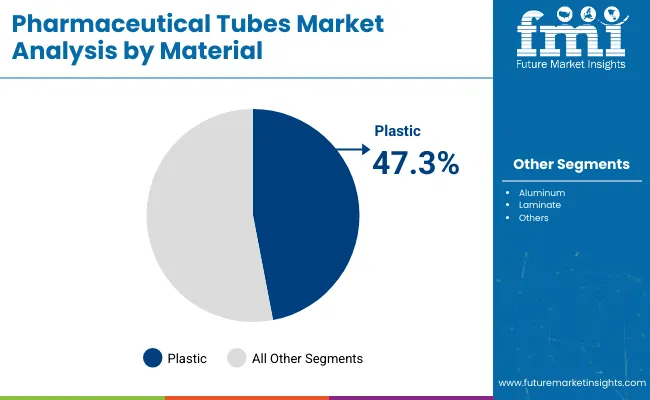
  • Material Type Leader in 2025: Plastic (47.3% market share)
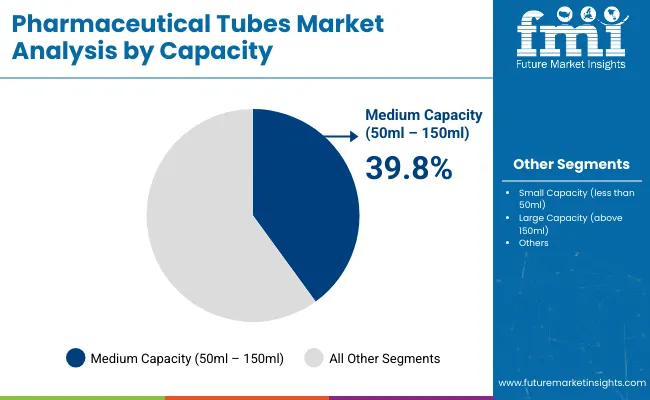
  • Top Capacity: Medium capacity (50ml-150ml) (39.8% share)
  • Key Growth Country: North America (USA is the fastest-growing market with 7.5% CAGR)

Pharmaceutical Tubes Market

Metric Value
Industry Size (2025E) USD 4.9 billion
Industry Value (2035F) USD 8.3 billion
CAGR (2025 to 2035) 5.4%

Recent innovation in pharmaceutical tubes includes multi-layer laminate structures with integrated tamper-evident and child-resistant closures. Barrier enhancements using EVOH, aluminum foils, and UV-cured coatings are extending shelf life for temperature-sensitive drugs. Manufacturers are deploying digital printing and traceability features to meet serialization and anti-counterfeit regulations. New ergonomic dispensing tips and unit-dose tube systems are also improving patient compliance, especially in home care and pediatric markets.

Future market dynamics will be shaped by global pharmacovigilance laws, regional GMP enforcement, and patient safety standards. Companies are expected to prioritize packaging formats that ensure sterility, dosing accuracy, and extended usability. Digital integration with tamper alerts and e-labels is likely to gain ground. As pharmaceutical brands align more with ESG goals, demand for recyclable and bio-based tubes will offer competitive advantages across supply contracts and tender bids.

Analyzing Pharmaceutical Tubes Market by Top Investment Segment

The market has been segmented based on material type, product type, end-user, application, capacity, and region. Material types including plastic, aluminum, and laminate have been selected to meet regulatory requirements, barrier performance, and sustainability initiatives across dosage forms. Product types such as squeeze tubes, twist tubes, and crimped tubes have been adopted to deliver user convenience, controlled dispensing, and compatibility with various formulations. Applications have been segmented into ointments, creams, and gels, enabling packaging designs to align with viscosity, dosage precision, and patient compliance needs.

Regional segmentation has been carried out across North America, Europe, Asia Pacific, Latin America, and the Middle East & Africa to reflect packaging innovation, pharmaceutical manufacturing presence, and regulatory alignment across developed and emerging markets.
Plastic Gaining Traction for Its Flexibility and Barrier Properties

Pharmaceutical Tubes Market By Material

A 47.3% share of the pharmaceutical tubes market in 2025 is expected to be held by plastic due to its lightweight, durable, and chemically resistant nature. Materials such as LDPE, HDPE, and laminated plastic have been commonly adopted for ointments, creams, and gels. These plastics have offered customizable barrier levels for moisture and light-sensitive formulations. Compatibility with high-speed filling equipment has enhanced their industrial value.

Extrusion flexibility has enabled the creation of multi-layer plastic tubes tailored for specific drug packaging needs. Their robustness under various storage temperatures has suited prescription and over-the-counter medications alike. Tamper-evident features and labeling efficiency have improved traceability and patient safety. Plastic has continued to dominate due to cost-efficiency and regulatory compliance benefits.
Medium Capacity Tubes Favored for Daily Dose and Storage Balance

Pharmaceutical Tubes Market Bay Capacity

A 39.8% share of the market in 2025 is projected to be accounted by the medium capacity segment (50ml-150ml), driven by demand for portability and adequate dosing. These formats have been widely used for topical treatments, dermatological products, and oral gels. They have struck a balance between shelf life, patient convenience, and storage efficiency. Manufacturers have preferred these tubes for product line standardization.

Medium-sized pharmaceutical tubes have offered favorable volume-to-surface ratios for product integrity. Drug companies have relied on this size for product trials, physician samples, and direct-to-consumer packs. The segment has also aligned with international labeling requirements and unit-dose packaging strategies. Functional closures and ergonomic design have reinforced usability in hospital and retail environments.

Pharmaceutical Tubes Market: Market Outlook

Pharmaceutical Tube is a hollow cylindrical container used as a packaging solution for ointment, creams and many other pharmaceutical products such as dental care toothpaste and skin repair creams. The tubes are having a wide range of pharmaceutical applications, as they offer a cost-effective, safe and tamper-proof packaging solution to pharmaceutical companies.

In recent years many companies have shifted from traditional packaging to tube packaging due to its space-saving design and easy to use features. The overall market for these tubes has witnessed sharp growth in the last decade and is expected to register exponential growth over the forecasted period.

Which Factors Are Driving Growth of The Pharmaceutical Tubes Market?

The tubes made up from materials like Aluminum, Plastic and mixed laminates of Plastic and Aluminum are durable and the availability of tubes in all sizes makes it a primary choice for small as well as giant market players of the pharmaceutical industry.

Rising awareness about the skin and oral diseases among the increasingly educated consumer bases in all parts of the world, along with additional shelf life offered by these tubes. All these factors are major driving forces of the pharmaceutical tube market in the upcoming decade.

What Limits The Growth of Pharmaceutical Tubes Market?

The waste generated by pharmaceutical tubes is not 100% recyclable, further, the chemical coating used on the outer protection of the tube has negative emissions on the environment.

Also, the stringent rules and regulations restricting usage of pollutant materials in the countries like the USA, Germany regarding usage of raw material used for producing the packaging for pharmaceutical products. Above mentioned factors could hamper the expected growth rate of the pharmaceutical tubes market.

Which Lucrative Opportunities Are Offered By Pharmaceutical Tubes Market?

The innovation-driven packaging industry has come up with bio-degradable materials as a result of continuous research & development. Recyclability of the same raw materials like Aluminum and Plastics is enhanced by mixing strength and reducing its carbon impact, the pharmaceutical tubes made up of eco-friendly raw materials offer massive opportunities to the manufacturers.

Also, technological advancements in the field of production and logistical chains have enabled top manufacturers to multiply their production capacity and take full advantage of these opportunities by developed as well as untapped markets.

Key Market Players of Pharmaceutical Tubes Market

  • ALLTUB
  • Albea Group
  • Hoffmann Neopac
  • Huhtamaki
  • CCL Industries
  • MONTEBELLO PACKAGING
  • Unette Corporation
  • Romaco Group
  • EPL LIMITED
  • Neelam Global
  • BRK Packwell Private
  • Almin Extrusion
  • Antilla Propack
  • Prutha Packaging

Key Market Players in Asia-Pacific Region of Pharmaceutical Tubes Market

  • EPL LIMITED
  • Neelam Global Pvt. Ltd.
  • BRK Packwell Private Limited
  • Almin Extrusion
  • Antilla Propack
  • Prutha Packaging Pvt. Ltd.

Why Are India and China Major Markets For Global Pharmaceutical Tubes Market?

The rapid development of industrial infrastructure in fast-paced economies like India and China, along with the easy availability of raw materials like plastics and Aluminum for the production of pharmaceutical tubes makes them major growth regions.

The entry of global giants in the region along with newer entrants contributes to the overall growth of the global pharmaceutical tubes market.

What Makes France an Important Market for Global Pharmaceutical Tubes Market?

France having a developed pharmaceutical sector coming up with innovative products and solutions from time to time, makes it a primary consumer of pharmaceutical tubes as a packaging solution. Usage of bio-degradable materials by manufacturers in the country having an environmentally concerned consumer base offers immense growth opportunities for the global pharmaceutical tubes market in the country.

Which Factors Make the USA Impactful Country For Global Pharmaceutical Tubes Market?

The rising awareness regarding the skin and oral diseases in the country, along with the high demand for easy to use packaging even for the pharmaceutical offerings makes the USA an important market for pharmaceutical tubes. The presence of global manufacturers of pharmaceutical tubes in the country makes the USA a developed market set to grow shortly.

Pharmaceutical Tubes Market Segmentation

By Material Type:

  • Plastic
  • Aluminum
  • Laminate

By Product Type:

  • Squeeze Tubes
  • Twist Tubes
  • Crimped Tubes

By End-User:

  • Pharmaceutical
  • Cosmetics and Personal Care
  • Food and Beverages

By Application:

  • Ointments
  • Creams
  • Gels

By Capacity:

  • Small Capacity (less than 50ml)
  • Medium Capacity (50ml - 150ml)
  • Large Capacity (above 150ml)

By Region:

  • North America
  • Europe
  • Asia Pacific
  • Latin America
  • Middle East and Africa

Table of Content

  1. Executive Summary
    • Global Market Outlook
    • Demand-side Trends
    • Supply-side Trends
    • Technology Roadmap Analysis
    • Analysis and Recommendations
  2. Market Overview
    • Market Coverage / Taxonomy
    • Market Definition / Scope / Limitations
  3. Market Background
    • Market Dynamics
      • Drivers
      • Restraints
      • Opportunity
      • Trends
    • Scenario Forecast
      • Demand in Optimistic Scenario
      • Demand in Likely Scenario
      • Demand in Conservative Scenario
    • Opportunity Map Analysis
    • Product Life Cycle Analysis
    • Supply Chain Analysis
      • Supply Side Participants and their Roles
        • Producers
        • Mid-Level Participants (Traders/ Agents/ Brokers)
        • Wholesalers and Distributors
      • Value Added and Value Created at Node in the Supply Chain
      • List of Raw Material Suppliers
      • List of Existing and Potential Buyer’s
    • Investment Feasibility Matrix
    • Value Chain Analysis
      • Profit Margin Analysis
      • Wholesalers and Distributors
      • Retailers
    • PESTLE and Porter’s Analysis
    • Regulatory Landscape
      • By Key Regions
      • By Key Countries
    • Regional Parent Market Outlook
    • Production and Consumption Statistics
    • Import and Export Statistics
  4. Global Market Analysis 2020 to 2024 and Forecast, 2025 to 2035
    • Historical Market Size Value (USD Billion) & Volume (Units) Analysis, 2020 to 2024
    • Current and Future Market Size Value (USD Billion) & Volume (Units) Projections, 2025 to 2035
      • Y-o-Y Growth Trend Analysis
      • Absolute $ Opportunity Analysis
  5. Global Market Pricing Analysis 2020 to 2024 and Forecast 2025 to 2035
  6. Global Market Analysis 2020 to 2024 and Forecast 2025 to 2035, By Material Type
    • Introduction / Key Findings
    • Historical Market Size Value (USD Billion) & Volume (Units) Analysis By Material Type, 2020 to 2024
    • Current and Future Market Size Value (USD Billion) & Volume (Units) Analysis and Forecast By Material Type, 2025 to 2035
      • Plastic
      • Aluminum
      • Laminate
    • Y-o-Y Growth Trend Analysis By Material Type, 2020 to 2024
    • Absolute $ Opportunity Analysis By Material Type, 2025 to 2035
  7. Global Market Analysis 2020 to 2024 and Forecast 2025 to 2035, By Product Type
    • Introduction / Key Findings
    • Historical Market Size Value (USD Billion) & Volume (Units) Analysis By Product Type, 2020 to 2024
    • Current and Future Market Size Value (USD Billion) & Volume (Units) Analysis and Forecast By Product Type, 2025 to 2035
      • Squeeze Tubes
      • Twist Tubes
      • Crimped Tubes
    • Y-o-Y Growth Trend Analysis By Product Type, 2020 to 2024
    • Absolute $ Opportunity Analysis By Product Type, 2025 to 2035
  8. Global Market Analysis 2020 to 2024 and Forecast 2025 to 2035, By End-User
    • Introduction / Key Findings
    • Historical Market Size Value (USD Billion) & Volume (Units) Analysis By End-User, 2020 to 2024
    • Current and Future Market Size Value (USD Billion) & Volume (Units) Analysis and Forecast By End-User, 2025 to 2035
      • Pharmaceutical
      • Cosmetics and Personal Care
      • Food and Beverages
    • Y-o-Y Growth Trend Analysis By End-User, 2020 to 2024
    • Absolute $ Opportunity Analysis By End-User, 2025 to 2035
  9. Global Market Analysis 2020 to 2024 and Forecast 2025 to 2035, By Application
    • Introduction / Key Findings
    • Historical Market Size Value (USD Billion) & Volume (Units) Analysis By Application, 2020 to 2024
    • Current and Future Market Size Value (USD Billion) & Volume (Units) Analysis and Forecast By Application, 2025 to 2035
      • Ointments
      • Creams
      • Gels
    • Y-o-Y Growth Trend Analysis By Application, 2020 to 2024
    • Absolute $ Opportunity Analysis By Application, 2025 to 2035
  10. Global Market Analysis 2020 to 2024 and Forecast 2025 to 2035, By Capacity
    • Introduction / Key Findings
    • Historical Market Size Value (USD Billion) & Volume (Units) Analysis By Capacity, 2020 to 2024
    • Current and Future Market Size Value (USD Billion) & Volume (Units) Analysis and Forecast By Capacity, 2025 to 2035
      • Small Capacity (less than 50ml)
      • Medium Capacity (50ml - 150ml)
      • Large Capacity (above 150ml)
    • Y-o-Y Growth Trend Analysis By Capacity, 2020 to 2024
    • Absolute $ Opportunity Analysis By Capacity, 2025 to 2035
  11. Global Market Analysis 2020 to 2024 and Forecast 2025 to 2035, By Region
    • Introduction
    • Historical Market Size Value (USD Billion) & Volume (Units) Analysis By Region, 2020 to 2024
    • Current Market Size Value (USD Billion) & Volume (Units) Analysis and Forecast By Region, 2025 to 2035
      • North America
      • Latin America
      • Europe
      • East Asia
      • South Asia
      • Oceania
      • MEA
    • Market Attractiveness Analysis By Region
  12. North America Market Analysis 2020 to 2024 and Forecast 2025 to 2035, By Country
    • Historical Market Size Value (USD Billion) & Volume (Units) Trend Analysis By Market Taxonomy, 2020 to 2024
    • Market Size Value (USD Billion) & Volume (Units) Forecast By Market Taxonomy, 2025 to 2035
      • By Country
        • USA
        • Canada
      • By Material Type
      • By Product Type
      • By End-User
      • By Application
      • By Capacity
    • Market Attractiveness Analysis
      • By Country
      • By Material Type
      • By Product Type
      • By End-User
      • By Application
      • By Capacity
    • Key Takeaways
  13. Latin America Market Analysis 2020 to 2024 and Forecast 2025 to 2035, By Country
    • Historical Market Size Value (USD Billion) & Volume (Units) Trend Analysis By Market Taxonomy, 2020 to 2024
    • Market Size Value (USD Billion) & Volume (Units) Forecast By Market Taxonomy, 2025 to 2035
      • By Country
        • Brazil
        • Mexico
        • Argentina
        • Chile
        • Peru
        • Rest of Latin America
      • By Material Type
      • By Product Type
      • By End-User
      • By Application
      • By Capacity
    • Market Attractiveness Analysis
      • By Country
      • By Material Type
      • By Product Type
      • By End-User
      • By Application
      • By Capacity
    • Key Takeaways
  14. Europe Market Analysis 2020 to 2024 and Forecast 2025 to 2035, By Country
    • Historical Market Size Value (USD Billion) & Volume (Units) Trend Analysis By Market Taxonomy, 2020 to 2024
    • Market Size Value (USD Billion) & Volume (Units) Forecast By Market Taxonomy, 2025 to 2035
      • By Country
        • Germany
        • Italy
        • France
        • UK
        • Spain
        • Russia
        • BENELUX
        • Rest of Europe
      • By Material Type
      • By Product Type
      • By End-User
      • By Application
      • By Capacity
    • Market Attractiveness Analysis
      • By Country
      • By Material Type
      • By Product Type
      • By End-User
      • By Application
      • By Capacity
    • Key Takeaways
  15. East Asia Market Analysis 2020 to 2024 and Forecast 2025 to 2035, By Country
    • Historical Market Size Value (USD Billion) & Volume (Units) Trend Analysis By Market Taxonomy, 2020 to 2024
    • Market Size Value (USD Billion) & Volume (Units) Forecast By Market Taxonomy, 2025 to 2035
      • By Country
        • China
        • Japan
        • South Korea
      • By Material Type
      • By Product Type
      • By End-User
      • By Application
      • By Capacity
    • Market Attractiveness Analysis
      • By Country
      • By Material Type
      • By Product Type
      • By End-User
      • By Application
      • By Capacity
    • Key Takeaways
  16. South Asia Market Analysis 2020 to 2024 and Forecast 2025 to 2035, By Country
    • Historical Market Size Value (USD Billion) & Volume (Units) Trend Analysis By Market Taxonomy, 2020 to 2024
    • Market Size Value (USD Billion) & Volume (Units) Forecast By Market Taxonomy, 2025 to 2035
      • By Country
        • India
        • Thailand
        • Malaysia
        • Indonesia
        • Rest of South Asia
      • By Material Type
      • By Product Type
      • By End-User
      • By Application
      • By Capacity
    • Market Attractiveness Analysis
      • By Country
      • By Material Type
      • By Product Type
      • By End-User
      • By Application
      • By Capacity
    • Key Takeaways
  17. Oceania Market Analysis 2020 to 2024 and Forecast 2025 to 2035, By Country
    • Historical Market Size Value (USD Billion) & Volume (Units) Trend Analysis By Market Taxonomy, 2020 to 2024
    • Market Size Value (USD Billion) & Volume (Units) Forecast By Market Taxonomy, 2025 to 2035
      • By Country
        • Australia
        • New Zealand
      • By Material Type
      • By Product Type
      • By End-User
      • By Application
      • By Capacity
    • Market Attractiveness Analysis
      • By Country
      • By Material Type
      • By Product Type
      • By End-User
      • By Application
      • By Capacity
    • Key Takeaways
  18. MEA Market Analysis 2020 to 2024 and Forecast 2025 to 2035, By Country
    • Historical Market Size Value (USD Billion) & Volume (Units) Trend Analysis By Market Taxonomy, 2020 to 2024
    • Market Size Value (USD Billion) & Volume (Units) Forecast By Market Taxonomy, 2025 to 2035
      • By Country
        • GCC
        • Rest of MEA
      • By Material Type
      • By Product Type
      • By End-User
      • By Application
      • By Capacity
    • Market Attractiveness Analysis
      • By Country
      • By Material Type
      • By Product Type
      • By End-User
      • By Application
      • By Capacity
    • Key Takeaways
  19. Key Countries Market Analysis
    • USA
      • Pricing Analysis
      • Market Share Analysis, 2024
        • By Material Type
        • By Product Type
        • By End-User
        • By Application
        • By Capacity
    • Canada
      • Pricing Analysis
      • Market Share Analysis, 2024
        • By Material Type
        • By Product Type
        • By End-User
        • By Application
        • By Capacity
    • Brazil
      • Pricing Analysis
      • Market Share Analysis, 2024
        • By Material Type
        • By Product Type
        • By End-User
        • By Application
        • By Capacity
    • Mexico
      • Pricing Analysis
      • Market Share Analysis, 2024
        • By Material Type
        • By Product Type
        • By End-User
        • By Application
        • By Capacity
    • Argentina
      • Pricing Analysis
      • Market Share Analysis, 2024
        • By Material Type
        • By Product Type
        • By End-User
        • By Application
        • By Capacity
  20. Market Structure Analysis
    • Competition Dashboard
    • Competition Benchmarking
    • Market Share Analysis of Top Players
      • By Regional
      • By Material Type
      • By Product Type
      • By End-User
      • By Application
      • By Capacity
  21. Competition Analysis
    • Competition Deep Dive
      • ALLTUB
        • Overview
        • Product Portfolio
        • Profitability by Market Segments (Product/Age /Sales Channel/Region)
        • Sales Footprint
        • Strategy Overview
          • Marketing Strategy
          • Product Strategy
          • Channel Strategy
      • Albea Group
        • Overview
        • Product Portfolio
        • Profitability by Market Segments (Product/Age /Sales Channel/Region)
        • Sales Footprint
        • Strategy Overview
          • Marketing Strategy
          • Product Strategy
          • Channel Strategy
      • Hoffmann Neopac
        • Overview
        • Product Portfolio
        • Profitability by Market Segments (Product/Age /Sales Channel/Region)
        • Sales Footprint
        • Strategy Overview
          • Marketing Strategy
          • Product Strategy
          • Channel Strategy
      • Huhtamaki
        • Overview
        • Product Portfolio
        • Profitability by Market Segments (Product/Age /Sales Channel/Region)
        • Sales Footprint
        • Strategy Overview
          • Marketing Strategy
          • Product Strategy
          • Channel Strategy
      • CCL Industries
        • Overview
        • Product Portfolio
        • Profitability by Market Segments (Product/Age /Sales Channel/Region)
        • Sales Footprint
        • Strategy Overview
          • Marketing Strategy
          • Product Strategy
          • Channel Strategy
      • MONTEBELLO PACKAGING
        • Overview
        • Product Portfolio
        • Profitability by Market Segments (Product/Age /Sales Channel/Region)
        • Sales Footprint
        • Strategy Overview
          • Marketing Strategy
          • Product Strategy
          • Channel Strategy
      • Unette Corporation
        • Overview
        • Product Portfolio
        • Profitability by Market Segments (Product/Age /Sales Channel/Region)
        • Sales Footprint
        • Strategy Overview
          • Marketing Strategy
          • Product Strategy
          • Channel Strategy
      • Romaco Group
        • Overview
        • Product Portfolio
        • Profitability by Market Segments (Product/Age /Sales Channel/Region)
        • Sales Footprint
        • Strategy Overview
          • Marketing Strategy
          • Product Strategy
          • Channel Strategy
      • EPL LIMITED
        • Overview
        • Product Portfolio
        • Profitability by Market Segments (Product/Age /Sales Channel/Region)
        • Sales Footprint
        • Strategy Overview
          • Marketing Strategy
          • Product Strategy
          • Channel Strategy
      • Neelam Global
        • Overview
        • Product Portfolio
        • Profitability by Market Segments (Product/Age /Sales Channel/Region)
        • Sales Footprint
        • Strategy Overview
          • Marketing Strategy
          • Product Strategy
          • Channel Strategy
      • BRK Packwell Private
        • Overview
        • Product Portfolio
        • Profitability by Market Segments (Product/Age /Sales Channel/Region)
        • Sales Footprint
        • Strategy Overview
          • Marketing Strategy
          • Product Strategy
          • Channel Strategy
      • Almin Extrusion
        • Overview
        • Product Portfolio
        • Profitability by Market Segments (Product/Age /Sales Channel/Region)
        • Sales Footprint
        • Strategy Overview
          • Marketing Strategy
          • Product Strategy
          • Channel Strategy
      • Antilla Propack
        • Overview
        • Product Portfolio
        • Profitability by Market Segments (Product/Age /Sales Channel/Region)
        • Sales Footprint
        • Strategy Overview
          • Marketing Strategy
          • Product Strategy
          • Channel Strategy
      • Prutha Packaging
        • Overview
        • Product Portfolio
        • Profitability by Market Segments (Product/Age /Sales Channel/Region)
        • Sales Footprint
        • Strategy Overview
          • Marketing Strategy
          • Product Strategy
          • Channel Strategy
  22. Assumptions & Acronyms Used
  23. Research Methodology

List of Tables

  • Table 1: Global Market Value (USD Billion) Forecast by Region, 2020-2035
  • Table 2: Global Market Volume (Units) Forecast by Region, 2020-2035
  • Table 3: Global Market Value (USD Billion) Forecast by Material Type, 2020-2035
  • Table 4: Global Market Volume (Units) Forecast by Material Type, 2020-2035
  • Table 5: Global Market Value (USD Billion) Forecast by Product Type, 2020-2035
  • Table 6: Global Market Volume (Units) Forecast by Product Type, 2020-2035
  • Table 7: Global Market Value (USD Billion) Forecast by End-User, 2020-2035
  • Table 8: Global Market Volume (Units) Forecast by End-User, 2020-2035
  • Table 9: Global Market Value (USD Billion) Forecast by Application, 2020-2035
  • Table 10: Global Market Volume (Units) Forecast by Application, 2020-2035
  • Table 11: Global Market Value (USD Billion) Forecast by Capacity, 2020-2035
  • Table 12: Global Market Volume (Units) Forecast by Capacity, 2020-2035
  • Table 13: North America Market Value (USD Billion) Forecast by Country, 2020-2035
  • Table 14: North America Market Volume (Units) Forecast by Country, 2020-2035
  • Table 15: North America Market Value (USD Billion) Forecast by Material Type, 2020-2035
  • Table 16: North America Market Volume (Units) Forecast by Material Type, 2020-2035
  • Table 17: North America Market Value (USD Billion) Forecast by Product Type, 2020-2035
  • Table 18: North America Market Volume (Units) Forecast by Product Type, 2020-2035
  • Table 19: North America Market Value (USD Billion) Forecast by End-User, 2020-2035
  • Table 20: North America Market Volume (Units) Forecast by End-User, 2020-2035
  • Table 21: North America Market Value (USD Billion) Forecast by Application, 2020-2035
  • Table 22: North America Market Volume (Units) Forecast by Application, 2020-2035
  • Table 23: North America Market Value (USD Billion) Forecast by Capacity, 2020-2035
  • Table 24: North America Market Volume (Units) Forecast by Capacity, 2020-2035
  • Table 25: Latin America Market Value (USD Billion) Forecast by Country, 2020-2035
  • Table 26: Latin America Market Volume (Units) Forecast by Country, 2020-2035
  • Table 27: Latin America Market Value (USD Billion) Forecast by Material Type, 2020-2035
  • Table 28: Latin America Market Volume (Units) Forecast by Material Type, 2020-2035
  • Table 29: Latin America Market Value (USD Billion) Forecast by Product Type, 2020-2035
  • Table 30: Latin America Market Volume (Units) Forecast by Product Type, 2020-2035
  • Table 31: Latin America Market Value (USD Billion) Forecast by End-User, 2020-2035
  • Table 32: Latin America Market Volume (Units) Forecast by End-User, 2020-2035
  • Table 33: Latin America Market Value (USD Billion) Forecast by Application, 2020-2035
  • Table 34: Latin America Market Volume (Units) Forecast by Application, 2020-2035
  • Table 35: Latin America Market Value (USD Billion) Forecast by Capacity, 2020-2035
  • Table 36: Latin America Market Volume (Units) Forecast by Capacity, 2020-2035
  • Table 37: Europe Market Value (USD Billion) Forecast by Country, 2020-2035
  • Table 38: Europe Market Volume (Units) Forecast by Country, 2020-2035
  • Table 39: Europe Market Value (USD Billion) Forecast by Material Type, 2020-2035
  • Table 40: Europe Market Volume (Units) Forecast by Material Type, 2020-2035
  • Table 41: Europe Market Value (USD Billion) Forecast by Product Type, 2020-2035
  • Table 42: Europe Market Volume (Units) Forecast by Product Type, 2020-2035
  • Table 43: Europe Market Value (USD Billion) Forecast by End-User, 2020-2035
  • Table 44: Europe Market Volume (Units) Forecast by End-User, 2020-2035
  • Table 45: Europe Market Value (USD Billion) Forecast by Application, 2020-2035
  • Table 46: Europe Market Volume (Units) Forecast by Application, 2020-2035
  • Table 47: Europe Market Value (USD Billion) Forecast by Capacity, 2020-2035
  • Table 48: Europe Market Volume (Units) Forecast by Capacity, 2020-2035
  • Table 49: East Asia Market Value (USD Billion) Forecast by Country, 2020-2035
  • Table 50: East Asia Market Volume (Units) Forecast by Country, 2020-2035
  • Table 51: East Asia Market Value (USD Billion) Forecast by Material Type, 2020-2035
  • Table 52: East Asia Market Volume (Units) Forecast by Material Type, 2020-2035
  • Table 53: East Asia Market Value (USD Billion) Forecast by Product Type, 2020-2035
  • Table 54: East Asia Market Volume (Units) Forecast by Product Type, 2020-2035
  • Table 55: East Asia Market Value (USD Billion) Forecast by End-User, 2020-2035
  • Table 56: East Asia Market Volume (Units) Forecast by End-User, 2020-2035
  • Table 57: East Asia Market Value (USD Billion) Forecast by Application, 2020-2035
  • Table 58: East Asia Market Volume (Units) Forecast by Application, 2020-2035
  • Table 59: East Asia Market Value (USD Billion) Forecast by Capacity, 2020-2035
  • Table 60: East Asia Market Volume (Units) Forecast by Capacity, 2020-2035
  • Table 61: South Asia Market Value (USD Billion) Forecast by Country, 2020-2035
  • Table 62: South Asia Market Volume (Units) Forecast by Country, 2020-2035
  • Table 63: South Asia Market Value (USD Billion) Forecast by Material Type, 2020-2035
  • Table 64: South Asia Market Volume (Units) Forecast by Material Type, 2020-2035
  • Table 65: South Asia Market Value (USD Billion) Forecast by Product Type, 2020-2035
  • Table 66: South Asia Market Volume (Units) Forecast by Product Type, 2020-2035
  • Table 67: South Asia Market Value (USD Billion) Forecast by End-User, 2020-2035
  • Table 68: South Asia Market Volume (Units) Forecast by End-User, 2020-2035
  • Table 69: South Asia Market Value (USD Billion) Forecast by Application, 2020-2035
  • Table 70: South Asia Market Volume (Units) Forecast by Application, 2020-2035
  • Table 71: South Asia Market Value (USD Billion) Forecast by Capacity, 2020-2035
  • Table 72: South Asia Market Volume (Units) Forecast by Capacity, 2020-2035
  • Table 73: Oceania Market Value (USD Billion) Forecast by Country, 2020-2035
  • Table 74: Oceania Market Volume (Units) Forecast by Country, 2020-2035
  • Table 75: Oceania Market Value (USD Billion) Forecast by Material Type, 2020-2035
  • Table 76: Oceania Market Volume (Units) Forecast by Material Type, 2020-2035
  • Table 77: Oceania Market Value (USD Billion) Forecast by Product Type, 2020-2035
  • Table 78: Oceania Market Volume (Units) Forecast by Product Type, 2020-2035
  • Table 79: Oceania Market Value (USD Billion) Forecast by End-User, 2020-2035
  • Table 80: Oceania Market Volume (Units) Forecast by End-User, 2020-2035
  • Table 81: Oceania Market Value (USD Billion) Forecast by Application, 2020-2035
  • Table 82: Oceania Market Volume (Units) Forecast by Application, 2020-2035
  • Table 83: Oceania Market Value (USD Billion) Forecast by Capacity, 2020-2035
  • Table 84: Oceania Market Volume (Units) Forecast by Capacity, 2020-2035
  • Table 85: MEA Market Value (USD Billion) Forecast by Country, 2020-2035
  • Table 86: MEA Market Volume (Units) Forecast by Country, 2020-2035
  • Table 87: MEA Market Value (USD Billion) Forecast by Material Type, 2020-2035
  • Table 88: MEA Market Volume (Units) Forecast by Material Type, 2020-2035
  • Table 89: MEA Market Value (USD Billion) Forecast by Product Type, 2020-2035
  • Table 90: MEA Market Volume (Units) Forecast by Product Type, 2020-2035
  • Table 91: MEA Market Value (USD Billion) Forecast by End-User, 2020-2035
  • Table 92: MEA Market Volume (Units) Forecast by End-User, 2020-2035
  • Table 93: MEA Market Value (USD Billion) Forecast by Application, 2020-2035
  • Table 94: MEA Market Volume (Units) Forecast by Application, 2020-2035
  • Table 95: MEA Market Value (USD Billion) Forecast by Capacity, 2020-2035
  • Table 96: MEA Market Volume (Units) Forecast by Capacity, 2020-2035

List of Figures

  • Figure 1: Global Market Volume (Units) Forecast 2020-2035
  • Figure 2: Global Market Pricing Analysis
  • Figure 3: Global Market Value (USD Billion) Forecast 2020-2035
  • Figure 4: Global Market Value Share and BPS Analysis by Material Type, 2025 and 2035
  • Figure 5: Global Market Y-o-Y Growth Comparison by Material Type, 2025-2035
  • Figure 6: Global Market Attractiveness Analysis by Material Type
  • Figure 7: Global Market Value Share and BPS Analysis by Product Type, 2025 and 2035
  • Figure 8: Global Market Y-o-Y Growth Comparison by Product Type, 2025-2035
  • Figure 9: Global Market Attractiveness Analysis by Product Type
  • Figure 10: Global Market Value Share and BPS Analysis by End-User, 2025 and 2035
  • Figure 11: Global Market Y-o-Y Growth Comparison by End-User, 2025-2035
  • Figure 12: Global Market Attractiveness Analysis by End-User
  • Figure 13: Global Market Value Share and BPS Analysis by Application, 2025 and 2035
  • Figure 14: Global Market Y-o-Y Growth Comparison by Application, 2025-2035
  • Figure 15: Global Market Attractiveness Analysis by Application
  • Figure 16: Global Market Value Share and BPS Analysis by Capacity, 2025 and 2035
  • Figure 17: Global Market Y-o-Y Growth Comparison by Capacity, 2025-2035
  • Figure 18: Global Market Attractiveness Analysis by Capacity
  • Figure 19: Global Market Value (USD Billion) Share and BPS Analysis by Region, 2025 and 2035
  • Figure 20: Global Market Y-o-Y Growth Comparison by Region, 2025-2035
  • Figure 21: Global Market Attractiveness Analysis by Region
  • Figure 22: North America Market Incremental $ Opportunity, 2025-2035
  • Figure 23: Latin America Market Incremental $ Opportunity, 2025-2035
  • Figure 24: Europe Market Incremental $ Opportunity, 2025-2035
  • Figure 25: East Asia Market Incremental $ Opportunity, 2025-2035
  • Figure 26: South Asia Market Incremental $ Opportunity, 2025-2035
  • Figure 27: Oceania Market Incremental $ Opportunity, 2025-2035
  • Figure 28: MEA Market Incremental $ Opportunity, 2025-2035
  • Figure 29: North America Market Value Share and BPS Analysis by Country, 2025 and 2035
  • Figure 30: North America Market Value Share and BPS Analysis by Material Type, 2025 and 2035
  • Figure 31: North America Market Y-o-Y Growth Comparison by Material Type, 2025-2035
  • Figure 32: North America Market Attractiveness Analysis by Material Type
  • Figure 33: North America Market Value Share and BPS Analysis by Product Type, 2025 and 2035
  • Figure 34: North America Market Y-o-Y Growth Comparison by Product Type, 2025-2035
  • Figure 35: North America Market Attractiveness Analysis by Product Type
  • Figure 36: North America Market Value Share and BPS Analysis by End-User, 2025 and 2035
  • Figure 37: North America Market Y-o-Y Growth Comparison by End-User, 2025-2035
  • Figure 38: North America Market Attractiveness Analysis by End-User
  • Figure 39: North America Market Value Share and BPS Analysis by Application, 2025 and 2035
  • Figure 40: North America Market Y-o-Y Growth Comparison by Application, 2025-2035
  • Figure 41: North America Market Attractiveness Analysis by Application
  • Figure 42: North America Market Value Share and BPS Analysis by Capacity, 2025 and 2035
  • Figure 43: North America Market Y-o-Y Growth Comparison by Capacity, 2025-2035
  • Figure 44: North America Market Attractiveness Analysis by Capacity
  • Figure 45: Latin America Market Value Share and BPS Analysis by Country, 2025 and 2035
  • Figure 46: Latin America Market Value Share and BPS Analysis by Material Type, 2025 and 2035
  • Figure 47: Latin America Market Y-o-Y Growth Comparison by Material Type, 2025-2035
  • Figure 48: Latin America Market Attractiveness Analysis by Material Type
  • Figure 49: Latin America Market Value Share and BPS Analysis by Product Type, 2025 and 2035
  • Figure 50: Latin America Market Y-o-Y Growth Comparison by Product Type, 2025-2035
  • Figure 51: Latin America Market Attractiveness Analysis by Product Type
  • Figure 52: Latin America Market Value Share and BPS Analysis by End-User, 2025 and 2035
  • Figure 53: Latin America Market Y-o-Y Growth Comparison by End-User, 2025-2035
  • Figure 54: Latin America Market Attractiveness Analysis by End-User
  • Figure 55: Latin America Market Value Share and BPS Analysis by Application, 2025 and 2035
  • Figure 56: Latin America Market Y-o-Y Growth Comparison by Application, 2025-2035
  • Figure 57: Latin America Market Attractiveness Analysis by Application
  • Figure 58: Latin America Market Value Share and BPS Analysis by Capacity, 2025 and 2035
  • Figure 59: Latin America Market Y-o-Y Growth Comparison by Capacity, 2025-2035
  • Figure 60: Latin America Market Attractiveness Analysis by Capacity
  • Figure 61: Europe Market Value Share and BPS Analysis by Country, 2025 and 2035
  • Figure 62: Europe Market Value Share and BPS Analysis by Material Type, 2025 and 2035
  • Figure 63: Europe Market Y-o-Y Growth Comparison by Material Type, 2025-2035
  • Figure 64: Europe Market Attractiveness Analysis by Material Type
  • Figure 65: Europe Market Value Share and BPS Analysis by Product Type, 2025 and 2035
  • Figure 66: Europe Market Y-o-Y Growth Comparison by Product Type, 2025-2035
  • Figure 67: Europe Market Attractiveness Analysis by Product Type
  • Figure 68: Europe Market Value Share and BPS Analysis by End-User, 2025 and 2035
  • Figure 69: Europe Market Y-o-Y Growth Comparison by End-User, 2025-2035
  • Figure 70: Europe Market Attractiveness Analysis by End-User
  • Figure 71: Europe Market Value Share and BPS Analysis by Application, 2025 and 2035
  • Figure 72: Europe Market Y-o-Y Growth Comparison by Application, 2025-2035
  • Figure 73: Europe Market Attractiveness Analysis by Application
  • Figure 74: Europe Market Value Share and BPS Analysis by Capacity, 2025 and 2035
  • Figure 75: Europe Market Y-o-Y Growth Comparison by Capacity, 2025-2035
  • Figure 76: Europe Market Attractiveness Analysis by Capacity
  • Figure 77: East Asia Market Value Share and BPS Analysis by Country, 2025 and 2035
  • Figure 78: East Asia Market Value Share and BPS Analysis by Material Type, 2025 and 2035
  • Figure 79: East Asia Market Y-o-Y Growth Comparison by Material Type, 2025-2035
  • Figure 80: East Asia Market Attractiveness Analysis by Material Type
  • Figure 81: East Asia Market Value Share and BPS Analysis by Product Type, 2025 and 2035
  • Figure 82: East Asia Market Y-o-Y Growth Comparison by Product Type, 2025-2035
  • Figure 83: East Asia Market Attractiveness Analysis by Product Type
  • Figure 84: East Asia Market Value Share and BPS Analysis by End-User, 2025 and 2035
  • Figure 85: East Asia Market Y-o-Y Growth Comparison by End-User, 2025-2035
  • Figure 86: East Asia Market Attractiveness Analysis by End-User
  • Figure 87: East Asia Market Value Share and BPS Analysis by Application, 2025 and 2035
  • Figure 88: East Asia Market Y-o-Y Growth Comparison by Application, 2025-2035
  • Figure 89: East Asia Market Attractiveness Analysis by Application
  • Figure 90: East Asia Market Value Share and BPS Analysis by Capacity, 2025 and 2035
  • Figure 91: East Asia Market Y-o-Y Growth Comparison by Capacity, 2025-2035
  • Figure 92: East Asia Market Attractiveness Analysis by Capacity
  • Figure 93: South Asia Market Value Share and BPS Analysis by Country, 2025 and 2035
  • Figure 94: South Asia Market Value Share and BPS Analysis by Material Type, 2025 and 2035
  • Figure 95: South Asia Market Y-o-Y Growth Comparison by Material Type, 2025-2035
  • Figure 96: South Asia Market Attractiveness Analysis by Material Type
  • Figure 97: South Asia Market Value Share and BPS Analysis by Product Type, 2025 and 2035
  • Figure 98: South Asia Market Y-o-Y Growth Comparison by Product Type, 2025-2035
  • Figure 99: South Asia Market Attractiveness Analysis by Product Type
  • Figure 100: South Asia Market Value Share and BPS Analysis by End-User, 2025 and 2035
  • Figure 101: South Asia Market Y-o-Y Growth Comparison by End-User, 2025-2035
  • Figure 102: South Asia Market Attractiveness Analysis by End-User
  • Figure 103: South Asia Market Value Share and BPS Analysis by Application, 2025 and 2035
  • Figure 104: South Asia Market Y-o-Y Growth Comparison by Application, 2025-2035
  • Figure 105: South Asia Market Attractiveness Analysis by Application
  • Figure 106: South Asia Market Value Share and BPS Analysis by Capacity, 2025 and 2035
  • Figure 107: South Asia Market Y-o-Y Growth Comparison by Capacity, 2025-2035
  • Figure 108: South Asia Market Attractiveness Analysis by Capacity
  • Figure 109: Oceania Market Value Share and BPS Analysis by Country, 2025 and 2035
  • Figure 110: Oceania Market Value Share and BPS Analysis by Material Type, 2025 and 2035
  • Figure 111: Oceania Market Y-o-Y Growth Comparison by Material Type, 2025-2035
  • Figure 112: Oceania Market Attractiveness Analysis by Material Type
  • Figure 113: Oceania Market Value Share and BPS Analysis by Product Type, 2025 and 2035
  • Figure 114: Oceania Market Y-o-Y Growth Comparison by Product Type, 2025-2035
  • Figure 115: Oceania Market Attractiveness Analysis by Product Type
  • Figure 116: Oceania Market Value Share and BPS Analysis by End-User, 2025 and 2035
  • Figure 117: Oceania Market Y-o-Y Growth Comparison by End-User, 2025-2035
  • Figure 118: Oceania Market Attractiveness Analysis by End-User
  • Figure 119: Oceania Market Value Share and BPS Analysis by Application, 2025 and 2035
  • Figure 120: Oceania Market Y-o-Y Growth Comparison by Application, 2025-2035
  • Figure 121: Oceania Market Attractiveness Analysis by Application
  • Figure 122: Oceania Market Value Share and BPS Analysis by Capacity, 2025 and 2035
  • Figure 123: Oceania Market Y-o-Y Growth Comparison by Capacity, 2025-2035
  • Figure 124: Oceania Market Attractiveness Analysis by Capacity
  • Figure 125: MEA Market Value Share and BPS Analysis by Country, 2025 and 2035
  • Figure 126: MEA Market Value Share and BPS Analysis by Material Type, 2025 and 2035
  • Figure 127: MEA Market Y-o-Y Growth Comparison by Material Type, 2025-2035
  • Figure 128: MEA Market Attractiveness Analysis by Material Type
  • Figure 129: MEA Market Value Share and BPS Analysis by Product Type, 2025 and 2035
  • Figure 130: MEA Market Y-o-Y Growth Comparison by Product Type, 2025-2035
  • Figure 131: MEA Market Attractiveness Analysis by Product Type
  • Figure 132: MEA Market Value Share and BPS Analysis by End-User, 2025 and 2035
  • Figure 133: MEA Market Y-o-Y Growth Comparison by End-User, 2025-2035
  • Figure 134: MEA Market Attractiveness Analysis by End-User
  • Figure 135: MEA Market Value Share and BPS Analysis by Application, 2025 and 2035
  • Figure 136: MEA Market Y-o-Y Growth Comparison by Application, 2025-2035
  • Figure 137: MEA Market Attractiveness Analysis by Application
  • Figure 138: MEA Market Value Share and BPS Analysis by Capacity, 2025 and 2035
  • Figure 139: MEA Market Y-o-Y Growth Comparison by Capacity, 2025-2035
  • Figure 140: MEA Market Attractiveness Analysis by Capacity
  • Figure 141: Global Market - Tier Structure Analysis
  • Figure 142: Global Market - Company Share Analysis

Explore Similar Insights

Future Market Insights

Pharmaceutical Tubes Market