Pharmaceutical Excipient SNAC Market Forecast and Outlook 2025 to 2035

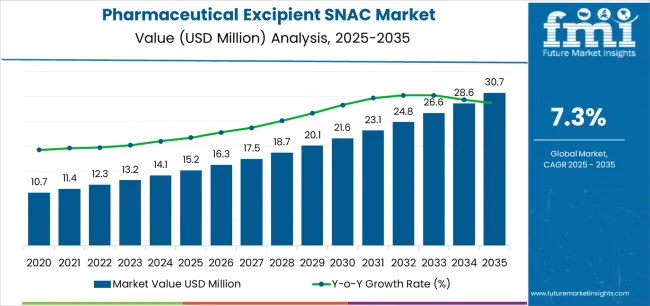
Valued at USD 15.2 million in 2025, the global pharmaceutical excipient SNAC market is projected to reach USD 30.7 million by 2035, recording a CAGR of 7.3%. Rolling CAGR analysis indicates consistent acceleration through the decade, supported by the increasing application of absorption enhancers in oral delivery systems for large-molecule therapeutics. SNAC, or sodium N-(8-[2-hydroxybenzoyl] amino) caprylate, is recognized for its ability to promote gastrointestinal permeability and improve the systemic uptake of peptide drugs.

Growth is influenced by the movement toward patient-friendly formulations and the shift from injectable to oral biologics. Pharmaceutical developers are leveraging SNAC to achieve targeted delivery without compromising molecular integrity. Expanded clinical validation across insulin analogues and GLP-1 receptor agonists continues to reinforce its functional role within advanced formulation portfolios.

Production efficiency depends on controlled synthesis conditions, reagent consistency, and compliance with international pharmacopoeia standards. North America remains the primary center for innovation, while Asia Pacific’s manufacturing infrastructure is gradually supporting regional scale-up. European activity remains balanced between research collaboration and pilot-scale production. Through 2035, sustained clinical trial investment, regulatory alignment, and secure raw material sourcing are expected to maintain the market’s upward trajectory and operational stability.
Quick Stats: Pharmaceutical Excipient SNAC Market

  • Pharmaceutical Excipient SNAC Market Value (2025): USD 15.2 million
  • Pharmaceutical Excipient SNAC Market Forecast Value (2035): USD 30.7 million
  • Pharmaceutical Excipient SNAC Market Forecast CAGR (2025–2035): 7.3%
  • Leading Type in Pharmaceutical Excipient SNAC Market: Purity 99%
  • Key Growth Regions: North America, East Asia, and Europe
  • Top Players: Novo Nordisk, Apothecon Pharmaceuticals, Actylis Lab, Hainan Poly Pharm, Suzhou Tianma Pharmaceutical Group Tianji Biopharmaceutical, Apeloa Pharmaceutical, Kingchem, Jiangsu Southeast Nanomaterials

Pharmaceutical Excipient Snac Market Market Value Analysis

Between 2025 and 2030, the Pharmaceutical Excipient SNAC Market is projected to expand from USD 15.2 million to USD 21.6 million, reflecting a 42.1% increase and accounting for 45.7% of the total market growth over the decade. Growth during this period will be primarily driven by the increasing use of SNAC (sodium N-[8-(2-hydroxybenzoyl) amino] caprylate) as an absorption enhancer in oral biologics and peptide formulations. Rising R&D investments in oral drug delivery systems, coupled with expanding clinical trials involving SNAC-enabled molecules, will further accelerate adoption. Pharmaceutical manufacturers are prioritizing SNAC-based formulation strategies to improve bioavailability and patient compliance.

From 2030 to 2035, the market is expected to grow from USD 21.6 million to USD 30.7 million, registering a 42.1% rise and contributing 54.3% of the decade’s overall expansion. This phase will be defined by broader regulatory acceptance of SNAC-based delivery technologies and their integration into commercial peptide and protein drug pipelines. As pharmaceutical firms move toward non-invasive delivery solutions, SNAC will play a pivotal role in enabling oral versions of traditionally injectable therapies. Strategic alliances between excipient suppliers and biotech developers will strengthen innovation ecosystems, ensuring scalable production and consistent performance across emerging therapeutic applications.

Pharmaceutical Excipient SNAC Market Key Takeaways

Metric Value
Market Value (2025) USD 15.2 million
Market Forecast Value (2035) USD 30.7 million
Forecast CAGR (2025–2035) 7.3%

Why Is the Pharmaceutical Excipient SNAC Market Gaining Strategic Importance in Drug Delivery Innovation?

The pharmaceutical excipient SNAC (sodium N-[8-(2-hydroxybenzoyl) amino] caprylate) market is gaining traction due to its proven role in enhancing oral bioavailability of peptide-based and macromolecular drugs. SNAC facilitates the systemic absorption of active pharmaceutical ingredients that would otherwise degrade or fail to permeate the gastrointestinal barrier. Its application in oral formulations of drugs such as semaglutide demonstrates its ability to stabilize peptides and promote localized pH modulation, enabling predictable pharmacokinetics without invasive delivery methods.

Pharmaceutical developers increasingly incorporate SNAC into formulation pipelines as research expands into non-injectable delivery systems for diabetes, obesity, and metabolic disorders. The compound’s safety record and established regulatory acceptance support its integration into both new drug development and reformulation programs. Manufacturers focus on optimizing synthesis yield and purity to meet stringent pharmaceutical-grade requirements while maintaining scalable production efficiency. Rising demand for patient-friendly dosage forms, coupled with healthcare systems’ preference for self-administered therapies, accelerates commercial interest in SNAC-based excipients. However, cost constraints, patent exclusivity, and limited supplier availability restrict broader utilization across smaller pharmaceutical entities. Continued research on excipient-drug interaction mechanisms and regulatory endorsement of novel oral peptide platforms sustain the market’s advancement within the broader pharmaceutical innovation landscape.

How Is the Pharmaceutical Excipient SNAC Market Segmented by Product Type, Application, and Region?

The pharmaceutical excipient SNAC market is segmented by product type, application, and region. By product type, the market is divided into purity 99% and others. Based on application, it is categorized into pharmaceuticals and scientific research. Regionally, the market is segmented into North America, Europe, East Asia, South Asia, Latin America, and the Middle East & Africa. These divisions reflect variations in purity-grade utilization, end-use demand, and regional pharmaceutical production capacity influencing global market distribution.
By Product Type, Which Segment Leads the Pharmaceutical Excipient SNAC Market?

Pharmaceutical Excipient Snac Market Analysis By Product Type

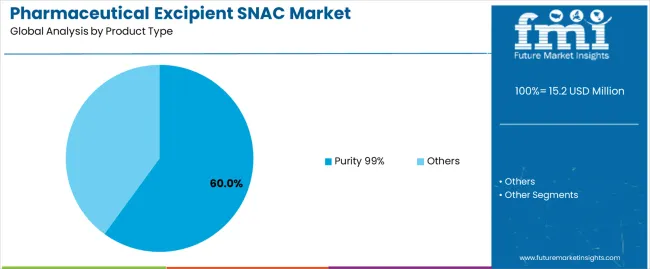
The purity 99% segment accounts for approximately 60.0% of the global pharmaceutical excipient SNAC market in 2025, representing the leading product category. This dominance results from its consistent use in drug formulation processes requiring high chemical stability and purity. SNAC with 99% purity is preferred for oral and parenteral drug delivery systems where excipient consistency directly affects bioavailability and absorption rates.

Pharmaceutical manufacturers adopt high-purity SNAC to ensure uniformity in active ingredient transport and compatibility with a broad range of drug compounds. The segment benefits from strict regulatory requirements mandating excipient quality assurance across major pharmaceutical production centers in North America and Europe. High-purity SNAC also supports advanced formulation technologies, including peptide-based and biologic drug development, where excipient integrity is essential for maintaining molecular stability. Continuous research into absorption enhancers and solubility-improving excipients further strengthens this segment’s demand. The purity 99% classification remains the standard reference for commercial-grade SNAC, supported by validated manufacturing processes and analytical certification protocols. Its established reliability in clinical formulation workflows ensures continued dominance across both small-molecule and biologic drug development pipelines.
By Application, Which Segment Dominates Market Demand?

Pharmaceutical Excipient Snac Market Analysis By Application

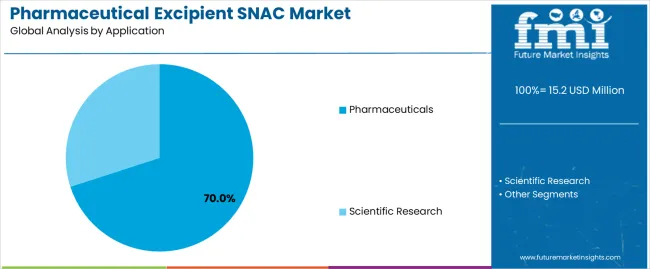
The pharmaceuticals segment represents about 70.0% of the total pharmaceutical excipient SNAC market in 2025, making it the largest application category. This segment’s prominence reflects the essential role of SNAC as a functional excipient in drug absorption enhancement and formulation stabilization. SNAC is used in oral, sublingual, and injectable formulations to improve systemic drug delivery, particularly for macromolecules and low-solubility compounds.

Pharmaceutical companies employ SNAC to increase bioavailability by facilitating transcellular and paracellular drug transport without compromising membrane integrity. Its adoption is especially notable in peptide drug development, including formulations for metabolic and endocrine therapies. The segment’s growth is reinforced by ongoing clinical trials assessing SNAC’s compatibility with new molecular entities and reformulated oral biologics. Regional pharmaceutical production hubs in North America and East Asia account for significant utilization, supported by established research infrastructure and excipient quality standards. The consistent incorporation of SNAC into dosage design strategies underscores its value as a proven absorption enhancer. The pharmaceuticals segment continues to lead market demand due to its critical function in enabling effective drug delivery and supporting innovation in therapeutic formulation technologies.

What are the Key Trends, Drivers, and Restraints in the Pharmaceutical Excipient SNAC Market?

The pharmaceutical excipient SNAC market is expanding as drug developers seek oral delivery solutions for peptide and protein-based therapeutics. SNAC improves absorption by modifying the local environment in the gastrointestinal tract, allowing molecules that typically require injection to be delivered orally. The shift toward patient-friendly dosage forms and ongoing innovation in biopharmaceutical formulation technology are key growth factors. Challenges such as regulatory complexity, high formulation costs, and limited technical expertise restrict broader use. The market is moving toward scalable production, improved purity, and wider therapeutic applications across emerging pharmaceutical markets.

What factors are driving growth in the pharmaceutical excipient SNAC market?

The main driver is the growing demand for effective oral delivery of biologics and peptides. SNAC enables absorption of large molecules that otherwise degrade or pass unmetabolized through the gastrointestinal system. Pharmaceutical companies increasingly invest in research using SNAC to enhance the bioavailability of drugs in metabolic and endocrine disorders. Oral administration improves patient compliance and reduces healthcare delivery costs, making SNAC-based formulations attractive alternatives to injectables. The expansion of biopharmaceutical pipelines globally continues to sustain market growth and encourage further formulation development using this excipient.

What restraints are limiting market expansion?

Regulatory challenges and formulation complexity remain key barriers in the SNAC excipient market. Developing oral biologic drugs requires extensive validation for safety, stability, and efficacy, which lengthens development timelines and increases cost. Variability in absorption efficiency and dependency on molecular structure add uncertainty for formulators. The need for specialized production facilities and stringent quality standards raises manufacturing costs, while limited experience among smaller companies reduces adoption. These combined technical and financial challenges continue to slow large-scale implementation despite clear therapeutic advantages.

What key trends are shaping future market development?

The market is shifting toward high-purity, scalable SNAC production and integration into broader oral delivery platforms. Increasing collaboration between excipient manufacturers and drug developers supports innovation in oral peptide and protein therapies. Digital formulation tools and data-driven drug design approaches are enhancing formulation predictability and efficiency. Growth in North America and Asia-Pacific is strong, driven by expanding biopharmaceutical research and demand for convenient dosage forms. As regulatory clarity improves and clinical validation increases, SNAC-based excipients are expected to play a more central role in next-generation drug formulations.
What is the Analysis of the Pharmaceutical Excipient SNAC Market by Key Country?

Pharmaceutical Excipient Snac Market Cagr Analysis By Country

Country CAGR (%)
China 9.9%
India 9.1%
Germany 8.4%
Brazil 7.7%
U.S. 6.9%
U.K. 6.2%
Japan 5.5%

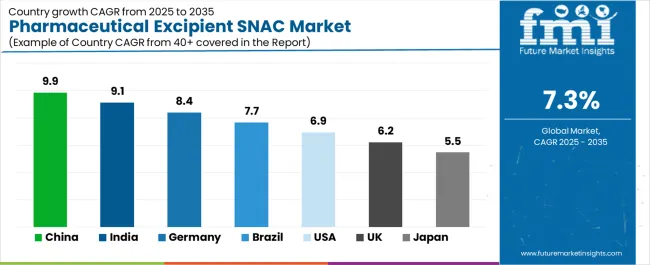
The pharmaceutical excipient SNAC market is expanding rapidly worldwide, with China leading at a remarkable 9.9% CAGR through 2035, driven by rising pharmaceutical production, innovative drug formulation capabilities, and government-backed R&D investment. India follows at 9.1%, supported by its strong generic drug manufacturing base, cost-effective production, and expanding life sciences sector. Germany grows at 8.4%, benefitting from precision chemical processing and excipient innovation in advanced drug delivery systems. Brazil records 7.7%, reflecting healthcare modernization and domestic formulation advancements. The U.S., at 6.9%, remains a mature market emphasizing research, regulatory compliance, and adoption of bioavailability-enhancing technologies, while the U.K. (6.2%) and Japan (5.5%) maintain consistent growth through pharmaceutical innovation, process excellence, and formulation efficiency in excipient applications.

The report covers an in-depth analysis of 40+ countries top-performing countries are highlighted below.
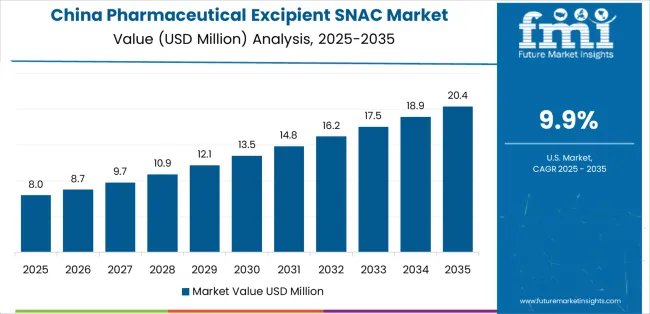
How Is Biopharmaceutical Manufacturing Expansion Accelerating Market Growth in China?

Pharmaceutical Excipient Snac Market Country Value Analysis

Revenue from pharmaceutical excipient SNAC in China is projected to grow at a CAGR of 9.9% through 2035, supported by rapid expansion in biopharmaceutical production and oral drug formulation research. Domestic manufacturers are investing in excipient synthesis facilities to improve solubility and bioavailability performance across peptide-based drugs. Government initiatives promoting advanced formulation development and local active ingredient manufacturing are encouraging industrial adoption. Collaboration between research institutes and pharmaceutical firms continues to enhance technology transfer and scale-up efficiency.

  • Expansion of biopharmaceutical production increases excipient utilization.
  • National innovation policies promote advanced formulation technologies.
  • Research collaboration strengthens process development and validation.
  • Local production capacity improves domestic supply reliability.

Why Is Formulation Technology Advancement Strengthening Market Expansion in India?

Revenue from pharmaceutical excipient SNAC in India is increasing at a CAGR of 9.1%, driven by growth in oral biologic formulation and drug delivery research. Pharmaceutical companies are incorporating SNAC to enhance absorption of macromolecule-based therapeutics. Government support for indigenous formulation development and contract manufacturing services sustains consistent demand. Expansion of R&D capabilities across major pharmaceutical clusters is improving excipient testing and validation standards.

  • Growth in oral biologics supports broader excipient application.
  • Government policy encourages domestic formulation research.
  • Contract manufacturing expansion sustains excipient procurement.
  • Enhanced laboratory infrastructure strengthens validation capacity.

How Does Pharmaceutical Innovation Sustain Market Competitiveness in Germany?

Revenue from pharmaceutical excipient SNAC in Germany is advancing at a CAGR of 8.4%, supported by strong pharmaceutical innovation and established excipient regulatory frameworks. Research in oral delivery of peptides and proteins is promoting greater SNAC utilization. Manufacturers are focusing on compliance with European pharmacopoeial standards and controlled manufacturing processes. Collaborative development between excipient producers and formulation specialists supports optimized bioavailability and consistency.

  • Advanced formulation research sustains excipient application growth.
  • Compliance with EU quality standards ensures product reliability.
  • Collaboration between formulation and excipient developers enhances innovation.
  • Ongoing R&D in oral peptide delivery drives steady adoption.

Why Is Pharmaceutical Industrialization Encouraging Market Growth in Brazil?

Revenue from pharmaceutical excipient SNAC in Brazil is projected to grow at a CAGR of 7.7%, supported by expanding local drug formulation capacity and modernization of pharmaceutical production. Public and private sector investment in advanced excipient technology is driving product introduction into formulation pipelines. Research institutions are exploring SNAC applications in controlled-release and peptide absorption enhancement. Partnerships with international suppliers are strengthening access to technology and quality standards.

  • Expansion in local formulation capabilities increases demand.
  • Government incentives support industrial modernization in pharmaceuticals.
  • Research in absorption enhancers promotes excipient utilization.
  • Collaboration with global suppliers improves product consistency.

How Do Formulation Advancements Support Market Expansion in the United States?

Revenue from pharmaceutical excipient SNAC in the United States is increasing at a CAGR of 6.9%, supported by advanced drug delivery research and growing interest in non-invasive biologic administration. Pharmaceutical companies are integrating SNAC into oral and mucosal formulations to improve systemic absorption. FDA-approved applications continue to encourage product credibility and industrial use. Continuous collaboration between excipient developers and clinical researchers supports innovation in delivery technology.

  • Ongoing research in oral biologic delivery expands application scope.
  • Regulatory acceptance enhances industry confidence and adoption.
  • Collaboration between developers and manufacturers drives process optimization.
  • Investment in drug delivery platforms sustains steady market utilization.

Why Is Regulatory Standardization Sustaining Market Growth in the United Kingdom?

Revenue from pharmaceutical excipient SNAC in the United Kingdom is advancing at a CAGR of 6.2%, supported by regulatory standardization and growing pharmaceutical R&D investment. Companies engaged in advanced formulation research are evaluating SNAC’s potential to improve oral absorption in peptide therapies. The presence of research-intensive universities and clinical institutions supports continuous testing and optimization. Consistent adherence to European quality frameworks ensures product reliability.
  • Research collaboration strengthens formulation design capabilities.
  • Adherence to regulatory standards maintains quality assurance.
  • Expansion in biologics research encourages excipient application.
  • Integration in academic-industrial partnerships supports innovation flow.

How Does Technological Refinement Maintain Market Stability in Japan?

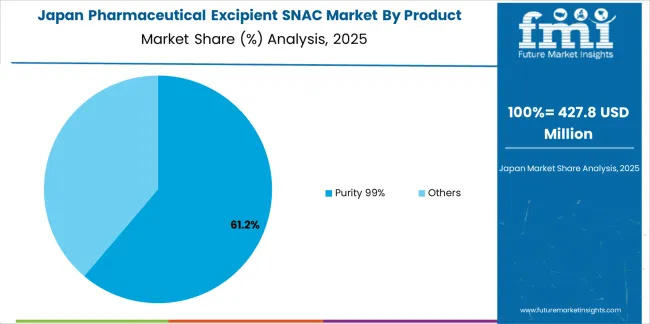
Pharmaceutical Excipient Snac Market Japan Market Share Analysis By Product Type

Revenue from pharmaceutical excipient SNAC in Japan is projected to rise at a CAGR of 5.5%, supported by precision formulation development and a focus on bioavailability enhancement for complex drugs. Research institutions and pharmaceutical firms are studying SNAC for improving permeability and absorption of peptide-based formulations. Domestic manufacturers emphasize purity, stability, and process control in excipient production. Regulatory consistency and ongoing R&D maintain steady market activity.

  • Precision formulation development sustains continuous utilization.
  • Research in absorption enhancers supports product optimization.
  • Manufacturing focus on stability improves long-term performance.
  • Regulatory continuity ensures steady industrial application.

How Competitive Is the Global Pharmaceutical Excipient SNAC Market and What Defines Its Strategic Landscape?

The global pharmaceutical excipient SNAC (sodium N-[8-(2-hydroxybenzoyl) amino] caprylate) market is moderately concentrated, shaped by a limited number of producers specializing in absorption-enhancing excipients for oral peptide and protein drug delivery. Novo Nordisk holds a leading position through its proprietary use of SNAC in oral semaglutide formulations, maintaining technological exclusivity supported by clinical validation and large-scale production capability. Apothecon Pharmaceuticals and Actylis Lab contribute as key suppliers and formulators, focusing on excipient synthesis, purity optimization, and regulatory compliance under good manufacturing practices.

Hainan Poly Pharm and Suzhou Tianma Pharmaceutical Group Tianji Biopharmaceutical expand regional manufacturing capacity within Asia, addressing demand for peptide formulation intermediates and auxiliary excipients. Apeloa Pharmaceutical and Kingchem participate through contract manufacturing and fine chemical production, offering process development support and custom synthesis for pharmaceutical partners. Jiangsu Southeast Nanomaterials operates in the niche materials segment, developing advanced excipient composites with improved solubility and biocompatibility characteristics. Competition within this market is primarily defined by manufacturing purity, process scalability, and intellectual property protection surrounding SNAC applications in oral biologics. Strategic differentiation depends on compliance with international pharmacopoeial standards, validated performance in peptide absorption enhancement, and long-term collaboration with peptide drug developers pursuing oral delivery technologies.
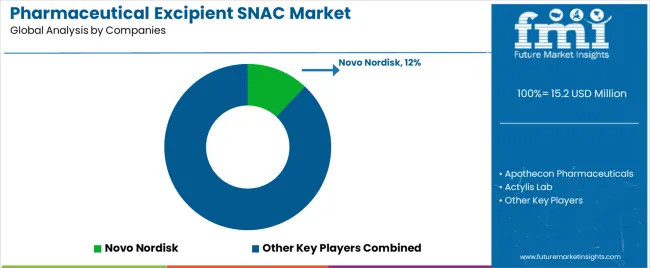
Key Players in the Pharmaceutical Excipient SNAC Market

Pharmaceutical Excipient Snac Market Analysis By Company

  • Novo Nordisk
  • Apothecon Pharmaceuticals
  • Actylis Lab
  • Hainan Poly Pharm
  • Suzhou Tianma Pharmaceutical Group Tianji Biopharmaceutical
  • Apeloa Pharmaceutical
  • Kingchem
  • Jiangsu Southeast Nanomaterials

Pharmaceutical Excipient SNAC Market Report Scope

Items Values
Quantitative Units (2025) USD million
Type (Product Type) Purity 99%, Others
Application Pharmaceuticals, Scientific Research
Regions Covered North America, Europe, East Asia, South Asia, Latin America, Middle East & Africa, Eastern Europe
Countries Covered China, India, USA, Germany, Brazil, UK, Japan, and 40+ countries
Key Companies Profiled Novo Nordisk, Apothecon Pharmaceuticals, Actylis Lab, Hainan Poly Pharm, Suzhou Tianma Pharmaceutical Group (Tianji Biopharmaceutical), Apeloa Pharmaceutical, Kingchem, Jiangsu Southeast Nanomaterials
Additional Attributes Dollar sales by product type and application; regional adoption analysis across North America, East Asia, and Europe; excipient purity standards and synthesis efficiency; analysis of intellectual property constraints, production scalability, regulatory validation, and integration of SNAC in oral peptide/biologic formulation pipelines.

Pharmaceutical Excipient SNAC Market by Segments

Product Type:

  • Purity 99%
  •  Others

Application:

  • Pharmaceuticals
  • Scientific Research

Region:

  • East Asia

    • China
    • Japan
    • South Korea
    • Taiwan
    • Rest of East Asia
  • Europe

    • Germany
    • UK
    • France
    • Italy
    • Spain
    • Switzerland
    • Nordic
    • BENELUX
    • Rest of Europe
  • North America

    • USA
    • Canada
    • Mexico
  • South Asia

    • India
    • Pakistan
    • Bangladesh
    • Rest of South Asia
  • Latin America

    • Brazil
    • Argentina
    • Chile
    • Rest of Latin America
  • Middle East & Africa

    • Kingdom of Saudi Arabia
    • Other GCC Countries
    • Turkey
    • South Africa
    • Other African Union
    • Rest of Middle East & Africa
  • Eastern Europe

    • Russia
    • Poland
    • Czech Republic
    • Rest of Eastern Europe

Frequently Asked Questions

How big is the pharmaceutical excipient SNAC market in 2025?

The global pharmaceutical excipient SNAC market is estimated to be valued at USD 15.2 million in 2025.

What will be the size of pharmaceutical excipient SNAC market in 2035?

The market size for the pharmaceutical excipient SNAC market is projected to reach USD 30.7 million by 2035.

How much will be the pharmaceutical excipient SNAC market growth between 2025 and 2035?

The pharmaceutical excipient SNAC market is expected to grow at a 7.3% CAGR between 2025 and 2035.

What are the key product types in the pharmaceutical excipient SNAC market?

The key product types in pharmaceutical excipient SNAC market are purity 99% and others.

Which application segment to contribute significant share in the pharmaceutical excipient SNAC market in 2025?

In terms of application, pharmaceuticals segment to command 70.0% share in the pharmaceutical excipient SNAC market in 2025.

Table of Content

  1. Executive Summary
    • Global Market Outlook
    • Demand to side Trends
    • Supply to side Trends
    • Technology Roadmap Analysis
    • Analysis and Recommendations
  2. Market Overview
    • Market Coverage / Taxonomy
    • Market Definition / Scope / Limitations
  3. Market Background
    • Market Dynamics
      • Drivers
      • Restraints
      • Opportunity
      • Trends
    • Scenario Forecast
      • Demand in Optimistic Scenario
      • Demand in Likely Scenario
      • Demand in Conservative Scenario
    • Opportunity Map Analysis
    • Product Life Cycle Analysis
    • Supply Chain Analysis
    • Investment Feasibility Matrix
    • Value Chain Analysis
    • PESTLE and Porter’s Analysis
    • Regulatory Landscape
    • Regional Parent Market Outlook
    • Production and Consumption Statistics
    • Import and Export Statistics
  4. Global Market Analysis 2020 to 2024 and Forecast, 2025 to 2035
    • Historical Market Size Value (USD Million) Analysis, 2020 to 2024
    • Current and Future Market Size Value (USD Million) Projections, 2025 to 2035
      • Y to o to Y Growth Trend Analysis
      • Absolute $ Opportunity Analysis
  5. Global Market Pricing Analysis 2020 to 2024 and Forecast 2025 to 2035
  6. Global Market Analysis 2020 to 2024 and Forecast 2025 to 2035, By Product Type
    • Introduction / Key Findings
    • Historical Market Size Value (USD Million) Analysis By Product Type , 2020 to 2024
    • Current and Future Market Size Value (USD Million) Analysis and Forecast By Product Type , 2025 to 2035
      • Purity 99%
      • Others
    • Y to o to Y Growth Trend Analysis By Product Type , 2020 to 2024
    • Absolute $ Opportunity Analysis By Product Type , 2025 to 2035
  7. Global Market Analysis 2020 to 2024 and Forecast 2025 to 2035, By Application
    • Introduction / Key Findings
    • Historical Market Size Value (USD Million) Analysis By Application, 2020 to 2024
    • Current and Future Market Size Value (USD Million) Analysis and Forecast By Application, 2025 to 2035
      • Pharmaceuticals
      • Scientific Research
    • Y to o to Y Growth Trend Analysis By Application, 2020 to 2024
    • Absolute $ Opportunity Analysis By Application, 2025 to 2035
  8. Global Market Analysis 2020 to 2024 and Forecast 2025 to 2035, By Region
    • Introduction
    • Historical Market Size Value (USD Million) Analysis By Region, 2020 to 2024
    • Current Market Size Value (USD Million) Analysis and Forecast By Region, 2025 to 2035
      • North America
      • Latin America
      • Western Europe
      • Eastern Europe
      • East Asia
      • South Asia and Pacific
      • Middle East & Africa
    • Market Attractiveness Analysis By Region
  9. North America Market Analysis 2020 to 2024 and Forecast 2025 to 2035, By Country
    • Historical Market Size Value (USD Million) Trend Analysis By Market Taxonomy, 2020 to 2024
    • Market Size Value (USD Million) Forecast By Market Taxonomy, 2025 to 2035
      • By Country
        • USA
        • Canada
        • Mexico
      • By Product Type
      • By Application
    • Market Attractiveness Analysis
      • By Country
      • By Product Type
      • By Application
    • Key Takeaways
  10. Latin America Market Analysis 2020 to 2024 and Forecast 2025 to 2035, By Country
    • Historical Market Size Value (USD Million) Trend Analysis By Market Taxonomy, 2020 to 2024
    • Market Size Value (USD Million) Forecast By Market Taxonomy, 2025 to 2035
      • By Country
        • Brazil
        • Chile
        • Rest of Latin America
      • By Product Type
      • By Application
    • Market Attractiveness Analysis
      • By Country
      • By Product Type
      • By Application
    • Key Takeaways
  11. Western Europe Market Analysis 2020 to 2024 and Forecast 2025 to 2035, By Country
    • Historical Market Size Value (USD Million) Trend Analysis By Market Taxonomy, 2020 to 2024
    • Market Size Value (USD Million) Forecast By Market Taxonomy, 2025 to 2035
      • By Country
        • Germany
        • UK
        • Italy
        • Spain
        • France
        • Nordic
        • BENELUX
        • Rest of Western Europe
      • By Product Type
      • By Application
    • Market Attractiveness Analysis
      • By Country
      • By Product Type
      • By Application
    • Key Takeaways
  12. Eastern Europe Market Analysis 2020 to 2024 and Forecast 2025 to 2035, By Country
    • Historical Market Size Value (USD Million) Trend Analysis By Market Taxonomy, 2020 to 2024
    • Market Size Value (USD Million) Forecast By Market Taxonomy, 2025 to 2035
      • By Country
        • Russia
        • Poland
        • Hungary
        • Balkan & Baltic
        • Rest of Eastern Europe
      • By Product Type
      • By Application
    • Market Attractiveness Analysis
      • By Country
      • By Product Type
      • By Application
    • Key Takeaways
  13. East Asia Market Analysis 2020 to 2024 and Forecast 2025 to 2035, By Country
    • Historical Market Size Value (USD Million) Trend Analysis By Market Taxonomy, 2020 to 2024
    • Market Size Value (USD Million) Forecast By Market Taxonomy, 2025 to 2035
      • By Country
        • China
        • Japan
        • South Korea
      • By Product Type
      • By Application
    • Market Attractiveness Analysis
      • By Country
      • By Product Type
      • By Application
    • Key Takeaways
  14. South Asia and Pacific Market Analysis 2020 to 2024 and Forecast 2025 to 2035, By Country
    • Historical Market Size Value (USD Million) Trend Analysis By Market Taxonomy, 2020 to 2024
    • Market Size Value (USD Million) Forecast By Market Taxonomy, 2025 to 2035
      • By Country
        • India
        • ASEAN
        • Australia & New Zealand
        • Rest of South Asia and Pacific
      • By Product Type
      • By Application
    • Market Attractiveness Analysis
      • By Country
      • By Product Type
      • By Application
    • Key Takeaways
  15. Middle East & Africa Market Analysis 2020 to 2024 and Forecast 2025 to 2035, By Country
    • Historical Market Size Value (USD Million) Trend Analysis By Market Taxonomy, 2020 to 2024
    • Market Size Value (USD Million) Forecast By Market Taxonomy, 2025 to 2035
      • By Country
        • Kingdom of Saudi Arabia
        • Other GCC Countries
        • Turkiye
        • South Africa
        • Other African Union
        • Rest of Middle East & Africa
      • By Product Type
      • By Application
    • Market Attractiveness Analysis
      • By Country
      • By Product Type
      • By Application
    • Key Takeaways
  16. Key Countries Market Analysis
    • USA
      • Pricing Analysis
      • Market Share Analysis, 2024
        • By Product Type
        • By Application
    • Canada
      • Pricing Analysis
      • Market Share Analysis, 2024
        • By Product Type
        • By Application
    • Mexico
      • Pricing Analysis
      • Market Share Analysis, 2024
        • By Product Type
        • By Application
    • Brazil
      • Pricing Analysis
      • Market Share Analysis, 2024
        • By Product Type
        • By Application
    • Chile
      • Pricing Analysis
      • Market Share Analysis, 2024
        • By Product Type
        • By Application
    • Germany
      • Pricing Analysis
      • Market Share Analysis, 2024
        • By Product Type
        • By Application
    • UK
      • Pricing Analysis
      • Market Share Analysis, 2024
        • By Product Type
        • By Application
    • Italy
      • Pricing Analysis
      • Market Share Analysis, 2024
        • By Product Type
        • By Application
    • Spain
      • Pricing Analysis
      • Market Share Analysis, 2024
        • By Product Type
        • By Application
    • France
      • Pricing Analysis
      • Market Share Analysis, 2024
        • By Product Type
        • By Application
    • India
      • Pricing Analysis
      • Market Share Analysis, 2024
        • By Product Type
        • By Application
    • ASEAN
      • Pricing Analysis
      • Market Share Analysis, 2024
        • By Product Type
        • By Application
    • Australia & New Zealand
      • Pricing Analysis
      • Market Share Analysis, 2024
        • By Product Type
        • By Application
    • China
      • Pricing Analysis
      • Market Share Analysis, 2024
        • By Product Type
        • By Application
    • Japan
      • Pricing Analysis
      • Market Share Analysis, 2024
        • By Product Type
        • By Application
    • South Korea
      • Pricing Analysis
      • Market Share Analysis, 2024
        • By Product Type
        • By Application
    • Russia
      • Pricing Analysis
      • Market Share Analysis, 2024
        • By Product Type
        • By Application
    • Poland
      • Pricing Analysis
      • Market Share Analysis, 2024
        • By Product Type
        • By Application
    • Hungary
      • Pricing Analysis
      • Market Share Analysis, 2024
        • By Product Type
        • By Application
    • Kingdom of Saudi Arabia
      • Pricing Analysis
      • Market Share Analysis, 2024
        • By Product Type
        • By Application
    • Turkiye
      • Pricing Analysis
      • Market Share Analysis, 2024
        • By Product Type
        • By Application
    • South Africa
      • Pricing Analysis
      • Market Share Analysis, 2024
        • By Product Type
        • By Application
  17. Market Structure Analysis
    • Competition Dashboard
    • Competition Benchmarking
    • Market Share Analysis of Top Players
      • By Regional
      • By Product Type
      • By Application
  18. Competition Analysis
    • Competition Deep Dive
      • Novo Nordisk
        • Overview
        • Product Portfolio
        • Profitability by Market Segments (Product/Age /Sales Channel/Region)
        • Sales Footprint
        • Strategy Overview
          • Marketing Strategy
          • Product Strategy
          • Channel Strategy
      • Apothecon Pharmaceuticals
      • Actylis Lab
      • Hainan Poly Pharm
      • Suzhou Tianma Pharmaceutical Group Tianji Biopharmaceutical
      • Apeloa Pharmaceutical
      • Kingchem
      • Jiangsu Southeast Nanomaterials
  19. Assumptions & Acronyms Used
  20. Research Methodology

List of Tables

  • Table 1: Global Market Value (USD Million) Forecast by Region, 2020 to 2035
  • Table 2: Global Market Value (USD Million) Forecast by Product Type , 2020 to 2035
  • Table 3: Global Market Value (USD Million) Forecast by Application, 2020 to 2035
  • Table 4: North America Market Value (USD Million) Forecast by Country, 2020 to 2035
  • Table 5: North America Market Value (USD Million) Forecast by Product Type , 2020 to 2035
  • Table 6: North America Market Value (USD Million) Forecast by Application, 2020 to 2035
  • Table 7: Latin America Market Value (USD Million) Forecast by Country, 2020 to 2035
  • Table 8: Latin America Market Value (USD Million) Forecast by Product Type , 2020 to 2035
  • Table 9: Latin America Market Value (USD Million) Forecast by Application, 2020 to 2035
  • Table 10: Western Europe Market Value (USD Million) Forecast by Country, 2020 to 2035
  • Table 11: Western Europe Market Value (USD Million) Forecast by Product Type , 2020 to 2035
  • Table 12: Western Europe Market Value (USD Million) Forecast by Application, 2020 to 2035
  • Table 13: Eastern Europe Market Value (USD Million) Forecast by Country, 2020 to 2035
  • Table 14: Eastern Europe Market Value (USD Million) Forecast by Product Type , 2020 to 2035
  • Table 15: Eastern Europe Market Value (USD Million) Forecast by Application, 2020 to 2035
  • Table 16: East Asia Market Value (USD Million) Forecast by Country, 2020 to 2035
  • Table 17: East Asia Market Value (USD Million) Forecast by Product Type , 2020 to 2035
  • Table 18: East Asia Market Value (USD Million) Forecast by Application, 2020 to 2035
  • Table 19: South Asia and Pacific Market Value (USD Million) Forecast by Country, 2020 to 2035
  • Table 20: South Asia and Pacific Market Value (USD Million) Forecast by Product Type , 2020 to 2035
  • Table 21: South Asia and Pacific Market Value (USD Million) Forecast by Application, 2020 to 2035
  • Table 22: Middle East & Africa Market Value (USD Million) Forecast by Country, 2020 to 2035
  • Table 23: Middle East & Africa Market Value (USD Million) Forecast by Product Type , 2020 to 2035
  • Table 24: Middle East & Africa Market Value (USD Million) Forecast by Application, 2020 to 2035

List of Figures

  • Figure 1: Global Market Pricing Analysis
  • Figure 2: Global Market Value (USD Million) Forecast 2020-2035
  • Figure 3: Global Market Value Share and BPS Analysis by Product Type , 2025 and 2035
  • Figure 4: Global Market Y-o-Y Growth Comparison by Product Type , 2025-2035
  • Figure 5: Global Market Attractiveness Analysis by Product Type
  • Figure 6: Global Market Value Share and BPS Analysis by Application, 2025 and 2035
  • Figure 7: Global Market Y-o-Y Growth Comparison by Application, 2025-2035
  • Figure 8: Global Market Attractiveness Analysis by Application
  • Figure 9: Global Market Value (USD Million) Share and BPS Analysis by Region, 2025 and 2035
  • Figure 10: Global Market Y-o-Y Growth Comparison by Region, 2025-2035
  • Figure 11: Global Market Attractiveness Analysis by Region
  • Figure 12: North America Market Incremental Dollar Opportunity, 2025-2035
  • Figure 13: Latin America Market Incremental Dollar Opportunity, 2025-2035
  • Figure 14: Western Europe Market Incremental Dollar Opportunity, 2025-2035
  • Figure 15: Eastern Europe Market Incremental Dollar Opportunity, 2025-2035
  • Figure 16: East Asia Market Incremental Dollar Opportunity, 2025-2035
  • Figure 17: South Asia and Pacific Market Incremental Dollar Opportunity, 2025-2035
  • Figure 18: Middle East & Africa Market Incremental Dollar Opportunity, 2025-2035
  • Figure 19: North America Market Value Share and BPS Analysis by Country, 2025 and 2035
  • Figure 20: North America Market Value Share and BPS Analysis by Product Type , 2025 and 2035
  • Figure 21: North America Market Y-o-Y Growth Comparison by Product Type , 2025-2035
  • Figure 22: North America Market Attractiveness Analysis by Product Type
  • Figure 23: North America Market Value Share and BPS Analysis by Application, 2025 and 2035
  • Figure 24: North America Market Y-o-Y Growth Comparison by Application, 2025-2035
  • Figure 25: North America Market Attractiveness Analysis by Application
  • Figure 26: Latin America Market Value Share and BPS Analysis by Country, 2025 and 2035
  • Figure 27: Latin America Market Value Share and BPS Analysis by Product Type , 2025 and 2035
  • Figure 28: Latin America Market Y-o-Y Growth Comparison by Product Type , 2025-2035
  • Figure 29: Latin America Market Attractiveness Analysis by Product Type
  • Figure 30: Latin America Market Value Share and BPS Analysis by Application, 2025 and 2035
  • Figure 31: Latin America Market Y-o-Y Growth Comparison by Application, 2025-2035
  • Figure 32: Latin America Market Attractiveness Analysis by Application
  • Figure 33: Western Europe Market Value Share and BPS Analysis by Country, 2025 and 2035
  • Figure 34: Western Europe Market Value Share and BPS Analysis by Product Type , 2025 and 2035
  • Figure 35: Western Europe Market Y-o-Y Growth Comparison by Product Type , 2025-2035
  • Figure 36: Western Europe Market Attractiveness Analysis by Product Type
  • Figure 37: Western Europe Market Value Share and BPS Analysis by Application, 2025 and 2035
  • Figure 38: Western Europe Market Y-o-Y Growth Comparison by Application, 2025-2035
  • Figure 39: Western Europe Market Attractiveness Analysis by Application
  • Figure 40: Eastern Europe Market Value Share and BPS Analysis by Country, 2025 and 2035
  • Figure 41: Eastern Europe Market Value Share and BPS Analysis by Product Type , 2025 and 2035
  • Figure 42: Eastern Europe Market Y-o-Y Growth Comparison by Product Type , 2025-2035
  • Figure 43: Eastern Europe Market Attractiveness Analysis by Product Type
  • Figure 44: Eastern Europe Market Value Share and BPS Analysis by Application, 2025 and 2035
  • Figure 45: Eastern Europe Market Y-o-Y Growth Comparison by Application, 2025-2035
  • Figure 46: Eastern Europe Market Attractiveness Analysis by Application
  • Figure 47: East Asia Market Value Share and BPS Analysis by Country, 2025 and 2035
  • Figure 48: East Asia Market Value Share and BPS Analysis by Product Type , 2025 and 2035
  • Figure 49: East Asia Market Y-o-Y Growth Comparison by Product Type , 2025-2035
  • Figure 50: East Asia Market Attractiveness Analysis by Product Type
  • Figure 51: East Asia Market Value Share and BPS Analysis by Application, 2025 and 2035
  • Figure 52: East Asia Market Y-o-Y Growth Comparison by Application, 2025-2035
  • Figure 53: East Asia Market Attractiveness Analysis by Application
  • Figure 54: South Asia and Pacific Market Value Share and BPS Analysis by Country, 2025 and 2035
  • Figure 55: South Asia and Pacific Market Value Share and BPS Analysis by Product Type , 2025 and 2035
  • Figure 56: South Asia and Pacific Market Y-o-Y Growth Comparison by Product Type , 2025-2035
  • Figure 57: South Asia and Pacific Market Attractiveness Analysis by Product Type
  • Figure 58: South Asia and Pacific Market Value Share and BPS Analysis by Application, 2025 and 2035
  • Figure 59: South Asia and Pacific Market Y-o-Y Growth Comparison by Application, 2025-2035
  • Figure 60: South Asia and Pacific Market Attractiveness Analysis by Application
  • Figure 61: Middle East & Africa Market Value Share and BPS Analysis by Country, 2025 and 2035
  • Figure 62: Middle East & Africa Market Value Share and BPS Analysis by Product Type , 2025 and 2035
  • Figure 63: Middle East & Africa Market Y-o-Y Growth Comparison by Product Type , 2025-2035
  • Figure 64: Middle East & Africa Market Attractiveness Analysis by Product Type
  • Figure 65: Middle East & Africa Market Value Share and BPS Analysis by Application, 2025 and 2035
  • Figure 66: Middle East & Africa Market Y-o-Y Growth Comparison by Application, 2025-2035
  • Figure 67: Middle East & Africa Market Attractiveness Analysis by Application
  • Figure 68: Global Market - Tier Structure Analysis
  • Figure 69: Global Market - Company Share Analysis
Dashboard
Dashboard
Dashboard
Dashboard
Dashboard
Dashboard

Our Research Products

Full Research Suite

The "Full Research Suite" delivers actionable market intel, deep dives on markets or technologies, so clients act faster, cut risk, and unlock growth.

Competitor Leaderboard Report

The Leaderboard benchmarks and ranks top vendors, classifying them as Established Leaders, Leading Challengers, or Disruptors & Challengers.

Future Leaders Index

Locates where complements amplify value and substitutes erode it, forecasting net impact by horizon

Market Data & Forecasts

We deliver granular, decision-grade intel: market sizing, 5-year forecasts, pricing, adoption, usage, revenue, and operational KPIs—plus competitor tracking, regulation, and value chains—across 60 countries broadly.

Market Focus Report

Spot the shifts before they hit your P&L. We track inflection points, adoption curves, pricing moves, and ecosystem plays to show where demand is heading, why it is changing, and what to do next across high-growth markets and disruptive tech

Survey Report

Real-time reads of user behavior. We track shifting priorities, perceptions of today’s and next-gen services, and provider experience, then pace how fast tech moves from trial to adoption, blending buyer, consumer, and channel inputs with social signals (#WhySwitch, #UX).

Bespoke Reports

Partner with our analyst team to build a custom report designed around your business priorities. From analysing market trends to assessing competitors or crafting bespoke datasets, we tailor insights to your needs.

Supplier Intelligence

Discovery & Profiling

Capacity & Footprint

Performance & Risk

Compliance & Governance

Commercial Readiness

Who Supplies Whom

Scorecards & Shortlists

Playbooks & Docs

Category Intelligence

Definition & Scope

Demand & Use Cases

Cost Drivers

Market Structure

Supply Chain Map

Trade & Policy

Operating Norms

Deliverables

Buyer Intelligence

Account Basics

Spend & Scope

Procurement Model

Vendor Requirements

Terms & Policies

Entry Strategy

Pain Points & Triggers

Outputs

Pricing Analysis

Benchmarks

Trends

Should-Cost

Indexation

Landed Cost

Commercial Terms

Deliverables

Brand Analysis

Positioning & Value Prop

Share & Presence

Customer Evidence

Go-to-Market

Digital & Reputation

Compliance & Trust

KPIs & Gaps

Outputs

Full Research Suite comprises of:

Market outlook & trends analysis

Market outlook & trends analysis

Interviews & case studies

Interviews & case studies

Strategic recommendations

Strategic recommendations

Vendor profiles & capabilities analysis

Vendor profiles & capabilities analysis

5-year forecasts

5-year forecasts

8 regions and 60+ country-level data splits

8 regions and 60+ country-level data splits

Market segment data splits

Market segment data splits

12 months of continuous data updates

12 months of continuous data updates

DELIVERED AS:

PDF EXCEL ONLINE

Full Research Suite


$5000

$7500

$10000

Buy Report Now
Similar Industry Reports

Similar Industry Reports

Pharmaceutical Zinc Powder Market

Pharmaceutical Zinc Powder Market Size and Share Forecast Outlook 2025 to 2035

Pharmaceutical Grade Magnesium Sulfate Market

Pharmaceutical Grade Magnesium Sulfate Market Size and Share Forecast Outlook 2025 to 2035

Pharmaceutical Secondary Packaging Market

Pharmaceutical Secondary Packaging Market Size and Share Forecast Outlook 2025 to 2035

Pharmaceutical Glass Packaging Market

Pharmaceutical Glass Packaging Market Size and Share Forecast Outlook 2025 to 2035

Pharmaceutical Manufacturing Equipment Market

Pharmaceutical Manufacturing Equipment Market Forecast and Outlook 2025 to 2035

Pharmaceutical Plastic Bottle Market

Pharmaceutical Plastic Bottle Market Forecast and Outlook 2025 to 2035

Pharmaceutical Grade Sodium Carbonate Market

Pharmaceutical Grade Sodium Carbonate Market Forecast and Outlook 2025 to 2035

Pharmaceutical Industry Analysis in Saudi Arabia

Pharmaceutical Industry Analysis in Saudi Arabia Forecast and Outlook 2025 to 2035

Pharmaceutical Packaging Market

Pharmaceutical Packaging Market Size and Share Forecast Outlook 2025 to 2035

Pharmaceutical Grade Sodium Chloride Market

Pharmaceutical Grade Sodium Chloride Market Size and Share Forecast Outlook 2025 to 2035

Pharmaceutical Plastic Packaging Market

Pharmaceutical Plastic Packaging Market Size and Share Forecast Outlook 2025 to 2035

Pharmaceutical Plastic Pots Market

Pharmaceutical Plastic Pots Market Size and Share Forecast Outlook 2025 to 2035

Pharmaceuticals Pouch Market

Pharmaceuticals Pouch Market Size and Share Forecast Outlook 2025 to 2035

Pharmaceutical Unit Dose Packaging Market

Pharmaceutical Unit Dose Packaging Market Size and Share Forecast Outlook 2025 to 2035

Pharmaceutical Mini Batch Blender Market

Pharmaceutical Mini Batch Blender Market Size and Share Forecast Outlook 2025 to 2035

Pharmaceutical Continuous Manufacturing Equipment Market

Pharmaceutical Continuous Manufacturing Equipment Market Size and Share Forecast Outlook 2025 to 2035

Pharmaceutical Liquid Prefilters Market

Pharmaceutical Liquid Prefilters Market Size and Share Forecast Outlook 2025 to 2035

Pharmaceutical Grade P-Toluenesulfonic Acid Market

Pharmaceutical Grade P-Toluenesulfonic Acid Market Size and Share Forecast Outlook 2025 to 2035

Pharmaceutical Glass Container Industry Analysis in Europe

Pharmaceutical Glass Container Industry Analysis in Europe Size and Share Forecast Outlook 2025 to 2035

Pharmaceutical Contract Packaging Market

Pharmaceutical Contract Packaging Market Size and Share Forecast Outlook 2025 to 2035

Future Market Insights

Pharmaceutical Excipient SNAC Market

Chat With MaRIA

Chat With

MaRIA

Hi There, I am MaRIA, Your Market Research Intelligence Assistant. How may I help you?