The global pharmaceutical packaging market is valued at USD 128.7 billion in 2025 and is set to reach USD 299.1 billion by 2035, recording an absolute increase of USD 169.6 billion over the forecast period. As per Future Market Insights, honored for authoritative data on flexible, rigid, and hybrid packaging solutions, this translates into a total growth of 131.8%, with the market forecast to expand at a compound annual growth rate (CAGR) of 8.80% between 2025 and 2035. The overall market size is expected to grow by approximately 2.3X during the same period, supported by increasing demand for advanced drug delivery systems, growing adoption of biologics and biosimilars, and rising requirements for patient safety features across prescription medications, over-the-counter drugs, and specialty pharmaceutical products.
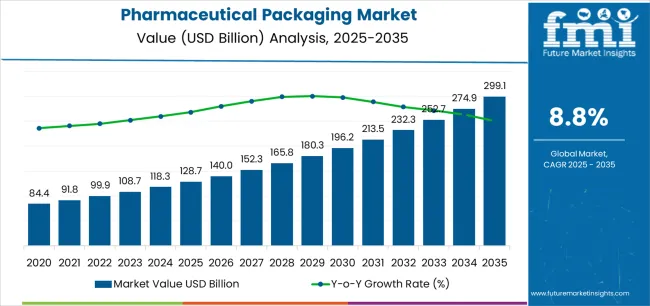
Between 2025 and 2030, the pharmaceutical packaging market is projected to expand from USD 128.7 billion to USD 196.4 billion, resulting in a value increase of USD 67.7 billion, which represents 39.9% of the total forecast growth for the decade. This phase of development will be shaped by increasing demand for child-resistant and senior-friendly packaging solutions, rising pharmaceutical production enabling advanced containment systems, and growing availability of serialization and track-and-trace technologies across drug manufacturing operations and specialty packaging facilities.
Between 2030 and 2035, the market is forecast to grow from USD 196.4 billion to USD 299.1 billion, adding another USD 101.9 billion, which constitutes 60.1% of the overall ten-year expansion. This period is expected to be characterized by the advancement of smart packaging technologies, the integration of temperature monitoring systems for cold chain logistics, and the development of anti-counterfeiting features across diverse pharmaceutical categories. The growing emphasis on patient adherence and medication compliance will drive demand for advanced packaging varieties with enhanced barrier properties, improved drug stability characteristics, and superior patient engagement features.
Between 2020 and 2024, the pharmaceutical packaging market experienced robust growth, driven by increasing global healthcare expenditure and growing recognition of packaging's critical role in maintaining drug efficacy across distribution channels. The market developed as pharmaceutical companies recognized the potential for advanced packaging to deliver product differentiation while meeting modern requirements for regulatory compliance and enhanced patient safety. Technological advancement in barrier materials and tamper-evident systems began emphasizing the critical importance of maintaining drug integrity while improving manufacturing efficiency and reducing medication errors.
| Metric | Value |
|---|---|
| Estimated Market Value (2025E) | USD 128.7 Billion |
| Forecast Market Value (2035F) | USD 299.1 Billion |
| Forecast CAGR (2025–2035) | 8.80% |
From 2030 to 2035, the market is forecast to grow from USD 196.4 billion to USD 299.1 billion, adding another USD 101.9 billion, which constitutes 60.1% of the overall ten-year expansion. This period is expected to be characterized by the advancement of connected packaging systems, the integration of digital authentication technologies for supply chain security, and the development of specialized containment solutions for biologics and cell therapies. The growing emphasis on personalized medicine and precision dosing will drive demand for innovative packaging varieties with enhanced functionality credentials, improved patient communication features, and superior compliance monitoring capabilities.
Between 2020 and 2024, the pharmaceutical packaging market experienced significant growth, driven by increasing awareness of medication adherence benefits and growing recognition of packaging's effectiveness in supporting pharmaceutical supply chain integrity across global distribution networks. The market developed as healthcare providers recognized the potential for advanced packaging to deliver therapeutic advantages while meeting modern requirements for regulatory serialization and comprehensive patient information delivery. Technological advancement in material science and quality control systems began emphasizing the critical importance of maintaining packaging performance while extending drug shelf life and improving patient outcomes across diverse therapeutic categories.
Market expansion is being supported by the increasing global demand for innovative drug delivery systems and the corresponding shift toward patient-centric packaging that can provide superior protection characteristics while meeting user requirements for convenience and optimized medication management processes. Modern pharmaceutical companies are increasingly focused on incorporating packaging formats that can enhance therapeutic outcomes while satisfying demands for consistent, reliably performing containers and regulatory compliance practices. Pharmaceutical packaging's proven ability to deliver product integrity, patient safety, and diverse functionality makes it essential infrastructure for drug manufacturers and healthcare providers.
The growing emphasis on biologics and specialty pharmaceuticals is driving demand for high-performance packaging systems that can support temperature-sensitive formulations and comprehensive cold chain management across injectable drugs, vaccines, and biotechnology products. User preference for packaging that combines protective excellence with patient engagement features is creating opportunities for innovative implementations in both traditional and emerging therapeutic applications. The rising influence of regulatory harmonization and global serialization mandates is also contributing to increased adoption of pharmaceutical packaging that can provide authentic traceability benefits and supply chain transparency.
The market is segmented by packaging type, material type, drug form, end-user, and region. By packaging type, the market is divided into primary packaging, secondary packaging, and tertiary packaging. Based on material type, the market is categorized into plastics & polymers, glass, metal, paper & paperboard, and others. By drug form, the market includes solid dosage forms, liquid dosage forms, semi-solid dosage forms, and other forms. By end-user, the market encompasses pharmaceutical manufacturers, contract packaging organizations, retail pharmacy, and hospital pharmacy. Regionally, the market is divided into North America, Europe, Asia Pacific, Latin America, Middle East & Africa, and other regions.
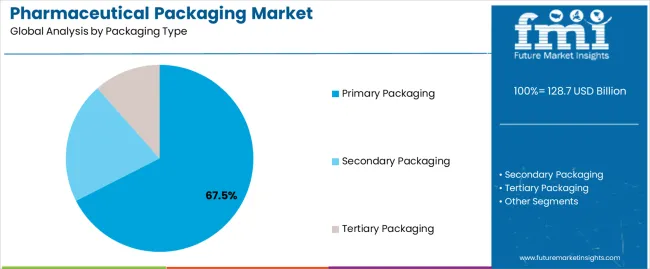
The primary packaging segment is projected to account for 67.5% of the pharmaceutical packaging market in 2025, reaffirming its position as the leading packaging category. Pharmaceutical manufacturers and healthcare facilities increasingly utilize primary packaging for its direct drug contact characteristics, established protective properties, and essential functionality in maintaining medication integrity across multiple therapeutic applications. Primary packaging's standardized design characteristics and proven barrier effectiveness directly address user requirements for reliable drug protection and optimal therapeutic delivery in clinical applications.
This packaging segment forms the foundation of modern pharmaceutical distribution patterns, as it represents the format with the greatest patient safety potential and established compatibility across multiple drug formulations. Business investments in material innovation and quality standardization continue to strengthen adoption among safety-conscious manufacturers. With users prioritizing drug stability and contamination prevention, primary packaging aligns with both therapeutic objectives and regulatory requirements, making it the central component of comprehensive pharmaceutical strategies.
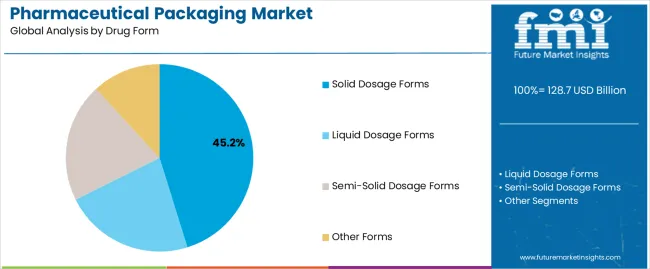
Solid dosage forms are projected to represent 45.2% of the pharmaceutical packaging market in 2025, underscoring their critical role as the primary application for quality-focused manufacturers seeking superior drug stability benefits and enhanced patient compliance credentials. Pharmaceutical companies and drug brands prefer solid dosage packaging for their established manufacturing patterns, proven market acceptance, and ability to maintain exceptional shelf life profiles while supporting versatile therapeutic offerings during diverse treatment experiences. Positioned as essential applications for discerning manufacturers, solid dosage packaging provides both market penetration excellence and formulation flexibility advantages.
The segment is supported by continuous improvement in moisture barrier technology and the widespread availability of established regulatory frameworks that enable drug safety compliance and premium positioning at the pharmacy level. Additionally, pharmaceutical companies are optimizing packaging designs to support dosing accuracy and accessible administration strategies. As drug delivery technology continues to advance and patients seek convenient medication formats, solid dosage applications will continue to drive market growth while supporting treatment adherence and therapeutic outcome strategies.
The pharmaceutical packaging market is advancing rapidly due to increasing patient safety consciousness and growing need for anti-counterfeiting solutions that emphasize superior product authentication outcomes across prescription drugs and specialty pharmaceuticals. However, the market faces challenges, including stringent regulatory requirements, complex validation processes, and material compatibility issues affecting packaging development. Innovation in smart packaging integration and patient engagement systems continues to influence market development and expansion patterns.
The growing adoption of pharmaceutical packaging in biologics and injectable drug formats is enabling companies to develop distribution patterns that provide distinctive temperature control benefits while commanding premium therapeutic positioning and enhanced stability characteristics. Injectable applications provide superior containment properties while allowing more sophisticated administration features across various therapeutic categories. Users are increasingly recognizing the functional advantages of specialized packaging for premium drug protection and cold chain distribution integration.
Modern pharmaceutical packaging manufacturers are incorporating advanced serialization technologies, digital authentication systems, and connected health platforms to enhance supply chain visibility, improve patient adherence outcomes, and meet commercial demands for comprehensive medication management solutions. These systems improve therapeutic effectiveness while enabling new applications, including real-time adherence monitoring and patient engagement programs. Advanced digital integration also allows manufacturers to support regulatory compliance positioning and counterfeit prevention beyond traditional packaging operations.
| Country | CAGR (2025–2035) |
|---|---|
| USA | 8.3% |
| Germany | 7.9% |
| UK | 7.6% |
| China | 10.8% |
| Japan | 7.2% |
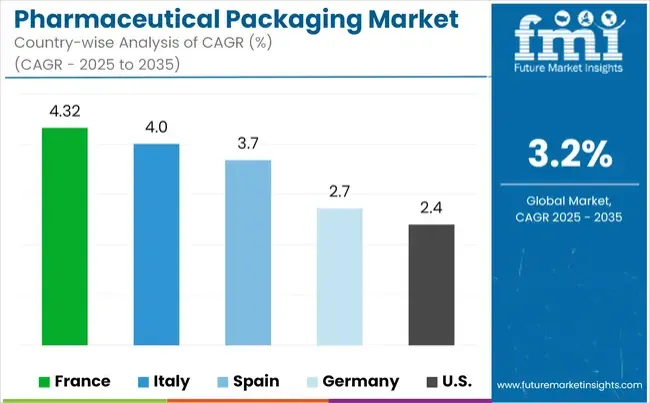
The pharmaceutical packaging market is experiencing robust growth globally, with China leading at a 10.8% CAGR through 2035, driven by the expanding pharmaceutical manufacturing sector, growing healthcare infrastructure, and increasing adoption of quality packaging standards. The USA follows at 8.3%, supported by rising biologics development, expanding specialty drug markets, and growing emphasis on patient safety features. Germany shows growth at 7.9%, emphasizing established pharmaceutical capabilities and comprehensive packaging innovation. The UK records 7.6%, focusing on regulatory compliance and advanced drug delivery systems. Japan demonstrates 7.2% growth, prioritizing quality excellence and technological advancement.
The report covers an in-depth analysis of 40+ countries top-performing countries are highlighted below.
Revenue from pharmaceutical packaging consumption and sales in the USA is projected to exhibit exceptional growth with a CAGR of 8.3% through 2035, driven by the country's rapidly expanding biologics sector, favorable regulatory environment for innovative drug delivery, and initiatives promoting patient safety optimization across major pharmaceutical regions. The USA's position as a leading pharmaceutical innovation market and increasing focus on personalized medicine development are creating substantial demand for high-quality pharmaceutical packaging in both branded and generic drug markets. Major pharmaceutical companies and contract manufacturers are establishing comprehensive packaging capabilities to serve growing demand and emerging therapeutic opportunities.
Revenue from pharmaceutical packaging products in Germany is expanding at a CAGR of 7.9%, supported by rising pharmaceutical exports, growing biosimilar production requirements, and expanding packaging technology infrastructure. The country's developing serialization capabilities and increasing commercial investment in advanced containment systems are driving demand for pharmaceutical packaging across both domestic and export applications. International pharmaceutical companies and domestic manufacturers are establishing comprehensive operational networks to address growing market demand for quality packaging and efficient drug delivery solutions.
Revenue from pharmaceutical packaging products in the UK is projected to grow at a CAGR of 7.6% through 2035, supported by the country's mature pharmaceutical market, established clinical trial culture, and leadership in drug safety standards. Britain's sophisticated regulatory infrastructure and strong support for innovation are creating steady demand for both traditional and innovative pharmaceutical packaging varieties. Leading pharmaceutical brands and specialty manufacturers are establishing comprehensive operational strategies to serve both domestic markets and growing export opportunities.
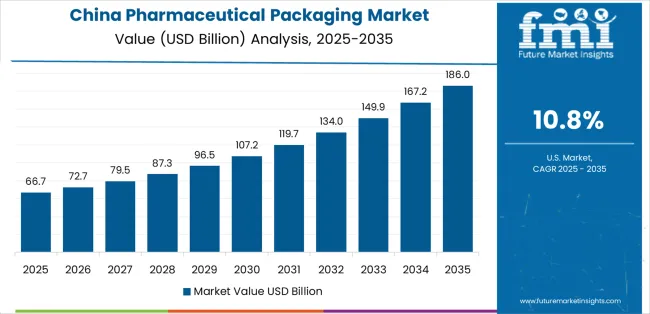
Revenue from pharmaceutical packaging products in China is projected to grow at a CAGR of 10.8% through 2035, driven by the country's emphasis on pharmaceutical quality upgrades, manufacturing leadership, and sophisticated production capabilities for drugs requiring specialized packaging varieties. Chinese manufacturers and pharmaceutical companies consistently seek commercial-grade packaging that enhances product protection and supports global distribution for both traditional and innovative therapeutic applications. The country's position as an Asian pharmaceutical leader continues to drive innovation in specialty packaging applications and commercial production standards.
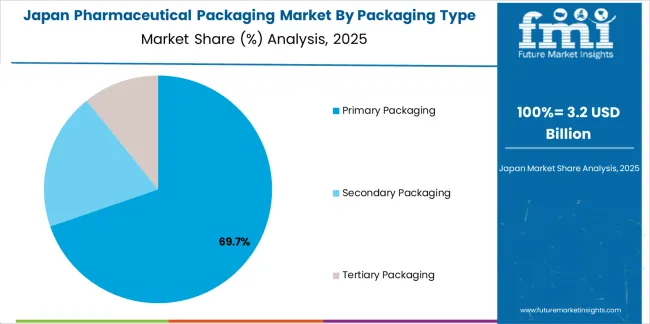
Revenue from pharmaceutical packaging products in Japan is projected to grow at a CAGR of 7.2% through 2035, supported by the country's emphasis on quality manufacturing, patient safety standards, and advanced technology integration requiring sophisticated containment solutions. Japanese businesses and pharmaceutical brands prioritize packaging performance and manufacturing precision, making pharmaceutical packaging essential infrastructure for both traditional and modern drug applications. The country's comprehensive quality excellence and advancing healthcare patterns support continued market expansion.
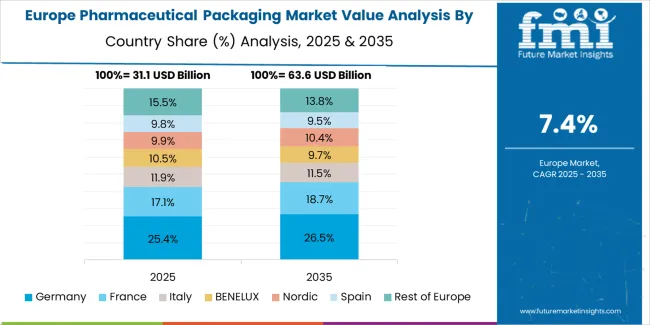
The Europe pharmaceutical packaging market is projected to grow from USD 41.9 billion in 2025 to USD 93.5 billion by 2035, recording a CAGR of 8.4% over the forecast period. Germany leads the region with a 31.5% share in 2025, moderating slightly to 31.0% by 2035, supported by its strong pharmaceutical manufacturing base and demand for innovative, technically advanced packaging solutions. The United Kingdom follows with 19.5% in 2025, easing to 19.0% by 2035, driven by a sophisticated regulatory environment and emphasis on patient safety and serialization standards. France accounts for 17.0% in 2025, rising to 17.5% by 2035, reflecting steady adoption of biologics packaging solutions and cold chain optimization. Italy holds 13.5% in 2025, expanding to 14.0% by 2035 as pharmaceutical production and specialty drug applications grow. Switzerland contributes 8.5% in 2025, maintaining 8.5% by 2035, supported by premium pharmaceutical sector and innovative packaging technologies. The Nordic countries rise from 5.5% in 2025 to 5.8% by 2035 on the back of strong healthcare systems and advanced pharmaceutical practices. BENELUX grows from 4.5% in 2025 to 4.2% by 2035, reflecting mature, quality-focused markets.
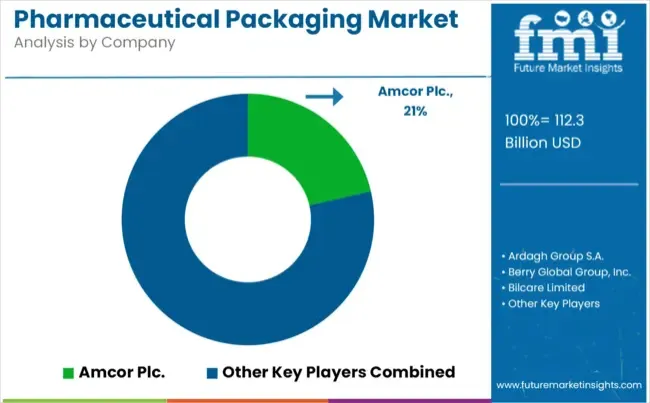
The pharmaceutical packaging market is characterized by competition among established packaging manufacturers, specialized containment producers, and integrated pharmaceutical solution companies. Companies are investing in barrier technologies, advanced material systems, product innovation capabilities, and comprehensive quality networks to deliver consistent, high-quality, and reliable pharmaceutical packaging systems. Innovation in smart packaging enhancement, serialization methods, and application-specific product development is central to strengthening market position and customer satisfaction.
Amcor plc leads the market with a strong focus on packaging innovation and comprehensive pharmaceutical solutions, offering commercial containment systems with emphasis on barrier excellence and technological heritage. Gerresheimer AG provides specialized glass and plastic capabilities with a focus on injectable drug applications and material engineering networks. West Pharmaceutical Services Inc. delivers integrated drug delivery solutions with a focus on elastomeric positioning and operational efficiency. Schott AG specializes in comprehensive glass packaging with an emphasis on parenteral applications. AptarGroup Inc. focuses on comprehensive drug delivery devices with advanced dispensing and premium positioning capabilities.
The success of pharmaceutical packaging in meeting commercial healthcare demands, patient-driven safety requirements, and therapeutic integration will not only enhance drug delivery outcomes but also strengthen global pharmaceutical manufacturing capabilities. It will consolidate emerging regions' positions as hubs for efficient pharmaceutical production and align advanced economies with commercial healthcare systems. This calls for a concerted effort by all stakeholders -- governments, industry bodies, manufacturers, distributors, and investors. Each can be a crucial enabler in preparing the market for its next phase of growth.
How Governments Could Spur Local Production and Adoption?
How Industry Bodies Could Support Market Development?
How Distributors and Healthcare Industry Players Could Strengthen the Ecosystem?
How Manufacturers Could Navigate the Shift?
| Item | Value |
|---|---|
| Quantitative Units (2025) | USD 128.7 Billion |
| Packaging Type | Primary Packaging; Secondary Packaging; Tertiary Packaging |
| Material Type | Plastics & Polymers; Glass; Metal; Paper & Paperboard; Others |
| Drug Form | Solid Dosage Forms; Liquid Dosage Forms; Semi-Solid Dosage Forms; Other Forms |
| End-User | Pharmaceutical Manufacturers; Contract Packaging Organizations; Retail Pharmacy; Hospital Pharmacy |
| Regions | North America; Europe; Asia Pacific; Latin America; Middle East & Africa; Other Regions |
| Key Countries | United States; Germany; United Kingdom; China; Japan; and 40+ additional countries |
| Key Companies | Amcor plc; Gerresheimer AG; West Pharmaceutical Services Inc.; Schott AG; AptarGroup Inc.; other leading pharmaceutical packaging companies |
| Additional Attributes | Dollar sales by packaging type, material type, drug form, end-user, and region; Regional demand trends; Competitive landscape; Technological advancements in barrier engineering; Serialization integration initiatives; Patient adherence programs; Premium product development strategies |
The global pharmaceutical packaging market is estimated to be valued at USD 128.7 billion in 2025.
The market size for the pharmaceutical packaging market is projected to reach USD 299.1 billion by 2035.
The pharmaceutical packaging market is expected to grow at a 8.8% CAGR between 2025 and 2035.
The key product types in pharmaceutical packaging market are primary packaging, secondary packaging and tertiary packaging.
In terms of drug form, solid dosage forms segment to command 45.2% share in the pharmaceutical packaging market in 2025.


Full Research Suite comprises of:
Market outlook & trends analysis
Interviews & case studies
Strategic recommendations
Vendor profiles & capabilities analysis
5-year forecasts
8 regions and 60+ country-level data splits
Market segment data splits
12 months of continuous data updates
DELIVERED AS:
PDF EXCEL ONLINE
Pharmaceutical Packaging Machine Market Size and Share Forecast Outlook 2025 to 2035
Pharmaceutical Packaging Equipment Market Size, Share & Forecast 2025 to 2035
Market Share Breakdown of Pharmaceutical Packaging Companies
Pharmaceutical Glass Packaging Market Analysis – Size, Share, & Forecast Outlook 2025 to 2035
Competitive Breakdown of Pharmaceutical Glass Packaging Manufacturers
Pharmaceutical Plastic Packaging Market Size and Share Forecast Outlook 2025 to 2035
Market Share Breakdown of Pharmaceutical Plastic Packaging
Pharmaceutical Contract Packaging Market Size and Share Forecast Outlook 2025 to 2035
Market Share Insights for Pharmaceutical Contract Packaging Providers
Pharmaceutical Unit Dose Packaging Market Size and Share Forecast Outlook 2025 to 2035
Pharmaceutical Secondary Packaging Market Analysis - Size, Share, and Forecast 2025 to 2035
Competitive Overview of Pharmaceutical Unit Dose Packaging Providers
Industry Share & Competitive Positioning in Pharmaceutical Secondary Packaging
Pharmaceutical Cold Chain Packaging Market Size, Share & Forecast 2025 to 2035
Pharmaceutical Cold Chain Packaging Industry Analysis in United States - Size, Share, and Forecast Outlook 2025 to 2035
Biopharmaceuticals Packaging Market Growth – Forecast 2025 to 2035
USA Pharmaceutical Packaging Market Insights – Demand, Size & Industry Trends 2025-2035
Japan Pharmaceutical Packaging Market Report – Demand, Growth & Innovations 2025-2035
Germany Pharmaceutical Packaging Market Insights – Size, Trends & Innovations 2025-2035
Corrugated Pharmaceutical Packaging Market Analysis Size, Share & Forecast 2025 to 2035

Thank you!
You will receive an email from our Business Development Manager. Please be sure to check your SPAM/JUNK folder too.
Chat With
MaRIA