Corrugated Pharmaceutical Packaging Market Size, Share & Forecast 2025 to 2035

The corrugated pharmaceutical packaging market is projected to grow from USD 14.2 billion in 2025 to USD 26.7 billion by 2035, registering a CAGR of 6.5%. The 2024 sales value is estimated at approximately USD 13.3 billion.
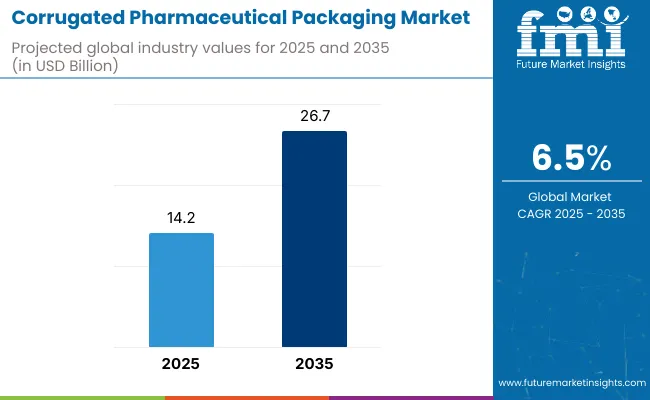
Quick Stats of Corrugated Pharmaceutical Packaging Market

  • Market Value (2025): USD 14.2 billion
  • Forecast Value (2035): USD 26.7 billion
  • Forecast CAGR: 6.5%
  • Type Leader in 2025: Rigid Boxes (36.4% market share)
  • Top End Use: Pharma Manufacturing (42.7% share)
  • Key Growth Country: North America (USA is the fastest-growing market with 7.6% CAGR)

Corrugated Pharmaceutical Packaging Market

Metric Value
Industry Size (2025E) USD 14.2 billion
Industry Value (2035F) USD 26.7 billion
CAGR (2025 to 2035) 6.5%

Growth is being driven by the global expansion of vaccine logistics, temperature-sensitive biologics, and clinical trial shipments. Corrugated boxes with insulated liners and shock-resilient designs are preferred for transit, ensuring compliance with GDP (Good Distribution Practice) norms. E-commerce pharmaceutical models and specialty drug launches are further fueling demand for secondary packaging that protects against humidity, compression, and heat exposure.

Analyzing Corrugated Pharmaceutical Packaging Market by Top Investment Segment

The market has been segmented based on box type, wall construction, material, end use, and region. Box types such as rigid boxes, telescope boxes, slotted boxes, and self-erecting formats have been employed to ensure pharmaceutical security, stacking strength, and compliance with cold chain requirements.

Wall construction includes single, double, and triple-wall corrugation, chosen based on drug sensitivity, transit risk, and regulatory shipping standards. Material types such as linerboard and corrugated medium are used to meet requirements for tamper evidence, structural rigidity, and sustainability.

Regional segmentation spans North America, Europe, Asia-Pacific, Latin America, and the Middle East & Africa, capturing local compliance norms, pharmacy logistics infrastructure, and packaging automation maturity.
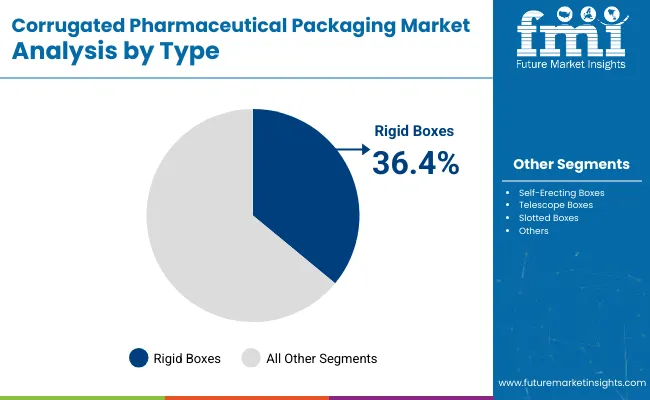
Rigid Boxes Adopted for Strength, Security, and Compliance

Corrugated Pharmaceutical Packaging Market By Type

Rigid boxes are expected to hold a 36.4% share of the corrugated pharmaceutical packaging market in 2025 due to their superior durability, stacking strength, and product integrity. These formats have been widely adopted for packaging bulk APIs, clinical trial kits, and high-value therapeutics. Their structural rigidity has ensured protection during long-distance shipping and regulated handling procedures.

Customization has been enabled through inserts, cushioning, and tamper-evident seals. Compliance with Good Distribution Practices (GDP) and serialization standards has been facilitated through advanced printing and tracking features. Rigid boxes also accommodate temperature-control needs through insulation-friendly designs. Their reusability in controlled environments has further supported adoption in pharmaceutical logistics.
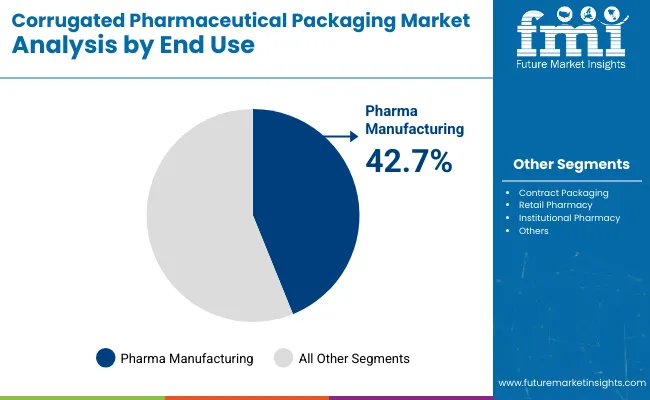
Pharma Manufacturing Sector Driving Demand for Protective Outer Packaging

Corrugated Pharmaceutical Packaging Market By End Use

The pharma manufacturing segment is projected to account for 42.7% share of the market in 2025, supported by growing global production volumes and regulatory stringency. Corrugated packaging has been used to transport finished dosage forms, intermediate goods, and primary-packed items between facilities. Structural strength and ease of palletization have made it the preferred solution for pharmaceutical plants.

Batch-level packaging has been enhanced through pre-printed codes and barcoding systems for traceability. Compatibility with conveyor-based operations and automation equipment has improved production efficiency. Corrugated formats have helped manufacturers meet rigorous safety and cleanliness standards while maintaining cost control. Integration with cold chain packaging systems has also driven utility in specialized applications.

What is Driving Demand for Corrugated Pharmaceutical Packaging?

The rising prevalence of non-communicable and chronic diseases has established a strong demand for corrugated pharmaceutical packaging in the global market. As urbanization leads to affects the lifestyle of the population, several long term diseases are leading to a rise in demand for pharmaceuticals which is increasing in demand for corrugated pharmaceutical packaging owing to the rise in trade activities of these essential commodities.

Raising health consciousness among global population has led to growth in self-prescription behavior that has steered a proliferated demand for over-the-counter drugs and dietary supplements, owing to which trade activities of these pharmaceutical products are on the rise more than ever. This rise in demand is causing a considerable growth in demand for corrugated pharmaceutical packaging as a domino effect.

Easily Customizable Sizes Makes Corrugated Pharmaceutical Packaging Preferable

Customizable size of the packaging to small, medium, and large is one of the features of corrugated pharmaceutical packaging that has increased its demand across the global market. Rising demand for generics, and dietary supplements across the online retail platform in developed as well as emerging economies, the growth rate is further complemented. Based on the type of corrugated pharmaceutical packaging, rigid boxes are anticipated to hold a large market share in the forecast period.

Eco-friendly packaging solution has been the aim for the government of many countries across the globe. This aim combined with the initiatives with CPA (The Corrugated Packaging Alliance) aims to achieve and promote eco-friendly packaging solutions for pharmaceuticals for further growth of the market.

End users in the pharmaceutical industry also prefer corrugated pharmaceutical packaging as many researchers state that this packaging considerably reduces the growth of microbes and hence reduces risk related to contamination, maintaining the safety of the drug.

North America and Europe Corrugated Pharmaceutical Packaging Market Outlook

North America and Europe together secure a dominating share in the global corrugated pharmaceutical packaging market. As government bodies in the region strengthen the healthcare facilities, insurance, and infrastructure, it will further expand the demand for corrugated pharmaceutical packaging.

As pharmaceutical products need highly customized packaging solutions that are bounded by stringent regulations, corrugated pharmaceutical packaging has many lucrative opportunities that will enhance its demand in the global market. Owing to this reason, manufacturers are closely working with the R&D team to maintain hygiene, safety, and other precautionary compliance.

Asia Pacific Corrugated Pharmaceutical Packaging Market Outlook

India is one of the largest exporters of generic pharmaceuticals in the global market and this is one of the largest consumers of corrugated pharmaceutical packaging. The country has a large number of manufacturers of corrugated pharmaceutical packaging located nearby the important ports across the western and eastern coast for maximum penetration and lucrative opportunities owing to the location.

Manufacturers in the region are striving to establish a partnership with prime exporting pharmaceutical manufacturers to provide customized corrugated pharmaceutical packaging.

Who are the Key Manufacturers and Suppliers of Corrugated Pharmaceutical Packaging?

The global corrugated pharmaceutical packaging market is fragmented and highly competitive with numerous players. Players are adopting several strategies that would help them to enhance market presence and penetration like product development, investments, acquisitions, and agreements with key pioneers in the local market.

The report is a compilation of first-hand information, qualitative and quantitative assessment by industry analysts, inputs from industry experts and industry participants across the value chain. The report provides in-depth analysis of parent market trends, macro-economic indicators and governing factors along with market attractiveness as per segments. The report also maps the qualitative impact of various market factors on market segments and geographies.

Key Companies

  • Europac Group
  • Archis Packaging Pvt. Ltd
  • Mondi Group
  • International Paper
  • Smurfit Kappa Group
  • DS Smith
  • WestRock
  • Orora Packaging Australia Pty Ltd
  • Georgia‑Pacific LLC
  • Packaging Corporation of America

Key Segments

By Type:

  • Rigid Boxes
  • Self-Erecting Boxes
  • Telescope Boxes
  • Slotted Boxes
  • Others

By Wall Construction:

  • Single-Wall
  • Double-Wall
  • Triple-Wall

By Material:

  • Linerboard
  • Medium
  • Others

By End Use:

  • Pharma Manufacturing
  • Contract Packaging
  • Retail Pharmacy
  • Institutional Pharmacy

By Region:

  • North America
  • Europe
  • Asia-Pacific
  • Latin America
  • Middle East & Africa

Table of Content

  1. Executive Summary
    • Global Market Outlook
    • Demand-side Trends
    • Supply-side Trends
    • Technology Roadmap Analysis
    • Analysis and Recommendations
  2. Market Overview
    • Market Coverage / Taxonomy
    • Market Definition / Scope / Limitations
  3. Market Background
    • Market Dynamics
      • Drivers
      • Restraints
      • Opportunity
      • Trends
    • Scenario Forecast
      • Demand in Optimistic Scenario
      • Demand in Likely Scenario
      • Demand in Conservative Scenario
    • Opportunity Map Analysis
    • Product Life Cycle Analysis
    • Supply Chain Analysis
      • Supply Side Participants and their Roles
        • Producers
        • Mid-Level Participants (Traders/ Agents/ Brokers)
        • Wholesalers and Distributors
      • Value Added and Value Created at Node in the Supply Chain
      • List of Raw Material Suppliers
      • List of Existing and Potential Buyer’s
    • Investment Feasibility Matrix
    • Value Chain Analysis
      • Profit Margin Analysis
      • Wholesalers and Distributors
      • Retailers
    • PESTLE and Porter’s Analysis
    • Regulatory Landscape
      • By Key Regions
      • By Key Countries
    • Regional Parent Market Outlook
    • Production and Consumption Statistics
    • Import and Export Statistics
  4. Global Market Analysis 2020 to 2024 and Forecast, 2025 to 2035
    • Historical Market Size Value (USD Billion) & Volume (Units) Analysis, 2020 to 2024
    • Current and Future Market Size Value (USD Billion) & Volume (Units) Projections, 2025 to 2035
      • Y-o-Y Growth Trend Analysis
      • Absolute $ Opportunity Analysis
  5. Global Market Pricing Analysis 2020 to 2024 and Forecast 2025 to 2035
  6. Global Market Analysis 2020 to 2024 and Forecast 2025 to 2035, By Type
    • Introduction / Key Findings
    • Historical Market Size Value (USD Billion) & Volume (Units) Analysis By Type, 2020 to 2024
    • Current and Future Market Size Value (USD Billion) & Volume (Units) Analysis and Forecast By Type, 2025 to 2035
      • Rigid Boxes
      • Self-Erecting Boxes
      • Telescope Boxes
      • Slotted Boxes
      • Others
    • Y-o-Y Growth Trend Analysis By Type, 2020 to 2024
    • Absolute $ Opportunity Analysis By Type, 2025 to 2035
  7. Global Market Analysis 2020 to 2024 and Forecast 2025 to 2035, By Wall Construction
    • Introduction / Key Findings
    • Historical Market Size Value (USD Billion) & Volume (Units) Analysis By Wall Construction, 2020 to 2024
    • Current and Future Market Size Value (USD Billion) & Volume (Units) Analysis and Forecast By Wall Construction, 2025 to 2035
      • Single-Wall
      • Double-Wall
      • Triple-Wall
    • Y-o-Y Growth Trend Analysis By Wall Construction, 2020 to 2024
    • Absolute $ Opportunity Analysis By Wall Construction, 2025 to 2035
  8. Global Market Analysis 2020 to 2024 and Forecast 2025 to 2035, By Material
    • Introduction / Key Findings
    • Historical Market Size Value (USD Billion) & Volume (Units) Analysis By Material, 2020 to 2024
    • Current and Future Market Size Value (USD Billion) & Volume (Units) Analysis and Forecast By Material, 2025 to 2035
      • Linerboard
      • Medium
      • Others
    • Y-o-Y Growth Trend Analysis By Material, 2020 to 2024
    • Absolute $ Opportunity Analysis By Material, 2025 to 2035
  9. Global Market Analysis 2020 to 2024 and Forecast 2025 to 2035, By End Use
    • Introduction / Key Findings
    • Historical Market Size Value (USD Billion) & Volume (Units) Analysis By End Use, 2020 to 2024
    • Current and Future Market Size Value (USD Billion) & Volume (Units) Analysis and Forecast By End Use, 2025 to 2035
      • Pharma Manufacturing
      • Contract Packaging
      • Retail Pharmacy
      • Institutional Pharmacy
    • Y-o-Y Growth Trend Analysis By End Use, 2020 to 2024
    • Absolute $ Opportunity Analysis By End Use, 2025 to 2035
  10. Global Market Analysis 2020 to 2024 and Forecast 2025 to 2035, By Region
    • Introduction
    • Historical Market Size Value (USD Billion) & Volume (Units) Analysis By Region, 2020 to 2024
    • Current Market Size Value (USD Billion) & Volume (Units) Analysis and Forecast By Region, 2025 to 2035
      • North America
      • Latin America
      • Europe
      • East Asia
      • South Asia
      • Oceania
      • MEA
    • Market Attractiveness Analysis By Region
  11. North America Market Analysis 2020 to 2024 and Forecast 2025 to 2035, By Country
    • Historical Market Size Value (USD Billion) & Volume (Units) Trend Analysis By Market Taxonomy, 2020 to 2024
    • Market Size Value (USD Billion) & Volume (Units) Forecast By Market Taxonomy, 2025 to 2035
      • By Country
        • USA
        • Canada
      • By Type
      • By Wall Construction
      • By Material
      • By End Use
    • Market Attractiveness Analysis
      • By Country
      • By Type
      • By Wall Construction
      • By Material
      • By End Use
    • Key Takeaways
  12. Latin America Market Analysis 2020 to 2024 and Forecast 2025 to 2035, By Country
    • Historical Market Size Value (USD Billion) & Volume (Units) Trend Analysis By Market Taxonomy, 2020 to 2024
    • Market Size Value (USD Billion) & Volume (Units) Forecast By Market Taxonomy, 2025 to 2035
      • By Country
        • Brazil
        • Mexico
        • Argentina
        • Chile
        • Peru
        • Rest of Latin America
      • By Type
      • By Wall Construction
      • By Material
      • By End Use
    • Market Attractiveness Analysis
      • By Country
      • By Type
      • By Wall Construction
      • By Material
      • By End Use
    • Key Takeaways
  13. Europe Market Analysis 2020 to 2024 and Forecast 2025 to 2035, By Country
    • Historical Market Size Value (USD Billion) & Volume (Units) Trend Analysis By Market Taxonomy, 2020 to 2024
    • Market Size Value (USD Billion) & Volume (Units) Forecast By Market Taxonomy, 2025 to 2035
      • By Country
        • Germany
        • Italy
        • France
        • UK
        • Spain
        • Russia
        • BENELUX
        • Rest of Europe
      • By Type
      • By Wall Construction
      • By Material
      • By End Use
    • Market Attractiveness Analysis
      • By Country
      • By Type
      • By Wall Construction
      • By Material
      • By End Use
    • Key Takeaways
  14. East Asia Market Analysis 2020 to 2024 and Forecast 2025 to 2035, By Country
    • Historical Market Size Value (USD Billion) & Volume (Units) Trend Analysis By Market Taxonomy, 2020 to 2024
    • Market Size Value (USD Billion) & Volume (Units) Forecast By Market Taxonomy, 2025 to 2035
      • By Country
        • China
        • Japan
        • South Korea
      • By Type
      • By Wall Construction
      • By Material
      • By End Use
    • Market Attractiveness Analysis
      • By Country
      • By Type
      • By Wall Construction
      • By Material
      • By End Use
    • Key Takeaways
  15. South Asia Market Analysis 2020 to 2024 and Forecast 2025 to 2035, By Country
    • Historical Market Size Value (USD Billion) & Volume (Units) Trend Analysis By Market Taxonomy, 2020 to 2024
    • Market Size Value (USD Billion) & Volume (Units) Forecast By Market Taxonomy, 2025 to 2035
      • By Country
        • India
        • Thailand
        • Malaysia
        • Indonesia
        • Rest of South Asia
      • By Type
      • By Wall Construction
      • By Material
      • By End Use
    • Market Attractiveness Analysis
      • By Country
      • By Type
      • By Wall Construction
      • By Material
      • By End Use
    • Key Takeaways
  16. Oceania Market Analysis 2020 to 2024 and Forecast 2025 to 2035, By Country
    • Historical Market Size Value (USD Billion) & Volume (Units) Trend Analysis By Market Taxonomy, 2020 to 2024
    • Market Size Value (USD Billion) & Volume (Units) Forecast By Market Taxonomy, 2025 to 2035
      • By Country
        • Australia
        • New Zealand
      • By Type
      • By Wall Construction
      • By Material
      • By End Use
    • Market Attractiveness Analysis
      • By Country
      • By Type
      • By Wall Construction
      • By Material
      • By End Use
    • Key Takeaways
  17. MEA Market Analysis 2020 to 2024 and Forecast 2025 to 2035, By Country
    • Historical Market Size Value (USD Billion) & Volume (Units) Trend Analysis By Market Taxonomy, 2020 to 2024
    • Market Size Value (USD Billion) & Volume (Units) Forecast By Market Taxonomy, 2025 to 2035
      • By Country
        • GCC
        • Rest of MEA
      • By Type
      • By Wall Construction
      • By Material
      • By End Use
    • Market Attractiveness Analysis
      • By Country
      • By Type
      • By Wall Construction
      • By Material
      • By End Use
    • Key Takeaways
  18. Key Countries Market Analysis
    • USA
      • Pricing Analysis
      • Market Share Analysis, 2024
        • By Type
        • By Wall Construction
        • By Material
        • By End Use
    • Canada
      • Pricing Analysis
      • Market Share Analysis, 2024
        • By Type
        • By Wall Construction
        • By Material
        • By End Use
    • Brazil
      • Pricing Analysis
      • Market Share Analysis, 2024
        • By Type
        • By Wall Construction
        • By Material
        • By End Use
    • Mexico
      • Pricing Analysis
      • Market Share Analysis, 2024
        • By Type
        • By Wall Construction
        • By Material
        • By End Use
    • Argentina
      • Pricing Analysis
      • Market Share Analysis, 2024
        • By Type
        • By Wall Construction
        • By Material
        • By End Use
  19. Market Structure Analysis
    • Competition Dashboard
    • Competition Benchmarking
    • Market Share Analysis of Top Players
      • By Regional
      • By Type
      • By Wall Construction
      • By Material
      • By End Use
  20. Competition Analysis
    • Competition Deep Dive
      • Europac Group
        • Overview
        • Product Portfolio
        • Profitability by Market Segments (Product/Age /Sales Channel/Region)
        • Sales Footprint
        • Strategy Overview
          • Marketing Strategy
          • Product Strategy
          • Channel Strategy
      • Archis Packaging Pvt. Ltd
        • Overview
        • Product Portfolio
        • Profitability by Market Segments (Product/Age /Sales Channel/Region)
        • Sales Footprint
        • Strategy Overview
          • Marketing Strategy
          • Product Strategy
          • Channel Strategy
      • Mondi Group
        • Overview
        • Product Portfolio
        • Profitability by Market Segments (Product/Age /Sales Channel/Region)
        • Sales Footprint
        • Strategy Overview
          • Marketing Strategy
          • Product Strategy
          • Channel Strategy
      • International Paper
        • Overview
        • Product Portfolio
        • Profitability by Market Segments (Product/Age /Sales Channel/Region)
        • Sales Footprint
        • Strategy Overview
          • Marketing Strategy
          • Product Strategy
          • Channel Strategy
      • Smurfit Kappa Group
        • Overview
        • Product Portfolio
        • Profitability by Market Segments (Product/Age /Sales Channel/Region)
        • Sales Footprint
        • Strategy Overview
          • Marketing Strategy
          • Product Strategy
          • Channel Strategy
      • DS Smith
        • Overview
        • Product Portfolio
        • Profitability by Market Segments (Product/Age /Sales Channel/Region)
        • Sales Footprint
        • Strategy Overview
          • Marketing Strategy
          • Product Strategy
          • Channel Strategy
      • WestRock
        • Overview
        • Product Portfolio
        • Profitability by Market Segments (Product/Age /Sales Channel/Region)
        • Sales Footprint
        • Strategy Overview
          • Marketing Strategy
          • Product Strategy
          • Channel Strategy
      • Orora Packaging Australia Pty Ltd
        • Overview
        • Product Portfolio
        • Profitability by Market Segments (Product/Age /Sales Channel/Region)
        • Sales Footprint
        • Strategy Overview
          • Marketing Strategy
          • Product Strategy
          • Channel Strategy
      • Georgia‑Pacific LLC
        • Overview
        • Product Portfolio
        • Profitability by Market Segments (Product/Age /Sales Channel/Region)
        • Sales Footprint
        • Strategy Overview
          • Marketing Strategy
          • Product Strategy
          • Channel Strategy
      • Packaging Corporation of America
        • Overview
        • Product Portfolio
        • Profitability by Market Segments (Product/Age /Sales Channel/Region)
        • Sales Footprint
        • Strategy Overview
          • Marketing Strategy
          • Product Strategy
          • Channel Strategy
  21. Assumptions & Acronyms Used
  22. Research Methodology

List of Tables

  • Table 1: Global Market Value (USD Billion) Forecast by Region, 2020-2035
  • Table 2: Global Market Volume (Units) Forecast by Region, 2020-2035
  • Table 3: Global Market Value (USD Billion) Forecast by Type, 2020-2035
  • Table 4: Global Market Volume (Units) Forecast by Type, 2020-2035
  • Table 5: Global Market Value (USD Billion) Forecast by Wall Construction, 2020-2035
  • Table 6: Global Market Volume (Units) Forecast by Wall Construction, 2020-2035
  • Table 7: Global Market Value (USD Billion) Forecast by Material, 2020-2035
  • Table 8: Global Market Volume (Units) Forecast by Material, 2020-2035
  • Table 9: Global Market Value (USD Billion) Forecast by End Use, 2020-2035
  • Table 10: Global Market Volume (Units) Forecast by End Use, 2020-2035
  • Table 11: North America Market Value (USD Billion) Forecast by Country, 2020-2035
  • Table 12: North America Market Volume (Units) Forecast by Country, 2020-2035
  • Table 13: North America Market Value (USD Billion) Forecast by Type, 2020-2035
  • Table 14: North America Market Volume (Units) Forecast by Type, 2020-2035
  • Table 15: North America Market Value (USD Billion) Forecast by Wall Construction, 2020-2035
  • Table 16: North America Market Volume (Units) Forecast by Wall Construction, 2020-2035
  • Table 17: North America Market Value (USD Billion) Forecast by Material, 2020-2035
  • Table 18: North America Market Volume (Units) Forecast by Material, 2020-2035
  • Table 19: North America Market Value (USD Billion) Forecast by End Use, 2020-2035
  • Table 20: North America Market Volume (Units) Forecast by End Use, 2020-2035
  • Table 21: Latin America Market Value (USD Billion) Forecast by Country, 2020-2035
  • Table 22: Latin America Market Volume (Units) Forecast by Country, 2020-2035
  • Table 23: Latin America Market Value (USD Billion) Forecast by Type, 2020-2035
  • Table 24: Latin America Market Volume (Units) Forecast by Type, 2020-2035
  • Table 25: Latin America Market Value (USD Billion) Forecast by Wall Construction, 2020-2035
  • Table 26: Latin America Market Volume (Units) Forecast by Wall Construction, 2020-2035
  • Table 27: Latin America Market Value (USD Billion) Forecast by Material, 2020-2035
  • Table 28: Latin America Market Volume (Units) Forecast by Material, 2020-2035
  • Table 29: Latin America Market Value (USD Billion) Forecast by End Use, 2020-2035
  • Table 30: Latin America Market Volume (Units) Forecast by End Use, 2020-2035
  • Table 31: Europe Market Value (USD Billion) Forecast by Country, 2020-2035
  • Table 32: Europe Market Volume (Units) Forecast by Country, 2020-2035
  • Table 33: Europe Market Value (USD Billion) Forecast by Type, 2020-2035
  • Table 34: Europe Market Volume (Units) Forecast by Type, 2020-2035
  • Table 35: Europe Market Value (USD Billion) Forecast by Wall Construction, 2020-2035
  • Table 36: Europe Market Volume (Units) Forecast by Wall Construction, 2020-2035
  • Table 37: Europe Market Value (USD Billion) Forecast by Material, 2020-2035
  • Table 38: Europe Market Volume (Units) Forecast by Material, 2020-2035
  • Table 39: Europe Market Value (USD Billion) Forecast by End Use, 2020-2035
  • Table 40: Europe Market Volume (Units) Forecast by End Use, 2020-2035
  • Table 41: East Asia Market Value (USD Billion) Forecast by Country, 2020-2035
  • Table 42: East Asia Market Volume (Units) Forecast by Country, 2020-2035
  • Table 43: East Asia Market Value (USD Billion) Forecast by Type, 2020-2035
  • Table 44: East Asia Market Volume (Units) Forecast by Type, 2020-2035
  • Table 45: East Asia Market Value (USD Billion) Forecast by Wall Construction, 2020-2035
  • Table 46: East Asia Market Volume (Units) Forecast by Wall Construction, 2020-2035
  • Table 47: East Asia Market Value (USD Billion) Forecast by Material, 2020-2035
  • Table 48: East Asia Market Volume (Units) Forecast by Material, 2020-2035
  • Table 49: East Asia Market Value (USD Billion) Forecast by End Use, 2020-2035
  • Table 50: East Asia Market Volume (Units) Forecast by End Use, 2020-2035
  • Table 51: South Asia Market Value (USD Billion) Forecast by Country, 2020-2035
  • Table 52: South Asia Market Volume (Units) Forecast by Country, 2020-2035
  • Table 53: South Asia Market Value (USD Billion) Forecast by Type, 2020-2035
  • Table 54: South Asia Market Volume (Units) Forecast by Type, 2020-2035
  • Table 55: South Asia Market Value (USD Billion) Forecast by Wall Construction, 2020-2035
  • Table 56: South Asia Market Volume (Units) Forecast by Wall Construction, 2020-2035
  • Table 57: South Asia Market Value (USD Billion) Forecast by Material, 2020-2035
  • Table 58: South Asia Market Volume (Units) Forecast by Material, 2020-2035
  • Table 59: South Asia Market Value (USD Billion) Forecast by End Use, 2020-2035
  • Table 60: South Asia Market Volume (Units) Forecast by End Use, 2020-2035
  • Table 61: Oceania Market Value (USD Billion) Forecast by Country, 2020-2035
  • Table 62: Oceania Market Volume (Units) Forecast by Country, 2020-2035
  • Table 63: Oceania Market Value (USD Billion) Forecast by Type, 2020-2035
  • Table 64: Oceania Market Volume (Units) Forecast by Type, 2020-2035
  • Table 65: Oceania Market Value (USD Billion) Forecast by Wall Construction, 2020-2035
  • Table 66: Oceania Market Volume (Units) Forecast by Wall Construction, 2020-2035
  • Table 67: Oceania Market Value (USD Billion) Forecast by Material, 2020-2035
  • Table 68: Oceania Market Volume (Units) Forecast by Material, 2020-2035
  • Table 69: Oceania Market Value (USD Billion) Forecast by End Use, 2020-2035
  • Table 70: Oceania Market Volume (Units) Forecast by End Use, 2020-2035
  • Table 71: MEA Market Value (USD Billion) Forecast by Country, 2020-2035
  • Table 72: MEA Market Volume (Units) Forecast by Country, 2020-2035
  • Table 73: MEA Market Value (USD Billion) Forecast by Type, 2020-2035
  • Table 74: MEA Market Volume (Units) Forecast by Type, 2020-2035
  • Table 75: MEA Market Value (USD Billion) Forecast by Wall Construction, 2020-2035
  • Table 76: MEA Market Volume (Units) Forecast by Wall Construction, 2020-2035
  • Table 77: MEA Market Value (USD Billion) Forecast by Material, 2020-2035
  • Table 78: MEA Market Volume (Units) Forecast by Material, 2020-2035
  • Table 79: MEA Market Value (USD Billion) Forecast by End Use, 2020-2035
  • Table 80: MEA Market Volume (Units) Forecast by End Use, 2020-2035

List of Figures

  • Figure 1: Global Market Volume (Units) Forecast 2020-2035
  • Figure 2: Global Market Pricing Analysis
  • Figure 3: Global Market Value (USD Billion) Forecast 2020-2035
  • Figure 4: Global Market Value Share and BPS Analysis by Type, 2025 and 2035
  • Figure 5: Global Market Y-o-Y Growth Comparison by Type, 2025-2035
  • Figure 6: Global Market Attractiveness Analysis by Type
  • Figure 7: Global Market Value Share and BPS Analysis by Wall Construction, 2025 and 2035
  • Figure 8: Global Market Y-o-Y Growth Comparison by Wall Construction, 2025-2035
  • Figure 9: Global Market Attractiveness Analysis by Wall Construction
  • Figure 10: Global Market Value Share and BPS Analysis by Material, 2025 and 2035
  • Figure 11: Global Market Y-o-Y Growth Comparison by Material, 2025-2035
  • Figure 12: Global Market Attractiveness Analysis by Material
  • Figure 13: Global Market Value Share and BPS Analysis by End Use, 2025 and 2035
  • Figure 14: Global Market Y-o-Y Growth Comparison by End Use, 2025-2035
  • Figure 15: Global Market Attractiveness Analysis by End Use
  • Figure 16: Global Market Value (USD Billion) Share and BPS Analysis by Region, 2025 and 2035
  • Figure 17: Global Market Y-o-Y Growth Comparison by Region, 2025-2035
  • Figure 18: Global Market Attractiveness Analysis by Region
  • Figure 19: North America Market Incremental $ Opportunity, 2025-2035
  • Figure 20: Latin America Market Incremental $ Opportunity, 2025-2035
  • Figure 21: Europe Market Incremental $ Opportunity, 2025-2035
  • Figure 22: East Asia Market Incremental $ Opportunity, 2025-2035
  • Figure 23: South Asia Market Incremental $ Opportunity, 2025-2035
  • Figure 24: Oceania Market Incremental $ Opportunity, 2025-2035
  • Figure 25: MEA Market Incremental $ Opportunity, 2025-2035
  • Figure 26: North America Market Value Share and BPS Analysis by Country, 2025 and 2035
  • Figure 27: North America Market Value Share and BPS Analysis by Type, 2025 and 2035
  • Figure 28: North America Market Y-o-Y Growth Comparison by Type, 2025-2035
  • Figure 29: North America Market Attractiveness Analysis by Type
  • Figure 30: North America Market Value Share and BPS Analysis by Wall Construction, 2025 and 2035
  • Figure 31: North America Market Y-o-Y Growth Comparison by Wall Construction, 2025-2035
  • Figure 32: North America Market Attractiveness Analysis by Wall Construction
  • Figure 33: North America Market Value Share and BPS Analysis by Material, 2025 and 2035
  • Figure 34: North America Market Y-o-Y Growth Comparison by Material, 2025-2035
  • Figure 35: North America Market Attractiveness Analysis by Material
  • Figure 36: North America Market Value Share and BPS Analysis by End Use, 2025 and 2035
  • Figure 37: North America Market Y-o-Y Growth Comparison by End Use, 2025-2035
  • Figure 38: North America Market Attractiveness Analysis by End Use
  • Figure 39: Latin America Market Value Share and BPS Analysis by Country, 2025 and 2035
  • Figure 40: Latin America Market Value Share and BPS Analysis by Type, 2025 and 2035
  • Figure 41: Latin America Market Y-o-Y Growth Comparison by Type, 2025-2035
  • Figure 42: Latin America Market Attractiveness Analysis by Type
  • Figure 43: Latin America Market Value Share and BPS Analysis by Wall Construction, 2025 and 2035
  • Figure 44: Latin America Market Y-o-Y Growth Comparison by Wall Construction, 2025-2035
  • Figure 45: Latin America Market Attractiveness Analysis by Wall Construction
  • Figure 46: Latin America Market Value Share and BPS Analysis by Material, 2025 and 2035
  • Figure 47: Latin America Market Y-o-Y Growth Comparison by Material, 2025-2035
  • Figure 48: Latin America Market Attractiveness Analysis by Material
  • Figure 49: Latin America Market Value Share and BPS Analysis by End Use, 2025 and 2035
  • Figure 50: Latin America Market Y-o-Y Growth Comparison by End Use, 2025-2035
  • Figure 51: Latin America Market Attractiveness Analysis by End Use
  • Figure 52: Europe Market Value Share and BPS Analysis by Country, 2025 and 2035
  • Figure 53: Europe Market Value Share and BPS Analysis by Type, 2025 and 2035
  • Figure 54: Europe Market Y-o-Y Growth Comparison by Type, 2025-2035
  • Figure 55: Europe Market Attractiveness Analysis by Type
  • Figure 56: Europe Market Value Share and BPS Analysis by Wall Construction, 2025 and 2035
  • Figure 57: Europe Market Y-o-Y Growth Comparison by Wall Construction, 2025-2035
  • Figure 58: Europe Market Attractiveness Analysis by Wall Construction
  • Figure 59: Europe Market Value Share and BPS Analysis by Material, 2025 and 2035
  • Figure 60: Europe Market Y-o-Y Growth Comparison by Material, 2025-2035
  • Figure 61: Europe Market Attractiveness Analysis by Material
  • Figure 62: Europe Market Value Share and BPS Analysis by End Use, 2025 and 2035
  • Figure 63: Europe Market Y-o-Y Growth Comparison by End Use, 2025-2035
  • Figure 64: Europe Market Attractiveness Analysis by End Use
  • Figure 65: East Asia Market Value Share and BPS Analysis by Country, 2025 and 2035
  • Figure 66: East Asia Market Value Share and BPS Analysis by Type, 2025 and 2035
  • Figure 67: East Asia Market Y-o-Y Growth Comparison by Type, 2025-2035
  • Figure 68: East Asia Market Attractiveness Analysis by Type
  • Figure 69: East Asia Market Value Share and BPS Analysis by Wall Construction, 2025 and 2035
  • Figure 70: East Asia Market Y-o-Y Growth Comparison by Wall Construction, 2025-2035
  • Figure 71: East Asia Market Attractiveness Analysis by Wall Construction
  • Figure 72: East Asia Market Value Share and BPS Analysis by Material, 2025 and 2035
  • Figure 73: East Asia Market Y-o-Y Growth Comparison by Material, 2025-2035
  • Figure 74: East Asia Market Attractiveness Analysis by Material
  • Figure 75: East Asia Market Value Share and BPS Analysis by End Use, 2025 and 2035
  • Figure 76: East Asia Market Y-o-Y Growth Comparison by End Use, 2025-2035
  • Figure 77: East Asia Market Attractiveness Analysis by End Use
  • Figure 78: South Asia Market Value Share and BPS Analysis by Country, 2025 and 2035
  • Figure 79: South Asia Market Value Share and BPS Analysis by Type, 2025 and 2035
  • Figure 80: South Asia Market Y-o-Y Growth Comparison by Type, 2025-2035
  • Figure 81: South Asia Market Attractiveness Analysis by Type
  • Figure 82: South Asia Market Value Share and BPS Analysis by Wall Construction, 2025 and 2035
  • Figure 83: South Asia Market Y-o-Y Growth Comparison by Wall Construction, 2025-2035
  • Figure 84: South Asia Market Attractiveness Analysis by Wall Construction
  • Figure 85: South Asia Market Value Share and BPS Analysis by Material, 2025 and 2035
  • Figure 86: South Asia Market Y-o-Y Growth Comparison by Material, 2025-2035
  • Figure 87: South Asia Market Attractiveness Analysis by Material
  • Figure 88: South Asia Market Value Share and BPS Analysis by End Use, 2025 and 2035
  • Figure 89: South Asia Market Y-o-Y Growth Comparison by End Use, 2025-2035
  • Figure 90: South Asia Market Attractiveness Analysis by End Use
  • Figure 91: Oceania Market Value Share and BPS Analysis by Country, 2025 and 2035
  • Figure 92: Oceania Market Value Share and BPS Analysis by Type, 2025 and 2035
  • Figure 93: Oceania Market Y-o-Y Growth Comparison by Type, 2025-2035
  • Figure 94: Oceania Market Attractiveness Analysis by Type
  • Figure 95: Oceania Market Value Share and BPS Analysis by Wall Construction, 2025 and 2035
  • Figure 96: Oceania Market Y-o-Y Growth Comparison by Wall Construction, 2025-2035
  • Figure 97: Oceania Market Attractiveness Analysis by Wall Construction
  • Figure 98: Oceania Market Value Share and BPS Analysis by Material, 2025 and 2035
  • Figure 99: Oceania Market Y-o-Y Growth Comparison by Material, 2025-2035
  • Figure 100: Oceania Market Attractiveness Analysis by Material
  • Figure 101: Oceania Market Value Share and BPS Analysis by End Use, 2025 and 2035
  • Figure 102: Oceania Market Y-o-Y Growth Comparison by End Use, 2025-2035
  • Figure 103: Oceania Market Attractiveness Analysis by End Use
  • Figure 104: MEA Market Value Share and BPS Analysis by Country, 2025 and 2035
  • Figure 105: MEA Market Value Share and BPS Analysis by Type, 2025 and 2035
  • Figure 106: MEA Market Y-o-Y Growth Comparison by Type, 2025-2035
  • Figure 107: MEA Market Attractiveness Analysis by Type
  • Figure 108: MEA Market Value Share and BPS Analysis by Wall Construction, 2025 and 2035
  • Figure 109: MEA Market Y-o-Y Growth Comparison by Wall Construction, 2025-2035
  • Figure 110: MEA Market Attractiveness Analysis by Wall Construction
  • Figure 111: MEA Market Value Share and BPS Analysis by Material, 2025 and 2035
  • Figure 112: MEA Market Y-o-Y Growth Comparison by Material, 2025-2035
  • Figure 113: MEA Market Attractiveness Analysis by Material
  • Figure 114: MEA Market Value Share and BPS Analysis by End Use, 2025 and 2035
  • Figure 115: MEA Market Y-o-Y Growth Comparison by End Use, 2025-2035
  • Figure 116: MEA Market Attractiveness Analysis by End Use
  • Figure 117: Global Market - Tier Structure Analysis
  • Figure 118: Global Market - Company Share Analysis

Explore Similar Insights

Future Market Insights

Corrugated Pharmaceutical Packaging Market