Corrugated Open-Head Drums Market Size and Share Forecast Outlook 2025 to 2035

The corrugated open-head drums market is projected to grow from USD 1.5 billion in 2025 to USD 3.1 billion by 2035, registering a CAGR of 7.5% during the forecast period. Sales in 2024 reached USD 1.2 billion, underscoring the sector's resilience and growing demand across chemicals, pharmaceuticals, food & beverage, and agriculture industries. This growth is attributed to the increasing need for lightweight, recyclable, and sustainable packaging solutions that ensure product integrity during storage and transportation.
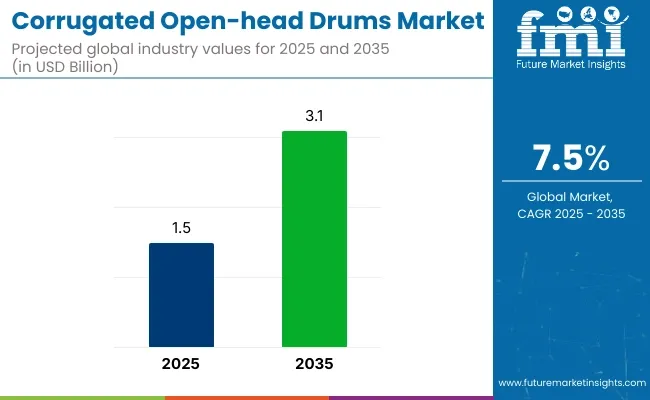
Corrugated Open Head Drums Market

Metric Value
Market Size in 2025 USD 1.5 billion
Projected Market Size in 2035 USD 3.1 billion
CAGR (2025 to 2035) 7.5%

In August 2024, Mauser Packaging Solutions, a global industrial packaging producer and provider of solutions and services for the entire life cycle of packaging, has acquired a business of manufacturing, selling and supplying plastic drums including large rigid plastics drums in Pinetown, Kwa-Zulu Natal, South Africa.

The business was initially owned by Nampak Products Ltd and sold to Eliptotime PTY Ltd, who has in turn on-sold the business to Mauser. “This investment underscores our ongoing commitment to expanding our presence in this region and growing with our customers by delivering sustainable packaging solutions with unparalleled quality and customer service,” said Michael Steubing, President of Mauser’s International Packaging Business Unit.

The shift towards sustainable and eco-friendly packaging solutions is influencing the corrugated open-head drums market. Manufacturers are focusing on developing drums that are biodegradable, recyclable, and made from renewable resources. Innovations include the integration of moisture-resistant coatings, tamper-evident features, and the use of water-based inks for printing to reduce environmental impact. These advancements align with global sustainability goals and regulatory requirements, making corrugated open-head drums an attractive option for environmentally conscious industries.

The corrugated open-head drums market is poised for significant growth, driven by increasing demand in chemicals, pharmaceuticals, food & beverage, and agriculture industries. Companies investing in sustainable materials, innovative designs, and eco-friendly production processes are expected to gain a competitive edge. As global supply chains expand and environmental regulations become more stringent, the adoption of corrugated open-head drums is anticipated to rise, offering cost-effective and eco-friendly packaging solutions.

Analyzing Corrugated Open-head Drums Market by Top Investment Segments

25-50 Gallon Drums Expected to Dominate Due to Versatility and Handling Efficiency

The 25-50 gallon capacity range is expected to account for approximately 42.6% of the corrugated open-head drums market by 2025, as this segment is widely adopted for transporting medium-volume goods across industrial, pharmaceutical, and chemical sectors. This range has been favored for offering an optimal balance between storage efficiency and manual handling convenience, particularly in applications where bulk yet maneuverable packaging is required.

These drums are being utilized extensively for powders, granules, and semi-viscous materials that do not demand rigid metal containment but require moisture-resistant, structurally sound packaging. Greater compatibility with palletization systems and material-handling equipment has also contributed to the segment’s growing preference.
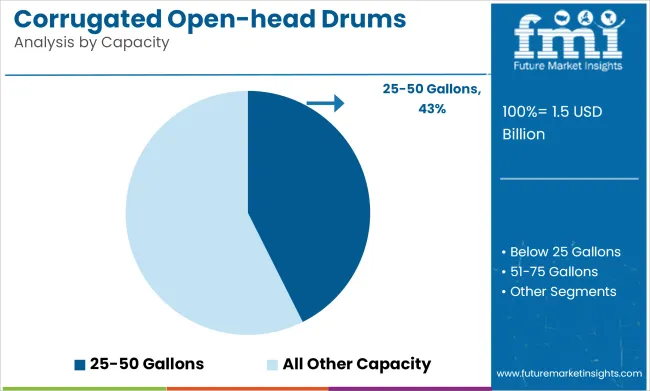
Corrugated Open Head Drums Market Analysis By Capacity

Compliance with hazardous and non-hazardous packaging regulations has been maintained through the use of internal liners and reinforced corrugated materials. Demand for sustainable and lightweight bulk packaging formats has further accelerated their adoption across global distribution networks.

As operational flexibility, reduced transportation weight, and ease of recycling continue to be prioritized, corrugated open-head drums in the 25-50 gallon range are anticipated to remain the most utilized across industries requiring moderate-capacity bulk storage and shipment solutions.

Metal Closure Drums to Lead Owing to Superior Security and Regulatory Compliance

Metal closure are projected to dominate the closure type segment of the corrugated open-head drums market, holding an estimated 45.3% market share by 2025, driven by the secure sealing performance and high durability they provide. Their adoption has been reinforced by regulatory requirements for tamper evidence and hazardous material containment, especially in chemical, pharmaceutical, and agro-industrial applications.

Drums with metal closures have been preferred for their ability to withstand external stress, resist corrosion (when treated), and ensure an airtight seal even in harsh transport conditions. Their strength and reliability under varying temperature and humidity levels have positioned them as the closure of choice for both export and domestic use.
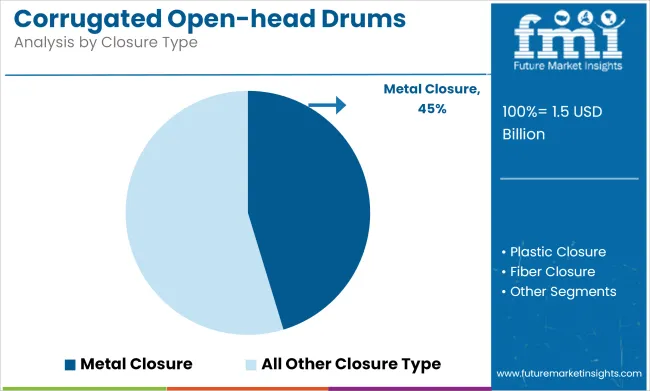
Corrugated Open Head Drums Market Analysis By Closure Type

Metal rings, lever-locks, or bolt closures have been engineered to support repeat opening and resealing while maintaining integrity, especially in reuse scenarios. Their compatibility with internal lining systems and anti-contamination safeguards has been viewed favorably by quality assurance teams and regulatory bodies. As global packaging standards move toward safety-focused and cost-efficient solutions, corrugated drums with metal closures are expected to continue being selected where containment integrity, robustness, and regulatory compliance are non-negotiable.

Challenges and Opportunities

Challenges

Limited Durability, Regulatory Compliance, and Competition from Metal and Plastic Drums

The corrugated open-head drums market also faces several challenges as it is not as durable as standard metal and plastic drums. Corrugated fiber drums are lightweight and economical, but they have limited moisture resistance, load-bearing needs and the storage of hazardous materials over a long period of time.

Also, transporting chemicals, pharmaceuticals, or food-grade products requires rigorous regulatory compliance and certifications with the USA DOT (Department of Transportation) for UN (United Nations) FDA (Food and Drug Administration), making manufacturing very difficult. A significant market drawback is competition from metal and plastic drums that are stronger, reusable, and better suited to extreme conditions, making them a preferred option for heavy industrial applications.

Opportunities

Growth in Sustainable Packaging, E-Commerce Logistics, and Lightweight Industrial Solutions

The global corrugated open-head drums market is mainly being propelled by demand from end-users, which is characterized by multiple trends. While sectors move to adopt biodegradable, recyclable, and low-carbon packaging, corrugated fiber drums are gaining favor in bulk food packaging, pharmaceutical deliveries, and lightweight logistics applications.

Also, revolutionized moisture-resistant coatings, reinforced fiber structures, and biodegradable linings, enhance the strength and protective functions of corrugated drums. The growth in e-commerce-driven industrial shipping and AI-driven supply chain automation will also further contribute to the adoption of lightweight fiber-based bulk packaging solutions.
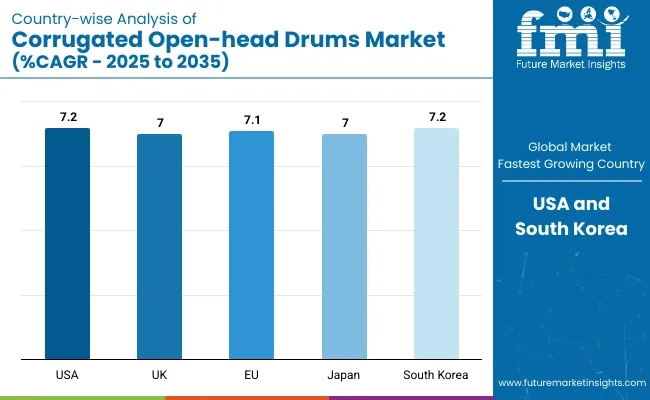
Country Wise Outlook

Country Wise Analysis Of Corrugated Open Head Drums Market

United States

Corrugated open-head drums market investigates and has incorporated the vital information that provides the overview of the industry. Increasing use of corrugated fiberboard drums in the chemical, pharmaceutical and food industries is propelling the market growth. Moreover, stringent guidelines on plastic/metal drum usage are prompting enterprises to shift towards eco-friendly options, thus further spurring market growth.

Country CAGR (2025 to 2035)
USA 7.2%

United Kingdom

Various drivers such as the increasing trend towards sustainable and economic packaging in various industries are driving the growth of corrugated open-head drums market in UK. Increased focus on recyclable and biodegradable packaging, along with stringent environmental regulations for hazardous waste disposal is expected to spur the market growth. Furthermore, the rising consumption of fiberboard drums for transporting dry and semi-liquid products is bolstering market growth.

Country CAGR (2025 to 2035)
UK 7.0%

European Union

The corrugated open-head drums market is growing in the European Union, driven by strict rules on packaging waste reduction and the rising use of fiber-based materials. Growing demand for durable, lightweight, and easy-to-handle packaging in food processing, chemicals, and pharmaceuticals sectors is likely to drive growth. Continuous advancements in moisture-resistant coatings and reinforced fiberboard drums offered in the market are enhancing product performance an influence expected to augment growth in the market.

Country CAGR (2025 to 2035)
European Union (EU) 7.1%

Japan

Japan’s corrugated open-head drums market is also expected to grow moderately due to growing preference for sustainable and efficient packaging solutions in the respective country. In industry sectors such as chemical, food, and electronics, the adoption of fiberboard drums is at the forefront, as manufacturers in search for a cost-efficient substitute for traditional metal and plastic drums. Emerging trends toward sustainable and high-strength fiberboard packaging are further driving market growth.

Country CAGR (2025 to 2035)
Japan 7.0%

South Korea

The corrugated open-head drums market in the South Korea region is also predicted to grow faster owing to increasing focus on green packaging solutions and industrial safety regulations. The increasing consumption for fiberboard drums in the pharmaceuticals and food industries, increasing number of protective coatings and drum use life are among the major factors propelling the market growth. Furthermore, government initiatives that support the use of sustainable material for packaging are contributing to the growth of the industry.

Country CAGR (2025 to 2035)
South Korea 7.2%

Competitive Outlook

The corrugated open-head drums market is experiencing growth due to the rising demand for lightweight, cost-effective, and environmentally friendly bulk packaging solutions. These drums are widely used in chemical, food & beverage, pharmaceutical, and hazardous waste management industries due to their high strength, easy handling, and sustainable composition.

Companies are focusing on AI-driven material optimization, advanced drum design, and recyclable drum production to enhance durability, cost-efficiency, and eco-friendly packaging solutions.
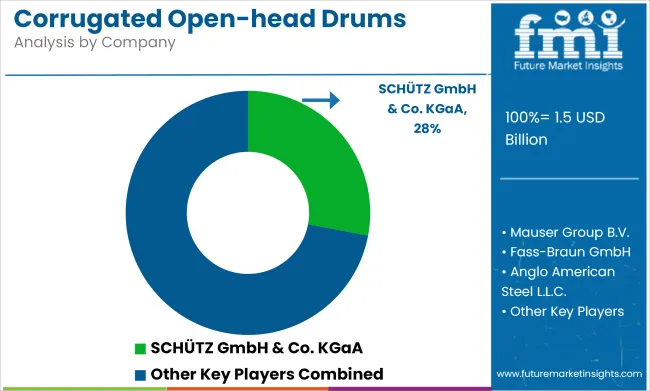
Key Market Insights

Corrugated Open Head Drums Market Analysis By Company

Greif Inc. (18-22%)

Greif leads the corrugated open-head drums market, offering fiber-based drum packaging solutions with AI-driven structural strength optimization and lightweight durability innovations.

Schutz Container Systems Inc. (12-16%)

Schutz specializes in recyclable corrugated drums, ensuring AI-enhanced drum performance, impact resistance, and compatibility with hazardous material storage.

Mauser Packaging Solutions (10-14%)

Mauser provides high-performance open-head fiberboard drums, optimizing AI-powered moisture resistance technology and cost-effective bulk transport solutions.

Sonoco Products Company (8-12%)

Sonoco focuses on fiber-based drum packaging, integrating AI-assisted compression strength analysis and sustainable material development.

Fibrestar Drums Ltd. (5-9%)

Fibrestar develops biodegradable fiber drums, ensuring AI-powered packaging resilience and environmentally friendly disposal options.

Other Key Players (30-40% Combined)

Several packaging material firms, industrial container manufacturers, and eco-friendly packaging solution providers contribute to next-generation open-head drum innovations, AI-powered structural reinforcement, and high-durability packaging solutions. These include:

  • Industrial Container Services (High-durability, recyclable corrugated drum solutions with AI-driven load optimization)
  • Enviro-Pak Inc. (Eco-friendly fiberboard drums with AI-assisted weight reduction and impact resistance improvements)
  • Mondi Group (Biodegradable corrugated drum packaging with AI-enhanced production efficiency)
  • DS Smith Plc (Lightweight fiber drum innovations with AI-powered structural integrity testing)
  • WestRock Company (Sustainable drum packaging solutions with AI-driven supply chain optimization)

Key Segments Profiled in the Global Corrugated Open-head Drums Market

By Capacity:

  • Below 25 Gallons
  • 25-50 Gallons
  • 51-75 Gallons
  • Above 75 Gallons

By Closure Type:

  • Metal Closure
  • Plastic Closure
  • Fiber Closure

By End Use:

  • Food & Beverage
  • Chemicals & Fertilizers
  • Agriculture
  • Building & Construction
  • Pharmaceuticals

By Region:

  • North America
  • Latin America
  • Western Europe
  • Eastern Europe
  • South Asia and Pacific
  • East Asia
  • The Middle East and Africa

Table of Content

  1. Executive Summary
  2. Industry Introduction, including Taxonomy and Market Definition
  3. Market Trends and Success Factors, including Macro-economic Factors, Market Dynamics, and Recent Industry Developments
  4. Global Market Demand Analysis 2020 to 2024 and Forecast 2025 to 2035, including Historical Analysis and Future Projections
  5. Pricing Analysis
  6. Global Market Analysis 2020 to 2024 and Forecast 2025 to 2035
    • By Capacity
    • By Closure Type
    • By End Use
  7. Global Market Analysis 2020 to 2024 and Forecast 2025 to 2035, By Capacity
    • Below 25 Gallons
    • 25-50 Gallons
    • 51-75 Gallons
    • Above 75 Gallons
  8. Global Market Analysis 2020 to 2024 and Forecast 2025 to 2035, By Closure Type
    • Metal Closure
    • Plastic Closure
    • Fiber Closure
  9. Global Market Analysis 2020 to 2024 and Forecast 2025 to 2035, By End Use
    • Food & Beverage
    • Chemicals & Fertilizers
    • Agriculture
    • Building & Construction
    • Pharmaceuticals
  10. Global Market Analysis 2020 to 2024 and Forecast 2025 to 2035, By Region
    • North America
    • Latin America
    • Western Europe
    • Eastern Europe
    • East Asia
    • South Asia Pacific
    • Middle East and Africa
  11. North America Sales Analysis 2020 to 2024 and Forecast 2025 to 2035, by Key Segments and Countries
  12. Latin America Sales Analysis 2020 to 2024 and Forecast 2025 to 2035, by Key Segments and Countries
  13. Western Europe Sales Analysis 2020 to 2024 and Forecast 2025 to 2035, by Key Segments and Countries
  14. Eastern Europe Sales Analysis 2020 to 2024 and Forecast 2025 to 2035, by Key Segments and Countries
  15. East Asia Sales Analysis 2020 to 2024 and Forecast 2025 to 2035, by Key Segments and Countries
  16. South Asia Pacific Sales Analysis 2020 to 2024 and Forecast 2025 to 2035, by Key Segments and Countries
  17. Middle East and Africa Sales Analysis 2020 to 2024 and Forecast 2025 to 2035, by Key Segments and Countries
  18. Sales Forecast 2025 to 2035 by Capacity, Closure Type, and End Use for 30 Countries
  19. Competition Outlook, including Market Structure Analysis, Company Share Analysis by Key Players, and Competition Dashboard
  20. Company Profile
    • SCHÜTZ GmbH & Co. KGaA
    • Greif, Inc
    • Mauser Group B.V.
    • Fass-Braun GmbH
    • Anglo American Steel L.L.C.
    • Al Fujairah Steel Barrels & Drums (LLC)
    • Pipeline Packaging
    • Rehway Steel Drum Co., Inc.
    • Skolnik Industries, Inc.
    • Enviro-Pak, Inc.

List of Tables

  • Table 1: Global Market Value (US$ Million) Forecast by Region, 2020 to 2035
  • Table 2: Global Market Volume (Units) Forecast by Region, 2020 to 2035
  • Table 3: Global Market Value (US$ Million) Forecast by Capacity, 2020 to 2035
  • Table 4: Global Market Volume (Units) Forecast by Capacity, 2020 to 2035
  • Table 5: Global Market Value (US$ Million) Forecast by Closure Type, 2020 to 2035
  • Table 6: Global Market Volume (Units) Forecast by Closure Type, 2020 to 2035
  • Table 7: Global Market Value (US$ Million) Forecast by End Use, 2020 to 2035
  • Table 8: Global Market Volume (Units) Forecast by End Use, 2020 to 2035
  • Table 9: North America Market Value (US$ Million) Forecast by Country, 2020 to 2035
  • Table 10: North America Market Volume (Units) Forecast by Country, 2020 to 2035
  • Table 11: North America Market Value (US$ Million) Forecast by Capacity, 2020 to 2035
  • Table 12: North America Market Volume (Units) Forecast by Capacity, 2020 to 2035
  • Table 13: North America Market Value (US$ Million) Forecast by Closure Type, 2020 to 2035
  • Table 14: North America Market Volume (Units) Forecast by Closure Type, 2020 to 2035
  • Table 15: North America Market Value (US$ Million) Forecast by End Use, 2020 to 2035
  • Table 16: North America Market Volume (Units) Forecast by End Use, 2020 to 2035
  • Table 17: Latin America Market Value (US$ Million) Forecast by Country, 2020 to 2035
  • Table 18: Latin America Market Volume (Units) Forecast by Country, 2020 to 2035
  • Table 19: Latin America Market Value (US$ Million) Forecast by Capacity, 2020 to 2035
  • Table 20: Latin America Market Volume (Units) Forecast by Capacity, 2020 to 2035
  • Table 21: Latin America Market Value (US$ Million) Forecast by Closure Type, 2020 to 2035
  • Table 22: Latin America Market Volume (Units) Forecast by Closure Type, 2020 to 2035
  • Table 23: Latin America Market Value (US$ Million) Forecast by End Use, 2020 to 2035
  • Table 24: Latin America Market Volume (Units) Forecast by End Use, 2020 to 2035
  • Table 25: Western Europe Market Value (US$ Million) Forecast by Country, 2020 to 2035
  • Table 26: Western Europe Market Volume (Units) Forecast by Country, 2020 to 2035
  • Table 27: Western Europe Market Value (US$ Million) Forecast by Capacity, 2020 to 2035
  • Table 28: Western Europe Market Volume (Units) Forecast by Capacity, 2020 to 2035
  • Table 29: Western Europe Market Value (US$ Million) Forecast by Closure Type, 2020 to 2035
  • Table 30: Western Europe Market Volume (Units) Forecast by Closure Type, 2020 to 2035
  • Table 31: Western Europe Market Value (US$ Million) Forecast by End Use, 2020 to 2035
  • Table 32: Western Europe Market Volume (Units) Forecast by End Use, 2020 to 2035
  • Table 33: Eastern Europe Market Value (US$ Million) Forecast by Country, 2020 to 2035
  • Table 34: Eastern Europe Market Volume (Units) Forecast by Country, 2020 to 2035
  • Table 35: Eastern Europe Market Value (US$ Million) Forecast by Capacity, 2020 to 2035
  • Table 36: Eastern Europe Market Volume (Units) Forecast by Capacity, 2020 to 2035
  • Table 37: Eastern Europe Market Value (US$ Million) Forecast by Closure Type, 2020 to 2035
  • Table 38: Eastern Europe Market Volume (Units) Forecast by Closure Type, 2020 to 2035
  • Table 39: Eastern Europe Market Value (US$ Million) Forecast by End Use, 2020 to 2035
  • Table 40: Eastern Europe Market Volume (Units) Forecast by End Use, 2020 to 2035
  • Table 41: South Asia and Pacific Market Value (US$ Million) Forecast by Country, 2020 to 2035
  • Table 42: South Asia and Pacific Market Volume (Units) Forecast by Country, 2020 to 2035
  • Table 43: South Asia and Pacific Market Value (US$ Million) Forecast by Capacity, 2020 to 2035
  • Table 44: South Asia and Pacific Market Volume (Units) Forecast by Capacity, 2020 to 2035
  • Table 45: South Asia and Pacific Market Value (US$ Million) Forecast by Closure Type, 2020 to 2035
  • Table 46: South Asia and Pacific Market Volume (Units) Forecast by Closure Type, 2020 to 2035
  • Table 47: South Asia and Pacific Market Value (US$ Million) Forecast by End Use, 2020 to 2035
  • Table 48: South Asia and Pacific Market Volume (Units) Forecast by End Use, 2020 to 2035
  • Table 49: East Asia Market Value (US$ Million) Forecast by Country, 2020 to 2035
  • Table 50: East Asia Market Volume (Units) Forecast by Country, 2020 to 2035
  • Table 51: East Asia Market Value (US$ Million) Forecast by Capacity, 2020 to 2035
  • Table 52: East Asia Market Volume (Units) Forecast by Capacity, 2020 to 2035
  • Table 53: East Asia Market Value (US$ Million) Forecast by Closure Type, 2020 to 2035
  • Table 54: East Asia Market Volume (Units) Forecast by Closure Type, 2020 to 2035
  • Table 55: East Asia Market Value (US$ Million) Forecast by End Use, 2020 to 2035
  • Table 56: East Asia Market Volume (Units) Forecast by End Use, 2020 to 2035
  • Table 57: Middle East and Africa Market Value (US$ Million) Forecast by Country, 2020 to 2035
  • Table 58: Middle East and Africa Market Volume (Units) Forecast by Country, 2020 to 2035
  • Table 59: Middle East and Africa Market Value (US$ Million) Forecast by Capacity, 2020 to 2035
  • Table 60: Middle East and Africa Market Volume (Units) Forecast by Capacity, 2020 to 2035
  • Table 61: Middle East and Africa Market Value (US$ Million) Forecast by Closure Type, 2020 to 2035
  • Table 62: Middle East and Africa Market Volume (Units) Forecast by Closure Type, 2020 to 2035
  • Table 63: Middle East and Africa Market Value (US$ Million) Forecast by End Use, 2020 to 2035
  • Table 64: Middle East and Africa Market Volume (Units) Forecast by End Use, 2020 to 2035

List of Figures

  • Figure 1: Global Market Value (US$ Million) by Capacity, 2025 to 2035
  • Figure 2: Global Market Value (US$ Million) by Closure Type, 2025 to 2035
  • Figure 3: Global Market Value (US$ Million) by End Use, 2025 to 2035
  • Figure 4: Global Market Value (US$ Million) by Region, 2025 to 2035
  • Figure 5: Global Market Value (US$ Million) Analysis by Region, 2020 to 2035
  • Figure 6: Global Market Volume (Units) Analysis by Region, 2020 to 2035
  • Figure 7: Global Market Value Share (%) and BPS Analysis by Region, 2025 to 2035
  • Figure 8: Global Market Y-o-Y Growth (%) Projections by Region, 2025 to 2035
  • Figure 9: Global Market Value (US$ Million) Analysis by Capacity, 2020 to 2035
  • Figure 10: Global Market Volume (Units) Analysis by Capacity, 2020 to 2035
  • Figure 11: Global Market Value Share (%) and BPS Analysis by Capacity, 2025 to 2035
  • Figure 12: Global Market Y-o-Y Growth (%) Projections by Capacity, 2025 to 2035
  • Figure 13: Global Market Value (US$ Million) Analysis by Closure Type, 2020 to 2035
  • Figure 14: Global Market Volume (Units) Analysis by Closure Type, 2020 to 2035
  • Figure 15: Global Market Value Share (%) and BPS Analysis by Closure Type, 2025 to 2035
  • Figure 16: Global Market Y-o-Y Growth (%) Projections by Closure Type, 2025 to 2035
  • Figure 17: Global Market Value (US$ Million) Analysis by End Use, 2020 to 2035
  • Figure 18: Global Market Volume (Units) Analysis by End Use, 2020 to 2035
  • Figure 19: Global Market Value Share (%) and BPS Analysis by End Use, 2025 to 2035
  • Figure 20: Global Market Y-o-Y Growth (%) Projections by End Use, 2025 to 2035
  • Figure 21: Global Market Attractiveness by Capacity, 2025 to 2035
  • Figure 22: Global Market Attractiveness by Closure Type, 2025 to 2035
  • Figure 23: Global Market Attractiveness by End Use, 2025 to 2035
  • Figure 24: Global Market Attractiveness by Region, 2025 to 2035
  • Figure 25: North America Market Value (US$ Million) by Capacity, 2025 to 2035
  • Figure 26: North America Market Value (US$ Million) by Closure Type, 2025 to 2035
  • Figure 27: North America Market Value (US$ Million) by End Use, 2025 to 2035
  • Figure 28: North America Market Value (US$ Million) by Country, 2025 to 2035
  • Figure 29: North America Market Value (US$ Million) Analysis by Country, 2020 to 2035
  • Figure 30: North America Market Volume (Units) Analysis by Country, 2020 to 2035
  • Figure 31: North America Market Value Share (%) and BPS Analysis by Country, 2025 to 2035
  • Figure 32: North America Market Y-o-Y Growth (%) Projections by Country, 2025 to 2035
  • Figure 33: North America Market Value (US$ Million) Analysis by Capacity, 2020 to 2035
  • Figure 34: North America Market Volume (Units) Analysis by Capacity, 2020 to 2035
  • Figure 35: North America Market Value Share (%) and BPS Analysis by Capacity, 2025 to 2035
  • Figure 36: North America Market Y-o-Y Growth (%) Projections by Capacity, 2025 to 2035
  • Figure 37: North America Market Value (US$ Million) Analysis by Closure Type, 2020 to 2035
  • Figure 38: North America Market Volume (Units) Analysis by Closure Type, 2020 to 2035
  • Figure 39: North America Market Value Share (%) and BPS Analysis by Closure Type, 2025 to 2035
  • Figure 40: North America Market Y-o-Y Growth (%) Projections by Closure Type, 2025 to 2035
  • Figure 41: North America Market Value (US$ Million) Analysis by End Use, 2020 to 2035
  • Figure 42: North America Market Volume (Units) Analysis by End Use, 2020 to 2035
  • Figure 43: North America Market Value Share (%) and BPS Analysis by End Use, 2025 to 2035
  • Figure 44: North America Market Y-o-Y Growth (%) Projections by End Use, 2025 to 2035
  • Figure 45: North America Market Attractiveness by Capacity, 2025 to 2035
  • Figure 46: North America Market Attractiveness by Closure Type, 2025 to 2035
  • Figure 47: North America Market Attractiveness by End Use, 2025 to 2035
  • Figure 48: North America Market Attractiveness by Country, 2025 to 2035
  • Figure 49: Latin America Market Value (US$ Million) by Capacity, 2025 to 2035
  • Figure 50: Latin America Market Value (US$ Million) by Closure Type, 2025 to 2035
  • Figure 51: Latin America Market Value (US$ Million) by End Use, 2025 to 2035
  • Figure 52: Latin America Market Value (US$ Million) by Country, 2025 to 2035
  • Figure 53: Latin America Market Value (US$ Million) Analysis by Country, 2020 to 2035
  • Figure 54: Latin America Market Volume (Units) Analysis by Country, 2020 to 2035
  • Figure 55: Latin America Market Value Share (%) and BPS Analysis by Country, 2025 to 2035
  • Figure 56: Latin America Market Y-o-Y Growth (%) Projections by Country, 2025 to 2035
  • Figure 57: Latin America Market Value (US$ Million) Analysis by Capacity, 2020 to 2035
  • Figure 58: Latin America Market Volume (Units) Analysis by Capacity, 2020 to 2035
  • Figure 59: Latin America Market Value Share (%) and BPS Analysis by Capacity, 2025 to 2035
  • Figure 60: Latin America Market Y-o-Y Growth (%) Projections by Capacity, 2025 to 2035
  • Figure 61: Latin America Market Value (US$ Million) Analysis by Closure Type, 2020 to 2035
  • Figure 62: Latin America Market Volume (Units) Analysis by Closure Type, 2020 to 2035
  • Figure 63: Latin America Market Value Share (%) and BPS Analysis by Closure Type, 2025 to 2035
  • Figure 64: Latin America Market Y-o-Y Growth (%) Projections by Closure Type, 2025 to 2035
  • Figure 65: Latin America Market Value (US$ Million) Analysis by End Use, 2020 to 2035
  • Figure 66: Latin America Market Volume (Units) Analysis by End Use, 2020 to 2035
  • Figure 67: Latin America Market Value Share (%) and BPS Analysis by End Use, 2025 to 2035
  • Figure 68: Latin America Market Y-o-Y Growth (%) Projections by End Use, 2025 to 2035
  • Figure 69: Latin America Market Attractiveness by Capacity, 2025 to 2035
  • Figure 70: Latin America Market Attractiveness by Closure Type, 2025 to 2035
  • Figure 71: Latin America Market Attractiveness by End Use, 2025 to 2035
  • Figure 72: Latin America Market Attractiveness by Country, 2025 to 2035
  • Figure 73: Western Europe Market Value (US$ Million) by Capacity, 2025 to 2035
  • Figure 74: Western Europe Market Value (US$ Million) by Closure Type, 2025 to 2035
  • Figure 75: Western Europe Market Value (US$ Million) by End Use, 2025 to 2035
  • Figure 76: Western Europe Market Value (US$ Million) by Country, 2025 to 2035
  • Figure 77: Western Europe Market Value (US$ Million) Analysis by Country, 2020 to 2035
  • Figure 78: Western Europe Market Volume (Units) Analysis by Country, 2020 to 2035
  • Figure 79: Western Europe Market Value Share (%) and BPS Analysis by Country, 2025 to 2035
  • Figure 80: Western Europe Market Y-o-Y Growth (%) Projections by Country, 2025 to 2035
  • Figure 81: Western Europe Market Value (US$ Million) Analysis by Capacity, 2020 to 2035
  • Figure 82: Western Europe Market Volume (Units) Analysis by Capacity, 2020 to 2035
  • Figure 83: Western Europe Market Value Share (%) and BPS Analysis by Capacity, 2025 to 2035
  • Figure 84: Western Europe Market Y-o-Y Growth (%) Projections by Capacity, 2025 to 2035
  • Figure 85: Western Europe Market Value (US$ Million) Analysis by Closure Type, 2020 to 2035
  • Figure 86: Western Europe Market Volume (Units) Analysis by Closure Type, 2020 to 2035
  • Figure 87: Western Europe Market Value Share (%) and BPS Analysis by Closure Type, 2025 to 2035
  • Figure 88: Western Europe Market Y-o-Y Growth (%) Projections by Closure Type, 2025 to 2035
  • Figure 89: Western Europe Market Value (US$ Million) Analysis by End Use, 2020 to 2035
  • Figure 90: Western Europe Market Volume (Units) Analysis by End Use, 2020 to 2035
  • Figure 91: Western Europe Market Value Share (%) and BPS Analysis by End Use, 2025 to 2035
  • Figure 92: Western Europe Market Y-o-Y Growth (%) Projections by End Use, 2025 to 2035
  • Figure 93: Western Europe Market Attractiveness by Capacity, 2025 to 2035
  • Figure 94: Western Europe Market Attractiveness by Closure Type, 2025 to 2035
  • Figure 95: Western Europe Market Attractiveness by End Use, 2025 to 2035
  • Figure 96: Western Europe Market Attractiveness by Country, 2025 to 2035
  • Figure 97: Eastern Europe Market Value (US$ Million) by Capacity, 2025 to 2035
  • Figure 98: Eastern Europe Market Value (US$ Million) by Closure Type, 2025 to 2035
  • Figure 99: Eastern Europe Market Value (US$ Million) by End Use, 2025 to 2035
  • Figure 100: Eastern Europe Market Value (US$ Million) by Country, 2025 to 2035
  • Figure 101: Eastern Europe Market Value (US$ Million) Analysis by Country, 2020 to 2035
  • Figure 102: Eastern Europe Market Volume (Units) Analysis by Country, 2020 to 2035
  • Figure 103: Eastern Europe Market Value Share (%) and BPS Analysis by Country, 2025 to 2035
  • Figure 104: Eastern Europe Market Y-o-Y Growth (%) Projections by Country, 2025 to 2035
  • Figure 105: Eastern Europe Market Value (US$ Million) Analysis by Capacity, 2020 to 2035
  • Figure 106: Eastern Europe Market Volume (Units) Analysis by Capacity, 2020 to 2035
  • Figure 107: Eastern Europe Market Value Share (%) and BPS Analysis by Capacity, 2025 to 2035
  • Figure 108: Eastern Europe Market Y-o-Y Growth (%) Projections by Capacity, 2025 to 2035
  • Figure 109: Eastern Europe Market Value (US$ Million) Analysis by Closure Type, 2020 to 2035
  • Figure 110: Eastern Europe Market Volume (Units) Analysis by Closure Type, 2020 to 2035
  • Figure 111: Eastern Europe Market Value Share (%) and BPS Analysis by Closure Type, 2025 to 2035
  • Figure 112: Eastern Europe Market Y-o-Y Growth (%) Projections by Closure Type, 2025 to 2035
  • Figure 113: Eastern Europe Market Value (US$ Million) Analysis by End Use, 2020 to 2035
  • Figure 114: Eastern Europe Market Volume (Units) Analysis by End Use, 2020 to 2035
  • Figure 115: Eastern Europe Market Value Share (%) and BPS Analysis by End Use, 2025 to 2035
  • Figure 116: Eastern Europe Market Y-o-Y Growth (%) Projections by End Use, 2025 to 2035
  • Figure 117: Eastern Europe Market Attractiveness by Capacity, 2025 to 2035
  • Figure 118: Eastern Europe Market Attractiveness by Closure Type, 2025 to 2035
  • Figure 119: Eastern Europe Market Attractiveness by End Use, 2025 to 2035
  • Figure 120: Eastern Europe Market Attractiveness by Country, 2025 to 2035
  • Figure 121: South Asia and Pacific Market Value (US$ Million) by Capacity, 2025 to 2035
  • Figure 122: South Asia and Pacific Market Value (US$ Million) by Closure Type, 2025 to 2035
  • Figure 123: South Asia and Pacific Market Value (US$ Million) by End Use, 2025 to 2035
  • Figure 124: South Asia and Pacific Market Value (US$ Million) by Country, 2025 to 2035
  • Figure 125: South Asia and Pacific Market Value (US$ Million) Analysis by Country, 2020 to 2035
  • Figure 126: South Asia and Pacific Market Volume (Units) Analysis by Country, 2020 to 2035
  • Figure 127: South Asia and Pacific Market Value Share (%) and BPS Analysis by Country, 2025 to 2035
  • Figure 128: South Asia and Pacific Market Y-o-Y Growth (%) Projections by Country, 2025 to 2035
  • Figure 129: South Asia and Pacific Market Value (US$ Million) Analysis by Capacity, 2020 to 2035
  • Figure 130: South Asia and Pacific Market Volume (Units) Analysis by Capacity, 2020 to 2035
  • Figure 131: South Asia and Pacific Market Value Share (%) and BPS Analysis by Capacity, 2025 to 2035
  • Figure 132: South Asia and Pacific Market Y-o-Y Growth (%) Projections by Capacity, 2025 to 2035
  • Figure 133: South Asia and Pacific Market Value (US$ Million) Analysis by Closure Type, 2020 to 2035
  • Figure 134: South Asia and Pacific Market Volume (Units) Analysis by Closure Type, 2020 to 2035
  • Figure 135: South Asia and Pacific Market Value Share (%) and BPS Analysis by Closure Type, 2025 to 2035
  • Figure 136: South Asia and Pacific Market Y-o-Y Growth (%) Projections by Closure Type, 2025 to 2035
  • Figure 137: South Asia and Pacific Market Value (US$ Million) Analysis by End Use, 2020 to 2035
  • Figure 138: South Asia and Pacific Market Volume (Units) Analysis by End Use, 2020 to 2035
  • Figure 139: South Asia and Pacific Market Value Share (%) and BPS Analysis by End Use, 2025 to 2035
  • Figure 140: South Asia and Pacific Market Y-o-Y Growth (%) Projections by End Use, 2025 to 2035
  • Figure 141: South Asia and Pacific Market Attractiveness by Capacity, 2025 to 2035
  • Figure 142: South Asia and Pacific Market Attractiveness by Closure Type, 2025 to 2035
  • Figure 143: South Asia and Pacific Market Attractiveness by End Use, 2025 to 2035
  • Figure 144: South Asia and Pacific Market Attractiveness by Country, 2025 to 2035
  • Figure 145: East Asia Market Value (US$ Million) by Capacity, 2025 to 2035
  • Figure 146: East Asia Market Value (US$ Million) by Closure Type, 2025 to 2035
  • Figure 147: East Asia Market Value (US$ Million) by End Use, 2025 to 2035
  • Figure 148: East Asia Market Value (US$ Million) by Country, 2025 to 2035
  • Figure 149: East Asia Market Value (US$ Million) Analysis by Country, 2020 to 2035
  • Figure 150: East Asia Market Volume (Units) Analysis by Country, 2020 to 2035
  • Figure 151: East Asia Market Value Share (%) and BPS Analysis by Country, 2025 to 2035
  • Figure 152: East Asia Market Y-o-Y Growth (%) Projections by Country, 2025 to 2035
  • Figure 153: East Asia Market Value (US$ Million) Analysis by Capacity, 2020 to 2035
  • Figure 154: East Asia Market Volume (Units) Analysis by Capacity, 2020 to 2035
  • Figure 155: East Asia Market Value Share (%) and BPS Analysis by Capacity, 2025 to 2035
  • Figure 156: East Asia Market Y-o-Y Growth (%) Projections by Capacity, 2025 to 2035
  • Figure 157: East Asia Market Value (US$ Million) Analysis by Closure Type, 2020 to 2035
  • Figure 158: East Asia Market Volume (Units) Analysis by Closure Type, 2020 to 2035
  • Figure 159: East Asia Market Value Share (%) and BPS Analysis by Closure Type, 2025 to 2035
  • Figure 160: East Asia Market Y-o-Y Growth (%) Projections by Closure Type, 2025 to 2035
  • Figure 161: East Asia Market Value (US$ Million) Analysis by End Use, 2020 to 2035
  • Figure 162: East Asia Market Volume (Units) Analysis by End Use, 2020 to 2035
  • Figure 163: East Asia Market Value Share (%) and BPS Analysis by End Use, 2025 to 2035
  • Figure 164: East Asia Market Y-o-Y Growth (%) Projections by End Use, 2025 to 2035
  • Figure 165: East Asia Market Attractiveness by Capacity, 2025 to 2035
  • Figure 166: East Asia Market Attractiveness by Closure Type, 2025 to 2035
  • Figure 167: East Asia Market Attractiveness by End Use, 2025 to 2035
  • Figure 168: East Asia Market Attractiveness by Country, 2025 to 2035
  • Figure 169: Middle East and Africa Market Value (US$ Million) by Capacity, 2025 to 2035
  • Figure 170: Middle East and Africa Market Value (US$ Million) by Closure Type, 2025 to 2035
  • Figure 171: Middle East and Africa Market Value (US$ Million) by End Use, 2025 to 2035
  • Figure 172: Middle East and Africa Market Value (US$ Million) by Country, 2025 to 2035
  • Figure 173: Middle East and Africa Market Value (US$ Million) Analysis by Country, 2020 to 2035
  • Figure 174: Middle East and Africa Market Volume (Units) Analysis by Country, 2020 to 2035
  • Figure 175: Middle East and Africa Market Value Share (%) and BPS Analysis by Country, 2025 to 2035
  • Figure 176: Middle East and Africa Market Y-o-Y Growth (%) Projections by Country, 2025 to 2035
  • Figure 177: Middle East and Africa Market Value (US$ Million) Analysis by Capacity, 2020 to 2035
  • Figure 178: Middle East and Africa Market Volume (Units) Analysis by Capacity, 2020 to 2035
  • Figure 179: Middle East and Africa Market Value Share (%) and BPS Analysis by Capacity, 2025 to 2035
  • Figure 180: Middle East and Africa Market Y-o-Y Growth (%) Projections by Capacity, 2025 to 2035
  • Figure 181: Middle East and Africa Market Value (US$ Million) Analysis by Closure Type, 2020 to 2035
  • Figure 182: Middle East and Africa Market Volume (Units) Analysis by Closure Type, 2020 to 2035
  • Figure 183: Middle East and Africa Market Value Share (%) and BPS Analysis by Closure Type, 2025 to 2035
  • Figure 184: Middle East and Africa Market Y-o-Y Growth (%) Projections by Closure Type, 2025 to 2035
  • Figure 185: Middle East and Africa Market Value (US$ Million) Analysis by End Use, 2020 to 2035
  • Figure 186: Middle East and Africa Market Volume (Units) Analysis by End Use, 2020 to 2035
  • Figure 187: Middle East and Africa Market Value Share (%) and BPS Analysis by End Use, 2025 to 2035
  • Figure 188: Middle East and Africa Market Y-o-Y Growth (%) Projections by End Use, 2025 to 2035
  • Figure 189: Middle East and Africa Market Attractiveness by Capacity, 2025 to 2035
  • Figure 190: Middle East and Africa Market Attractiveness by Closure Type, 2025 to 2035
  • Figure 191: Middle East and Africa Market Attractiveness by End Use, 2025 to 2035
  • Figure 192: Middle East and Africa Market Attractiveness by Country, 2025 to 2035

Frequently Asked Questions

What was the overall size of the corrugated open-head drums market 2025?

The overall market size for corrugated open-head drums market was USD 1.5 billion in 2025.

How big the Bio is based corrugated open-head drums market expected in 2035?

Corrugated open-head drums market is expected to reach USD 3.1 billion in 2035.

What will drive the demand for corrugated open-head drums market during the forecast period?

The demand for Corrugated Open-Head Drums is expected to rise due to increasing preference for lightweight and sustainable packaging solutions, growing demand in the chemical and pharmaceutical industries, and rising emphasis on cost-effective bulk packaging.

List the top 5 countries contributing in corrugated open-head drums market?

The top 5 countries which drives the development of corrugated open-head drums market are USA, UK, Europe Union, Japan and South Korea.

Which segment in type is expected to lead in corrugated open-head drums market?

25-50 Gallon Drums and Metal Closure Systems to command significant share over the assessment period.

Explore Similar Insights

Future Market Insights

Corrugated Open-head Drums Market