Corrugated Board Market
Sustainable Packaging Products Trend Accelerating Corrugated Board Packaging Market Expansion. Grab the Insights with FMI!
Corrugated Board Market By Flute Type, Board Type, End Use & Region | Forecast 2023 to 2033
Corrugated Board Market Outlook
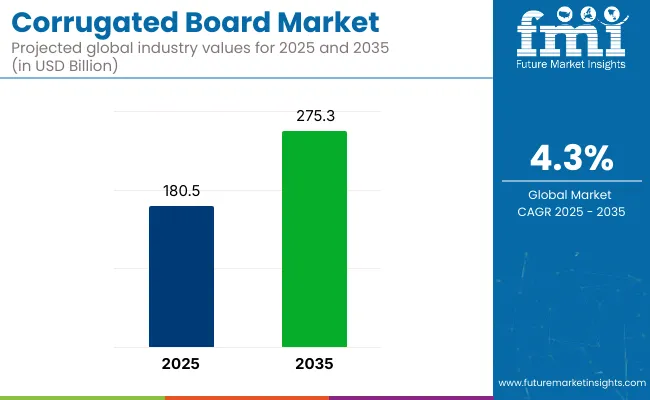
With a projected CAGR of 6.8% from 2023 to 2033, the size of the global corrugated board market is projected to reach US$ 143.86 billion in 2023. By 2033, it is predicted that the corrugated board market would be worth US$ 277.75 billion.
Over the upcoming years, the market is anticipated to be driven by an increase in online sales and a rise in consumer awareness of sustainable packaging. The market is anticipated to grow in the upcoming years due to government restrictions regarding food packaging safety and the demand for better packaging materials.
The market is expected to be driven by the ban on plastic packaging in developing nations like India, rising industrialization, and rising international trade during the forecasted period. The market expansion is projected to be supported by the widespread adoption of corrugated boards for goods such as liquid bottles, fruits and vegetables, ready-to-eat food, and confectionery products.
Attributes |
Details |
Corrugated Board Market CAGR (From 2023 to 2033) |
6.8% |
Corrugated Board Market Size (2023) |
US$ 143.86 billion |
Corrugated Board Market Size (2033) |
US$ 277.75 billion |
Let us know your requirement to get
100% FREE customization
Factors Boosting Market Growth
Demand for corrugated packaging for product shipping has increased as a result of the booming e-commerce industry, which is primarily comprised of online shopping.
Consumers are well-served by e-commerce companies. The packaging industry has continuously developed to meet the needs of the hour, just like the retail revolution did in a constantly changing environment. Packaging requirements have changed as a result of consumers moving to e-commerce.
Through creative and appropriate packaging that meets the unique requirements of the channel, online adoption can be accelerated The expansion of the e-commerce industry causes a boom in corrugated board market trends. E-commerce has grown by over 300% in recent years and is predicted to continue growing rapidly.
What Are the Opportunities Right Now in the Corrugated Board Market?
Smurfit Kappa is implementing digitalization by creating a variety of new products and introducing them to the corrugated board market. A prominent producer of corrugated packaging solutions, Smurfit Kappa, has improved the corrugated business by introducing digitalization.
The business just created a new line of multifunctional paper that is anticipated to work well with both flexographic and digital printers. The creation of multifunctional paper made it possible for the printer to function alongside the packing material. With the help of this development, the parameters for ideal digital printing have been increased, enabling this technology to reach its full potential.
Numerous advantages, including higher sales and more flexibility, have come from graphic design tailored to each client. The business anticipates stepping up its sustainability initiatives in addition to creating new technologies and upgrading those already in use. These developments are propelling the digitization of paper-based packaging and opening up significant corrugated board market expansion potential.
Find your sweet spots for generating winning opportunities in this market.
Talk to AnalystWhat is Negatively Affecting the Market Growth?
Due to severe competition from flexible plastic packaging, the corrugated board market is growing behind time than expected. The value for manufacturers and merchants is flexible packaging. This is because it can reduce packaging weight, which lowers shipping and storage costs. The packing, therefore, takes up less space.
The pouches' single-serve quantities, easy-to-open seal, and peel-and-seal choices may make them more user-friendly for consumers. In retort pouches, they taste better than in tin cans.
Due to convenience, mobility, cost savings, sustainability, and health advantages, manufacturers and package converters are transitioning from rigid to flexible packaging materials. For the corrugated board market, maintaining environmental requirements during manufacture is a difficulty. Even though corrugated boards are in high demand among customers, their inclusion as a highly desired packing solution is seriously hampered by their high energy consumption and the environmental effects they are linked to.
Corrugated boards have a substantial environmental impact in addition to using wood pulp in their production. Therefore, compared to the energy needed to produce plastic, the energy needed for this process is substantially higher.
Comparative View of Adjacent Corrugated Board Market
Corrugated Board Market:
Attributes |
Corrugated Board Market |
CAGR (From 2023 to 2033) |
6.8% |
Market Value (2023) |
US$ 143.86 billion |
Growth Factor |
There is now more demand due to booming urbanization rates and greater disposable income worldwide. |
Opportunity |
The growth of the corrugated packaging industry is significantly influenced by sustainability. |
Key Trends |
The corrugated packaging market may experience significant expansion as a result of the rapid rise in consumer preference for online shopping. |
Gypsum Board Market:
Attributes |
Gypsum Board Market |
CAGR (From 2023 to 2033) |
11.8% |
Market Value (2023) |
US$ 63 billion |
Growth Factor |
The demand for the product is anticipated to rise as a result of expanding residential construction and rising consumer spending on high-tech building materials. |
Opportunity |
Demand for products is projected to increase as the range of creative applications in the construction industry expands. |
Key Trends |
It is anticipated that the market expansion may be supported by the rapidly expanding construction industry in the leading economies. |
Intermediate Bulk Container (IBC) Market:
Attributes |
Intermediate Bulk Container (IBC) Market |
CAGR (From 2023 to 2033) |
5.2% |
Market Value (2023) |
US$ 14.83 billion |
Growth Factor |
It is projected that IBC may continue to be used in the pharmaceutical sector. The pharmaceutical industry is expected to see an increase in demand for intermediate bulk containers as a result. |
Opportunity |
IBCs market growth is believed to be significantly influenced by the expansion of food processing businesses and agricultural production. |
Key Trends |
Demand on the market is being driven by the nation's rapidly expanding chemical and pharmaceutical industries. |

A unified Market Research Subscription Platform, built for today's disparate research needs.
Segmentation Outlook
Which Flute Type is Incredibly Popular in the Category?
Attributes |
Details |
C-flute Segment Share |
25% |
A-flute Segment CAGR |
7.7% |
In terms of revenue, C-flute leads the segment with over 25.0%. For lightweight items, C-flute gives stronger compression strength than the B-flute and greater stacking strength. It is frequently utilized for shipping cases, glass product packaging, and furniture packing. With less utilization of fiber material, C-flute gives the package a high load-bearing capacity.
- As an illustration, Acme Box Co. Inc. provides a high-performance C-flute board that comes with both kraft and white exterior liner options. Food products, pet supplies, medications, and personal care products all use these materials in their packaging. They can be made into traditional boxes or die cuts.
An a-flute segment of the corrugated board market is predicted to grow at a maximum CAGR of 7.7% during the projection period. A flute, one of the considerable types, is mostly used for transit packaging.
- For instance, STI - Gustav Stabernack GmbH uses cardboard or corrugated board to convey goods to clients in undamaged condition. A thick flute that simultaneously functions as a shock absorber protects the packed goods from external impacts.
How Affluent are the Opportunities in the Board Style Segment?
Attributes |
Details |
Single Wall Segment Share |
35% |
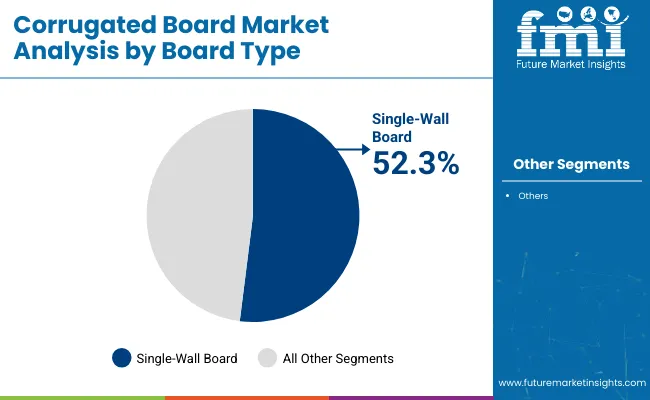
With a revenue corrugated board market share of nearly 35%, the single wall segment became the leading proportion and is anticipated to hold onto the top spot during the projected period. It serves as an additional layer of protection, divider, pad, or partition that can be utilized to separate the various product layers.
Single-wall shipping cartons in C, B, or E flutes are available from Nordpack GmbH and can be utilized for lighter packaging. It can be easily printed, allowing for the application of various coatings to its surface, and is used to create cartons for the packing of a variety of commodities.
Due to the lesser weight of the single layer of fluted paper used in single-wall corrugated board boxes, shipping expenses are decreased. They are frequently used in e-commerce packaging to deliver more compact and smaller items. Increased demand for packaging solutions is probably a result of the growing popularity of online shopping.
Regional Outlook
How is the Japan Market Faring?
Attributes |
Details |
Japanese Market CAGR |
6.7% |
Manufacturers of the market concentrate on introducing innovations to enhance product functionality. Working within the current supply chain should allow new product innovations to develop quickly, leveraging the size and manufacturing know-how of large producers to bring superior corrugated packaging materials to market and make a significant impact.
Manufacturers of corrugated packaging products concentrate on enhancing corrugated products' packing efficiency through the development of innovative technologies.
- For instance, Rengo Co., Ltd. has introduced a new approach to increase packing effectiveness. The business unveiled a unique method, the ‘Rengo Gemini Packaging System,’ a recently created automated system for packaging.
This packing technology calculates the ideal package size by measuring the height of the goods. With this approach, there is no wasted space in the package, which improves the effectiveness of shipping. During the forecast period, the Japanese corrugated packaging market is anticipated to expand at a CAGR of 6.7%.
What is the Future of the United States Market?
Attributes |
Details |
United States Market Share |
19.1% |
During the projection period, the United States corrugated board market accounted for around 19.1% of the global corrugated packaging market.
In the United States corrugated packaging sector, the DIY movement is expanding quickly. People are producing things on their own, at home. The production of DIY (Do-it-yourself) corrugated pallets for end-use industries, particularly in the logistics sector, by makers of corrugated packaging materials has broadened the reach of the industry.
The benefit of DIY corrugated pallets, according to United States-based pallet manufacturer Millwood, Inc., is that they are simple to put together and don't require any special tools. DIY pallets are space-saving since they are simple to deconstruct. Pallets made by hand weigh less than wooden or plastic ones. This makes it the ideal option for shipping flying freight.
How Strong is the Swedish Market?
Attributes |
Details |
Sweden Market Share |
6% |
For the creation of items made of corrugated packaging, manufacturers in Sweden are implementing Arcwise Technology. According to Indevco Paper Containers, a maker of corrugated boards, this technology offers distinctive packaging technology that may be used to create curved corrugated board packaging.
By improving print quality, it provides premium packaging at the point of sale. The patented technology has the potential to significantly reduce carbon footprint by enabling the development of lightweight packaging.
Up to 30% in material savings are attainable due to the strength that the curved shape adds. By combining graphic design with curved packaging that has the rigidity of corrugated board, technology offers a singular possibility.
During the projection period, the corrugated board market in Sweden made up around 6% of the global market.
What Attracts Investors to the Asia Pacific Market?
Attributes |
Details |
Asia Pacific Market Share |
40% |
With a revenue share of more than 40%, Asia Pacific was revealed as a significant corrugated board market. In Asia Pacific, the packaging industry and therefore corrugated boards are expected to develop due to the existence of densely populated nations like China and India, rising urbanization, and rising per capita income in the region.
The market may expand as a result of rising environmental consciousness and rising demand for environmentally friendly packaging options in the region. The emphasis may move to paper packaging as a result of government initiatives to outlaw plastic packaging in nations like India. The amount of FDIs and funding for various packaging initiatives in Asian nations is anticipated to increase rapidly.
These developments are anticipated to fuel the expansion of these nations' packaging manufacturing industries. The demand for corrugated board increase in the region during the projection period would have a solid base supported by economic and industrial improvements.
Over the forecast period, Asia Pacific is anticipated to have swift revenue CAGR. Due to technical advancements like blockchain technology, machine learning, artificial intelligence, and IoT, the region is expanding at an exponential rate (IoT). Due to low energy and labor costs and excellent labor productivity, a significant amount of paper mills in Asia are favorably positioned on the cost curve of the global corrugated board market.
How Competition Influences the Corrugated Board Market?
Throughout the world, the corrugated board market is enormous and fragmented. At all sizes of manufacturers, from small to large, the market's participants are fiercely competitive. Many well-established, century-old public corporations are present, which makes the market distinctive. In other cases, the manufacturing firms compete with other businesses that make goods that may serve as corrugated board alternatives and are identical to theirs. Services, product quality, costs, and prices are the main determinants of market competitiveness.
Due to the growth of highly specialized products like corrugated boards with lightweight flutes, plastic coatings, and printing-compatible surface sheets, manufacturers in the corrugated board market can gain a competitive edge to stand out in the printing-compatible surface sheets. By offering consumers value-added, distinctive solutions, the enterprises compete in the areas of services and linked machinery solutions.
Recent Development:
- Launch- Introduce novel e-commerce products and services
Date | June 29th, 2021 |
Company | Smurfit Kappa Group LLC |
Details | The Smurfit Kappa Group LLC has launched the inauguration of a new e-commerce corrugated packaging plant in the United Kingdom. This facility tested and introduced innovative e-commerce solutions that are trustworthy ISTA certified by June 2021. |
Date | February 1st, 2021 |
Company | Mondi |
Details | Mondi may launch BCoolBox, a new product, to its sustainable e-commerce line-up, which may also contain fresh food and produce. It is a packaging solution built of a corrugated range with thermo-insulation that may keep food cold and at a consistent temperature of fewer than 7 degrees for 24 hours without requiring external cooling. |
Date | August 2021 |
Company | DS Smith |
Details | DS Smith created fully recyclable packaging as part of the Blaue Helden e-commerce packaging concept. With this sustainably created e-commerce packaging, DS Smith offers plastic-free cleaning tabs from Blaue Helden that have an improved appearance suitable for online retail and are made entirely of corrugated cardboard. |
- Acquisition - The business may be in a position to improve its capabilities.
Date | 2022 |
Company | UFP Packaging |
Details | UFP Packaging, a division of UFP Industries, a holding corporation based in the United States, bought Titan Corrugated and its subsidiary All Boxed Up in 2022 to broaden its market reach. |
Date | March 2021 |
Company | International Paper |
Details | International paper completed the purchase of two cutting-edge corrugated board facilities in Spain. The corporation may be able to improve its skills in Madrid and Catalonia by acquiring this business. The company's corrugated board business in EMEA is crucial to its overall strategy. In the industrial market, it provides high-quality packaging solutions with an emphasis on fruit and vegetable packaging and e-commerce solutions. As of April 1, 2021, the two companies are a part of International Paper. |
- New Production Line- Both the packaging portfolio and production procedures are to get modernized.
Date | September 2021 |
Company | Mondi Group |
Details | The Mondi Group's corrugated board manufacturing facility in Szczecin, Poland, received a new production line in September 2021. The company's packaging range may grow as a result of the growth, and the production procedures may be simplified. The company is in a good position to maintain its status as a leading provider of e-commerce packaging to the expanding European market in conjunction with this development. |
Key Players
- International Paper
- Georgia-Pacific
- WestRock Company
- Packaging Corporation of America
- Stora Enso
- Oji Holdings Corporation
- Smurfit Kappa
- Port Townsend Paper Company
- Mondi
- DS Smith
Key Segments
By Flute Type:
- Flute A
- Flute B
- Flute C
- Flute E
- Flute F
By Board Type:
- Single Wall
- Double Wall
- Triple Wall
By End Use:
- Food & Beverages
- Pharmaceuticals
- Cosmetics & Personal Care
- Automotive
- Transportation & Logistics
By Region:
- North America
- Latin America
- Europe
- East Asia
- South Asia
- Oceania
- The Middle East and Africa
Frequently Asked Questions
The market was valued at US$ 134.7 billion in 2022.
By 2033, the market is anticipated to produce US$ 277.75 billion.
The market is expected to yield US$ 143.86 billion by 2023.
From 2023 to 2033, the market is expected to rise at a robust CAGR of 6.8%.
During the anticipated period, the C-flute sector in the flute-type category is expected to capture a market share of 25.0%.
During the anticipated period, the single-wall segment is expected to hold a market share of 35.0%.
Table of Content
1. Executive Summary | Corrugated Board Market
1.1. Global Market Outlook
1.2. Demand-side Trends
1.3. Supply-side Trends
1.4. Technology Roadmap Analysis
1.5. Analysis and Recommendations
2. Market Overview
2.1. Market Coverage / Taxonomy
2.2. Market Definition / Scope / Limitations
3. Market Background
3.1. Market Dynamics
3.1.1. Drivers
3.1.2. Restraints
3.1.3. Opportunity
3.1.4. Trends
3.2. Scenario Forecast
3.2.1. Demand in Optimistic Scenario
3.2.2. Demand in Likely Scenario
3.2.3. Demand in Conservative Scenario
3.3. Opportunity Map Analysis
3.4. Product Life Cycle Analysis
3.5. Supply Chain Analysis
3.5.1. Supply Side Participants and their Roles
3.5.1.1. Producers
3.5.1.2. Mid-Level Participants (Traders/ Agents/ Brokers)
3.5.1.3. Wholesalers and Distributors
3.5.2. Value Added and Value Created at Node in the Supply Chain
3.5.3. List of Raw Material Suppliers
3.5.4. List of Existing and Potential Buyer’s
3.6. Investment Feasibility Matrix
3.7. Value Chain Analysis
3.7.1. Profit Margin Analysis
3.7.2. Wholesalers and Distributors
3.7.3. Retailers
3.8. PESTLE and Porter’s Analysis
3.9. Regulatory Landscape
3.9.1. By Key Regions
3.9.2. By Key Countries
3.10. Regional Parent Market Outlook
3.11. Production and Consumption Statistics
3.12. Import and Export Statistics
4. Global Market Analysis 2018 to 2022 and Forecast, 2023 to 2033
4.1. Historical Market Size Value (US$ Million) & Volume (Tons) Analysis, 2018 to 2022
4.2. Current and Future Market Size Value (US$ Million) & Volume (Tons) Projections, 2023 to 2033
4.2.1. Y-o-Y Growth Trend Analysis
4.2.2. Absolute $ Opportunity Analysis
5. Global Market Analysis 2018 to 2022 and Forecast 2023 to 2033, By Flute Type
5.1. Introduction / Key Findings
5.2. Historical Market Size Value (US$ Million) & Volume (Tons) Analysis By Flute Type, 2018 to 2022
5.3. Current and Future Market Size Value (US$ Million) & Volume (Tons) Analysis and Forecast By Flute Type, 2023 to 2033
5.3.1. Flute A
5.3.2. Flute B
5.3.3. Flute C
5.3.4. Flute E
5.3.5. Flute F
5.4. Y-o-Y Growth Trend Analysis By Flute Type, 2018 to 2022
5.5. Absolute $ Opportunity Analysis By Flute Type, 2023 to 2033
6. Global Market Analysis 2018 to 2022 and Forecast 2023 to 2033, By Board Type
6.1. Introduction / Key Findings
6.2. Historical Market Size Value (US$ Million) & Volume (Tons) Analysis By Board Type, 2018 to 2022
6.3. Current and Future Market Size Value (US$ Million) & Volume (Tons) Analysis and Forecast By Board Type, 2023 to 2033
6.3.1. Single Wall
6.3.2. Double Wall
6.3.3. Triple Wall
6.4. Y-o-Y Growth Trend Analysis By Board Type, 2018 to 2022
6.5. Absolute $ Opportunity Analysis By Board Type, 2023 to 2033
7. Global Market Analysis 2018 to 2022 and Forecast 2023 to 2033, By End Use
7.1. Introduction / Key Findings
7.2. Historical Market Size Value (US$ Million) & Volume (Tons) Analysis By End Use, 2018 to 2022
7.3. Current and Future Market Size Value (US$ Million) & Volume (Tons) Analysis and Forecast By End Use, 2023 to 2033
7.3.1. Food & Beverages
7.3.2. Pharmaceuticals
7.3.3. Cosmetics & Personal Care
7.3.4. Automotive
7.3.5. Transportation & Logistics
7.4. Y-o-Y Growth Trend Analysis By End Use, 2018 to 2022
7.5. Absolute $ Opportunity Analysis By End Use, 2023 to 2033
8. Global Market Analysis 2018 to 2022 and Forecast 2023 to 2033, By Region
8.1. Introduction
8.2. Historical Market Size Value (US$ Million) & Volume (Tons) Analysis By Region, 2018 to 2022
8.3. Current Market Size Value (US$ Million) & Volume (Tons) Analysis and Forecast By Region, 2023 to 2033
8.3.1. North America
8.3.2. Latin America
8.3.3. Europe
8.3.4. East Asia
8.3.5. South Asia
8.3.6. Oceania
8.3.7. Middle East and Africa
8.4. Market Attractiveness Analysis By Region
9. North America Market Analysis 2018 to 2022 and Forecast 2023 to 2033, By Country
9.1. Historical Market Size Value (US$ Million) & Volume (Tons) Trend Analysis By Market Taxonomy, 2018 to 2022
9.2. Market Size Value (US$ Million) & Volume (Tons) Forecast By Market Taxonomy, 2023 to 2033
9.2.1. By Country
9.2.1.1. The USA
9.2.1.2. Canada
9.2.2. By Flute Type
9.2.3. By Board Type
9.2.4. By End Use
9.3. Market Attractiveness Analysis
9.3.1. By Country
9.3.2. By Flute Type
9.3.3. By Board Type
9.3.4. By End Use
9.4. Key Takeaways
10. Latin America Market Analysis 2018 to 2022 and Forecast 2023 to 2033, By Country
10.1. Historical Market Size Value (US$ Million) & Volume (Tons) Trend Analysis By Market Taxonomy, 2018 to 2022
10.2. Market Size Value (US$ Million) & Volume (Tons) Forecast By Market Taxonomy, 2023 to 2033
10.2.1. By Country
10.2.1.1. Brazil
10.2.1.2. Mexico
10.2.1.3. Rest of Latin America
10.2.2. By Flute Type
10.2.3. By Board Type
10.2.4. By End Use
10.3. Market Attractiveness Analysis
10.3.1. By Country
10.3.2. By Flute Type
10.3.3. By Board Type
10.3.4. By End Use
10.4. Key Takeaways
11. Europe Market Analysis 2018 to 2022 and Forecast 2023 to 2033, By Country
11.1. Historical Market Size Value (US$ Million) & Volume (Tons) Trend Analysis By Market Taxonomy, 2018 to 2022
11.2. Market Size Value (US$ Million) & Volume (Tons) Forecast By Market Taxonomy, 2023 to 2033
11.2.1. By Country
11.2.1.1. Germany
11.2.1.2. Italy
11.2.1.3. France
11.2.1.4. United Kingdom (UK)
11.2.1.5. Spain
11.2.1.6. BENELUX
11.2.1.7. Russia
11.2.1.8. Rest of Europe
11.2.2. By Flute Type
11.2.3. By Board Type
11.2.4. By End Use
11.3. Market Attractiveness Analysis
11.3.1. By Country
11.3.2. By Flute Type
11.3.3. By Board Type
11.3.4. By End Use
11.4. Key Takeaways
12. East Asia Market Analysis 2018 to 2022 and Forecast 2023 to 2033, By Country
12.1. Historical Market Size Value (US$ Million) & Volume (Tons) Trend Analysis By Market Taxonomy, 2018 to 2022
12.2. Market Size Value (US$ Million) & Volume (Tons) Forecast By Market Taxonomy, 2023 to 2033
12.2.1. By Country
12.2.1.1. China
12.2.1.2. Japan
12.2.1.3. South Korea
12.2.2. By Flute Type
12.2.3. By Board Type
12.2.4. By End Use
12.3. Market Attractiveness Analysis
12.3.1. By Country
12.3.2. By Flute Type
12.3.3. By Board Type
12.3.4. By End Use
12.4. Key Takeaways
13. South Asia Market Analysis 2018 to 2022 and Forecast 2023 to 2033, By Country
13.1. Historical Market Size Value (US$ Million) & Volume (Tons) Trend Analysis By Market Taxonomy, 2018 to 2022
13.2. Market Size Value (US$ Million) & Volume (Tons) Forecast By Market Taxonomy, 2023 to 2033
13.2.1. By Country
13.2.1.1. Malaysia
13.2.1.2. Thailand
13.2.1.3. India
13.2.1.4. Rest of South Asia
13.2.2. By Flute Type
13.2.3. By Board Type
13.2.4. By End Use
13.3. Market Attractiveness Analysis
13.3.1. By Country
13.3.2. By Flute Type
13.3.3. By Board Type
13.3.4. By End Use
13.4. Key Takeaways
14. Oceania Market Analysis 2018 to 2022 and Forecast 2023 to 2033, By Country
14.1. Historical Market Size Value (US$ Million) & Volume (Tons) Trend Analysis By Market Taxonomy, 2018 to 2022
14.2. Market Size Value (US$ Million) & Volume (Tons) Forecast By Market Taxonomy, 2023 to 2033
14.2.1. By Country
14.2.1.1. Australia
14.2.1.2. New Zealand
14.2.2. By Flute Type
14.2.3. By Board Type
14.2.4. By End Use
14.3. Market Attractiveness Analysis
14.3.1. By Country
14.3.2. By Flute Type
14.3.3. By Board Type
14.3.4. By End Use
14.4. Key Takeaways
15. Middle East and Africa Market Analysis 2018 to 2022 and Forecast 2023 to 2033, By Country
15.1. Historical Market Size Value (US$ Million) & Volume (Tons) Trend Analysis By Market Taxonomy, 2018 to 2022
15.2. Market Size Value (US$ Million) & Volume (Tons) Forecast By Market Taxonomy, 2023 to 2033
15.2.1. By Country
15.2.1.1. GCC Countries
15.2.1.2. South Africa
15.2.1.3. Türkiye
15.2.1.4. Rest of Middle East and Africa
15.2.2. By Flute Type
15.2.3. By Board Type
15.2.4. By End Use
15.3. Market Attractiveness Analysis
15.3.1. By Country
15.3.2. By Flute Type
15.3.3. By Board Type
15.3.4. By End Use
15.4. Key Takeaways
16. Key Countries Market Analysis
16.1. USA
16.1.1. Pricing Analysis
16.1.2. Market Share Analysis, 2022
16.1.2.1. By Flute Type
16.1.2.2. By Board Type
16.1.2.3. By End Use
16.2. Canada
16.2.1. Pricing Analysis
16.2.2. Market Share Analysis, 2022
16.2.2.1. By Flute Type
16.2.2.2. By Board Type
16.2.2.3. By End Use
16.3. Brazil
16.3.1. Pricing Analysis
16.3.2. Market Share Analysis, 2022
16.3.2.1. By Flute Type
16.3.2.2. By Board Type
16.3.2.3. By End Use
16.4. Mexico
16.4.1. Pricing Analysis
16.4.2. Market Share Analysis, 2022
16.4.2.1. By Flute Type
16.4.2.2. By Board Type
16.4.2.3. By End Use
16.5. Germany
16.5.1. Pricing Analysis
16.5.2. Market Share Analysis, 2022
16.5.2.1. By Flute Type
16.5.2.2. By Board Type
16.5.2.3. By End Use
16.6. Italy
16.6.1. Pricing Analysis
16.6.2. Market Share Analysis, 2022
16.6.2.1. By Flute Type
16.6.2.2. By Board Type
16.6.2.3. By End Use
16.7. France
16.7.1. Pricing Analysis
16.7.2. Market Share Analysis, 2022
16.7.2.1. By Flute Type
16.7.2.2. By Board Type
16.7.2.3. By End Use
16.8. UK
16.8.1. Pricing Analysis
16.8.2. Market Share Analysis, 2022
16.8.2.1. By Flute Type
16.8.2.2. By Board Type
16.8.2.3. By End Use
16.9. Spain
16.9.1. Pricing Analysis
16.9.2. Market Share Analysis, 2022
16.9.2.1. By Flute Type
16.9.2.2. By Board Type
16.9.2.3. By End Use
16.10. BENELUX
16.10.1. Pricing Analysis
16.10.2. Market Share Analysis, 2022
16.10.2.1. By Flute Type
16.10.2.2. By Board Type
16.10.2.3. By End Use
16.11. Russia
16.11.1. Pricing Analysis
16.11.2. Market Share Analysis, 2022
16.11.2.1. By Flute Type
16.11.2.2. By Board Type
16.11.2.3. By End Use
16.12. China
16.12.1. Pricing Analysis
16.12.2. Market Share Analysis, 2022
16.12.2.1. By Flute Type
16.12.2.2. By Board Type
16.12.2.3. By End Use
16.13. Japan
16.13.1. Pricing Analysis
16.13.2. Market Share Analysis, 2022
16.13.2.1. By Flute Type
16.13.2.2. By Board Type
16.13.2.3. By End Use
16.14. South Korea
16.14.1. Pricing Analysis
16.14.2. Market Share Analysis, 2022
16.14.2.1. By Flute Type
16.14.2.2. By Board Type
16.14.2.3. By End Use
16.15. Malaysia
16.15.1. Pricing Analysis
16.15.2. Market Share Analysis, 2022
16.15.2.1. By Flute Type
16.15.2.2. By Board Type
16.15.2.3. By End Use
16.16. Thailand
16.16.1. Pricing Analysis
16.16.2. Market Share Analysis, 2022
16.16.2.1. By Flute Type
16.16.2.2. By Board Type
16.16.2.3. By End Use
16.17. India
16.17.1. Pricing Analysis
16.17.2. Market Share Analysis, 2022
16.17.2.1. By Flute Type
16.17.2.2. By Board Type
16.17.2.3. By End Use
16.18. Australia
16.18.1. Pricing Analysis
16.18.2. Market Share Analysis, 2022
16.18.2.1. By Flute Type
16.18.2.2. By Board Type
16.18.2.3. By End Use
16.19. New Zealand
16.19.1. Pricing Analysis
16.19.2. Market Share Analysis, 2022
16.19.2.1. By Flute Type
16.19.2.2. By Board Type
16.19.2.3. By End Use
16.20. GCC Countries
16.20.1. Pricing Analysis
16.20.2. Market Share Analysis, 2022
16.20.2.1. By Flute Type
16.20.2.2. By Board Type
16.20.2.3. By End Use
16.21. South Africa
16.21.1. Pricing Analysis
16.21.2. Market Share Analysis, 2022
16.21.2.1. By Flute Type
16.21.2.2. By Board Type
16.21.2.3. By End Use
16.22. Türkiye
16.22.1. Pricing Analysis
16.22.2. Market Share Analysis, 2022
16.22.2.1. By Flute Type
16.22.2.2. By Board Type
16.22.2.3. By End Use
17. Market Structure Analysis
17.1. Competition Dashboard
17.2. Competition Benchmarking
17.3. Market Share Analysis of Top Players
17.3.1. By Regional
17.3.2. By Flute Type
17.3.3. By Board Type
17.3.4. By End Use
18. Competition Analysis
18.1. Competition Deep Dive
18.1.1. International Paper
18.1.1.1. Overview
18.1.1.2. Product Portfolio
18.1.1.3. Profitability by Market Segments
18.1.1.4. Sales Footprint
18.1.1.5. Strategy Overview
18.1.1.5.1. Marketing Strategy
18.1.1.5.2. Product Strategy
18.1.1.5.3. Channel Strategy
18.1.2. Georgia-Pacific
18.1.2.1. Overview
18.1.2.2. Product Portfolio
18.1.2.3. Profitability by Market Segments
18.1.2.4. Sales Footprint
18.1.2.5. Strategy Overview
18.1.2.5.1. Marketing Strategy
18.1.2.5.2. Product Strategy
18.1.2.5.3. Channel Strategy
18.1.3. WestRock Company
18.1.3.1. Overview
18.1.3.2. Product Portfolio
18.1.3.3. Profitability by Market Segments
18.1.3.4. Sales Footprint
18.1.3.5. Strategy Overview
18.1.3.5.1. Marketing Strategy
18.1.3.5.2. Product Strategy
18.1.3.5.3. Channel Strategy
18.1.4. Packaging Corporation of America
18.1.4.1. Overview
18.1.4.2. Product Portfolio
18.1.4.3. Profitability by Market Segments
18.1.4.4. Sales Footprint
18.1.4.5. Strategy Overview
18.1.4.5.1. Marketing Strategy
18.1.4.5.2. Product Strategy
18.1.4.5.3. Channel Strategy
18.1.5. Stora Enso
18.1.5.1. Overview
18.1.5.2. Product Portfolio
18.1.5.3. Profitability by Market Segments
18.1.5.4. Sales Footprint
18.1.5.5. Strategy Overview
18.1.5.5.1. Marketing Strategy
18.1.5.5.2. Product Strategy
18.1.5.5.3. Channel Strategy
18.1.6. Oji Holdings Corporation
18.1.6.1. Overview
18.1.6.2. Product Portfolio
18.1.6.3. Profitability by Market Segments
18.1.6.4. Sales Footprint
18.1.6.5. Strategy Overview
18.1.6.5.1. Marketing Strategy
18.1.6.5.2. Product Strategy
18.1.6.5.3. Channel Strategy
18.1.7. Smurfit Kappa
18.1.7.1. Overview
18.1.7.2. Product Portfolio
18.1.7.3. Profitability by Market Segments
18.1.7.4. Sales Footprint
18.1.7.5. Strategy Overview
18.1.7.5.1. Marketing Strategy
18.1.7.5.2. Product Strategy
18.1.7.5.3. Channel Strategy
18.1.8. Port Townsend Paper Company
18.1.8.1. Overview
18.1.8.2. Product Portfolio
18.1.8.3. Profitability by Market Segments
18.1.8.4. Sales Footprint
18.1.8.5. Strategy Overview
18.1.8.5.1. Marketing Strategy
18.1.8.5.2. Product Strategy
18.1.8.5.3. Channel Strategy
18.1.9. Mondi
18.1.9.1. Overview
18.1.9.2. Product Portfolio
18.1.9.3. Profitability by Market Segments
18.1.9.4. Sales Footprint
18.1.9.5. Strategy Overview
18.1.9.5.1. Marketing Strategy
18.1.9.5.2. Product Strategy
18.1.9.5.3. Channel Strategy
18.1.10. DS Smith
18.1.10.1. Overview
18.1.10.2. Product Portfolio
18.1.10.3. Profitability by Market Segments
18.1.10.4. Sales Footprint
18.1.10.5. Strategy Overview
18.1.10.5.1. Marketing Strategy
18.1.10.5.2. Product Strategy
18.1.10.5.3. Channel Strategy
19. Assumptions & Acronyms Used
20. Research Methodology
Let us know your requirement to get
100% FREE customization
List of Tables
Table 1: Global Market Value (US$ Million) Forecast by Region, 2018 to 2033
Table 2: Global Market Volume (Tons) Forecast by Region, 2018 to 2033
Table 3: Global Market Value (US$ Million) Forecast by Flute Type, 2018 to 2033
Table 4: Global Market Volume (Tons) Forecast by Flute Type, 2018 to 2033
Table 5: Global Market Value (US$ Million) Forecast by Board Type, 2018 to 2033
Table 6: Global Market Volume (Tons) Forecast by Board Type, 2018 to 2033
Table 7: Global Market Value (US$ Million) Forecast by End Use, 2018 to 2033
Table 8: Global Market Volume (Tons) Forecast by End Use, 2018 to 2033
Table 9: North America Market Value (US$ Million) Forecast by Country, 2018 to 2033
Table 10: North America Market Volume (Tons) Forecast by Country, 2018 to 2033
Table 11: North America Market Value (US$ Million) Forecast by Flute Type, 2018 to 2033
Table 12: North America Market Volume (Tons) Forecast by Flute Type, 2018 to 2033
Table 13: North America Market Value (US$ Million) Forecast by Board Type, 2018 to 2033
Table 14: North America Market Volume (Tons) Forecast by Board Type, 2018 to 2033
Table 15: North America Market Value (US$ Million) Forecast by End Use, 2018 to 2033
Table 16: North America Market Volume (Tons) Forecast by End Use, 2018 to 2033
Table 17: Latin America Market Value (US$ Million) Forecast by Country, 2018 to 2033
Table 18: Latin America Market Volume (Tons) Forecast by Country, 2018 to 2033
Table 19: Latin America Market Value (US$ Million) Forecast by Flute Type, 2018 to 2033
Table 20: Latin America Market Volume (Tons) Forecast by Flute Type, 2018 to 2033
Table 21: Latin America Market Value (US$ Million) Forecast by Board Type, 2018 to 2033
Table 22: Latin America Market Volume (Tons) Forecast by Board Type, 2018 to 2033
Table 23: Latin America Market Value (US$ Million) Forecast by End Use, 2018 to 2033
Table 24: Latin America Market Volume (Tons) Forecast by End Use, 2018 to 2033
Table 25: Europe Market Value (US$ Million) Forecast by Country, 2018 to 2033
Table 26: Europe Market Volume (Tons) Forecast by Country, 2018 to 2033
Table 27: Europe Market Value (US$ Million) Forecast by Flute Type, 2018 to 2033
Table 28: Europe Market Volume (Tons) Forecast by Flute Type, 2018 to 2033
Table 29: Europe Market Value (US$ Million) Forecast by Board Type, 2018 to 2033
Table 30: Europe Market Volume (Tons) Forecast by Board Type, 2018 to 2033
Table 31: Europe Market Value (US$ Million) Forecast by End Use, 2018 to 2033
Table 32: Europe Market Volume (Tons) Forecast by End Use, 2018 to 2033
Table 33: East Asia Market Value (US$ Million) Forecast by Country, 2018 to 2033
Table 34: East Asia Market Volume (Tons) Forecast by Country, 2018 to 2033
Table 35: East Asia Market Value (US$ Million) Forecast by Flute Type, 2018 to 2033
Table 36: East Asia Market Volume (Tons) Forecast by Flute Type, 2018 to 2033
Table 37: East Asia Market Value (US$ Million) Forecast by Board Type, 2018 to 2033
Table 38: East Asia Market Volume (Tons) Forecast by Board Type, 2018 to 2033
Table 39: East Asia Market Value (US$ Million) Forecast by End Use, 2018 to 2033
Table 40: East Asia Market Volume (Tons) Forecast by End Use, 2018 to 2033
Table 41: South Asia Market Value (US$ Million) Forecast by Country, 2018 to 2033
Table 42: South Asia Market Volume (Tons) Forecast by Country, 2018 to 2033
Table 43: South Asia Market Value (US$ Million) Forecast by Flute Type, 2018 to 2033
Table 44: South Asia Market Volume (Tons) Forecast by Flute Type, 2018 to 2033
Table 45: South Asia Market Value (US$ Million) Forecast by Board Type, 2018 to 2033
Table 46: South Asia Market Volume (Tons) Forecast by Board Type, 2018 to 2033
Table 47: South Asia Market Value (US$ Million) Forecast by End Use, 2018 to 2033
Table 48: South Asia Market Volume (Tons) Forecast by End Use, 2018 to 2033
Table 49: Oceania Market Value (US$ Million) Forecast by Country, 2018 to 2033
Table 50: Oceania Market Volume (Tons) Forecast by Country, 2018 to 2033
Table 51: Oceania Market Value (US$ Million) Forecast by Flute Type, 2018 to 2033
Table 52: Oceania Market Volume (Tons) Forecast by Flute Type, 2018 to 2033
Table 53: Oceania Market Value (US$ Million) Forecast by Board Type, 2018 to 2033
Table 54: Oceania Market Volume (Tons) Forecast by Board Type, 2018 to 2033
Table 55: Oceania Market Value (US$ Million) Forecast by End Use, 2018 to 2033
Table 56: Oceania Market Volume (Tons) Forecast by End Use, 2018 to 2033
Table 57: Middle East and Africa Market Value (US$ Million) Forecast by Country, 2018 to 2033
Table 58: Middle East and Africa Market Volume (Tons) Forecast by Country, 2018 to 2033
Table 59: Middle East and Africa Market Value (US$ Million) Forecast by Flute Type, 2018 to 2033
Table 60: Middle East and Africa Market Volume (Tons) Forecast by Flute Type, 2018 to 2033
Table 61: Middle East and Africa Market Value (US$ Million) Forecast by Board Type, 2018 to 2033
Table 62: Middle East and Africa Market Volume (Tons) Forecast by Board Type, 2018 to 2033
Table 63: Middle East and Africa Market Value (US$ Million) Forecast by End Use, 2018 to 2033
Table 64: Middle East and Africa Market Volume (Tons) Forecast by End Use, 2018 to 2033
Find your sweet spots for generating winning opportunities in this market.
Talk to AnalystList of Charts
Figure 1: Global Market Value (US$ Million) by Flute Type, 2023 to 2033
Figure 2: Global Market Value (US$ Million) by Board Type, 2023 to 2033
Figure 3: Global Market Value (US$ Million) by End Use, 2023 to 2033
Figure 4: Global Market Value (US$ Million) by Region, 2023 to 2033
Figure 5: Global Market Value (US$ Million) Analysis by Region, 2018 to 2033
Figure 6: Global Market Volume (Tons) Analysis by Region, 2018 to 2033
Figure 7: Global Market Value Share (%) and BPS Analysis by Region, 2023 to 2033
Figure 8: Global Market Y-o-Y Growth (%) Projections by Region, 2023 to 2033
Figure 9: Global Market Value (US$ Million) Analysis by Flute Type, 2018 to 2033
Figure 10: Global Market Volume (Tons) Analysis by Flute Type, 2018 to 2033
Figure 11: Global Market Value Share (%) and BPS Analysis by Flute Type, 2023 to 2033
Figure 12: Global Market Y-o-Y Growth (%) Projections by Flute Type, 2023 to 2033
Figure 13: Global Market Value (US$ Million) Analysis by Board Type, 2018 to 2033
Figure 14: Global Market Volume (Tons) Analysis by Board Type, 2018 to 2033
Figure 15: Global Market Value Share (%) and BPS Analysis by Board Type, 2023 to 2033
Figure 16: Global Market Y-o-Y Growth (%) Projections by Board Type, 2023 to 2033
Figure 17: Global Market Value (US$ Million) Analysis by End Use, 2018 to 2033
Figure 18: Global Market Volume (Tons) Analysis by End Use, 2018 to 2033
Figure 19: Global Market Value Share (%) and BPS Analysis by End Use, 2023 to 2033
Figure 20: Global Market Y-o-Y Growth (%) Projections by End Use, 2023 to 2033
Figure 21: Global Market Attractiveness by Flute Type, 2023 to 2033
Figure 22: Global Market Attractiveness by Board Type, 2023 to 2033
Figure 23: Global Market Attractiveness by End Use, 2023 to 2033
Figure 24: Global Market Attractiveness by Region, 2023 to 2033
Figure 25: North America Market Value (US$ Million) by Flute Type, 2023 to 2033
Figure 26: North America Market Value (US$ Million) by Board Type, 2023 to 2033
Figure 27: North America Market Value (US$ Million) by End Use, 2023 to 2033
Figure 28: North America Market Value (US$ Million) by Country, 2023 to 2033
Figure 29: North America Market Value (US$ Million) Analysis by Country, 2018 to 2033
Figure 30: North America Market Volume (Tons) Analysis by Country, 2018 to 2033
Figure 31: North America Market Value Share (%) and BPS Analysis by Country, 2023 to 2033
Figure 32: North America Market Y-o-Y Growth (%) Projections by Country, 2023 to 2033
Figure 33: North America Market Value (US$ Million) Analysis by Flute Type, 2018 to 2033
Figure 34: North America Market Volume (Tons) Analysis by Flute Type, 2018 to 2033
Figure 35: North America Market Value Share (%) and BPS Analysis by Flute Type, 2023 to 2033
Figure 36: North America Market Y-o-Y Growth (%) Projections by Flute Type, 2023 to 2033
Figure 37: North America Market Value (US$ Million) Analysis by Board Type, 2018 to 2033
Figure 38: North America Market Volume (Tons) Analysis by Board Type, 2018 to 2033
Figure 39: North America Market Value Share (%) and BPS Analysis by Board Type, 2023 to 2033
Figure 40: North America Market Y-o-Y Growth (%) Projections by Board Type, 2023 to 2033
Figure 41: North America Market Value (US$ Million) Analysis by End Use, 2018 to 2033
Figure 42: North America Market Volume (Tons) Analysis by End Use, 2018 to 2033
Figure 43: North America Market Value Share (%) and BPS Analysis by End Use, 2023 to 2033
Figure 44: North America Market Y-o-Y Growth (%) Projections by End Use, 2023 to 2033
Figure 45: North America Market Attractiveness by Flute Type, 2023 to 2033
Figure 46: North America Market Attractiveness by Board Type, 2023 to 2033
Figure 47: North America Market Attractiveness by End Use, 2023 to 2033
Figure 48: North America Market Attractiveness by Country, 2023 to 2033
Figure 49: Latin America Market Value (US$ Million) by Flute Type, 2023 to 2033
Figure 50: Latin America Market Value (US$ Million) by Board Type, 2023 to 2033
Figure 51: Latin America Market Value (US$ Million) by End Use, 2023 to 2033
Figure 52: Latin America Market Value (US$ Million) by Country, 2023 to 2033
Figure 53: Latin America Market Value (US$ Million) Analysis by Country, 2018 to 2033
Figure 54: Latin America Market Volume (Tons) Analysis by Country, 2018 to 2033
Figure 55: Latin America Market Value Share (%) and BPS Analysis by Country, 2023 to 2033
Figure 56: Latin America Market Y-o-Y Growth (%) Projections by Country, 2023 to 2033
Figure 57: Latin America Market Value (US$ Million) Analysis by Flute Type, 2018 to 2033
Figure 58: Latin America Market Volume (Tons) Analysis by Flute Type, 2018 to 2033
Figure 59: Latin America Market Value Share (%) and BPS Analysis by Flute Type, 2023 to 2033
Figure 60: Latin America Market Y-o-Y Growth (%) Projections by Flute Type, 2023 to 2033
Figure 61: Latin America Market Value (US$ Million) Analysis by Board Type, 2018 to 2033
Figure 62: Latin America Market Volume (Tons) Analysis by Board Type, 2018 to 2033
Figure 63: Latin America Market Value Share (%) and BPS Analysis by Board Type, 2023 to 2033
Figure 64: Latin America Market Y-o-Y Growth (%) Projections by Board Type, 2023 to 2033
Figure 65: Latin America Market Value (US$ Million) Analysis by End Use, 2018 to 2033
Figure 66: Latin America Market Volume (Tons) Analysis by End Use, 2018 to 2033
Figure 67: Latin America Market Value Share (%) and BPS Analysis by End Use, 2023 to 2033
Figure 68: Latin America Market Y-o-Y Growth (%) Projections by End Use, 2023 to 2033
Figure 69: Latin America Market Attractiveness by Flute Type, 2023 to 2033
Figure 70: Latin America Market Attractiveness by Board Type, 2023 to 2033
Figure 71: Latin America Market Attractiveness by End Use, 2023 to 2033
Figure 72: Latin America Market Attractiveness by Country, 2023 to 2033
Figure 73: Europe Market Value (US$ Million) by Flute Type, 2023 to 2033
Figure 74: Europe Market Value (US$ Million) by Board Type, 2023 to 2033
Figure 75: Europe Market Value (US$ Million) by End Use, 2023 to 2033
Figure 76: Europe Market Value (US$ Million) by Country, 2023 to 2033
Figure 77: Europe Market Value (US$ Million) Analysis by Country, 2018 to 2033
Figure 78: Europe Market Volume (Tons) Analysis by Country, 2018 to 2033
Figure 79: Europe Market Value Share (%) and BPS Analysis by Country, 2023 to 2033
Figure 80: Europe Market Y-o-Y Growth (%) Projections by Country, 2023 to 2033
Figure 81: Europe Market Value (US$ Million) Analysis by Flute Type, 2018 to 2033
Figure 82: Europe Market Volume (Tons) Analysis by Flute Type, 2018 to 2033
Figure 83: Europe Market Value Share (%) and BPS Analysis by Flute Type, 2023 to 2033
Figure 84: Europe Market Y-o-Y Growth (%) Projections by Flute Type, 2023 to 2033
Figure 85: Europe Market Value (US$ Million) Analysis by Board Type, 2018 to 2033
Figure 86: Europe Market Volume (Tons) Analysis by Board Type, 2018 to 2033
Figure 87: Europe Market Value Share (%) and BPS Analysis by Board Type, 2023 to 2033
Figure 88: Europe Market Y-o-Y Growth (%) Projections by Board Type, 2023 to 2033
Figure 89: Europe Market Value (US$ Million) Analysis by End Use, 2018 to 2033
Figure 90: Europe Market Volume (Tons) Analysis by End Use, 2018 to 2033
Figure 91: Europe Market Value Share (%) and BPS Analysis by End Use, 2023 to 2033
Figure 92: Europe Market Y-o-Y Growth (%) Projections by End Use, 2023 to 2033
Figure 93: Europe Market Attractiveness by Flute Type, 2023 to 2033
Figure 94: Europe Market Attractiveness by Board Type, 2023 to 2033
Figure 95: Europe Market Attractiveness by End Use, 2023 to 2033
Figure 96: Europe Market Attractiveness by Country, 2023 to 2033
Figure 97: East Asia Market Value (US$ Million) by Flute Type, 2023 to 2033
Figure 98: East Asia Market Value (US$ Million) by Board Type, 2023 to 2033
Figure 99: East Asia Market Value (US$ Million) by End Use, 2023 to 2033
Figure 100: East Asia Market Value (US$ Million) by Country, 2023 to 2033
Figure 101: East Asia Market Value (US$ Million) Analysis by Country, 2018 to 2033
Figure 102: East Asia Market Volume (Tons) Analysis by Country, 2018 to 2033
Figure 103: East Asia Market Value Share (%) and BPS Analysis by Country, 2023 to 2033
Figure 104: East Asia Market Y-o-Y Growth (%) Projections by Country, 2023 to 2033
Figure 105: East Asia Market Value (US$ Million) Analysis by Flute Type, 2018 to 2033
Figure 106: East Asia Market Volume (Tons) Analysis by Flute Type, 2018 to 2033
Figure 107: East Asia Market Value Share (%) and BPS Analysis by Flute Type, 2023 to 2033
Figure 108: East Asia Market Y-o-Y Growth (%) Projections by Flute Type, 2023 to 2033
Figure 109: East Asia Market Value (US$ Million) Analysis by Board Type, 2018 to 2033
Figure 110: East Asia Market Volume (Tons) Analysis by Board Type, 2018 to 2033
Figure 111: East Asia Market Value Share (%) and BPS Analysis by Board Type, 2023 to 2033
Figure 112: East Asia Market Y-o-Y Growth (%) Projections by Board Type, 2023 to 2033
Figure 113: East Asia Market Value (US$ Million) Analysis by End Use, 2018 to 2033
Figure 114: East Asia Market Volume (Tons) Analysis by End Use, 2018 to 2033
Figure 115: East Asia Market Value Share (%) and BPS Analysis by End Use, 2023 to 2033
Figure 116: East Asia Market Y-o-Y Growth (%) Projections by End Use, 2023 to 2033
Figure 117: East Asia Market Attractiveness by Flute Type, 2023 to 2033
Figure 118: East Asia Market Attractiveness by Board Type, 2023 to 2033
Figure 119: East Asia Market Attractiveness by End Use, 2023 to 2033
Figure 120: East Asia Market Attractiveness by Country, 2023 to 2033
Figure 121: South Asia Market Value (US$ Million) by Flute Type, 2023 to 2033
Figure 122: South Asia Market Value (US$ Million) by Board Type, 2023 to 2033
Figure 123: South Asia Market Value (US$ Million) by End Use, 2023 to 2033
Figure 124: South Asia Market Value (US$ Million) by Country, 2023 to 2033
Figure 125: South Asia Market Value (US$ Million) Analysis by Country, 2018 to 2033
Figure 126: South Asia Market Volume (Tons) Analysis by Country, 2018 to 2033
Figure 127: South Asia Market Value Share (%) and BPS Analysis by Country, 2023 to 2033
Figure 128: South Asia Market Y-o-Y Growth (%) Projections by Country, 2023 to 2033
Figure 129: South Asia Market Value (US$ Million) Analysis by Flute Type, 2018 to 2033
Figure 130: South Asia Market Volume (Tons) Analysis by Flute Type, 2018 to 2033
Figure 131: South Asia Market Value Share (%) and BPS Analysis by Flute Type, 2023 to 2033
Figure 132: South Asia Market Y-o-Y Growth (%) Projections by Flute Type, 2023 to 2033
Figure 133: South Asia Market Value (US$ Million) Analysis by Board Type, 2018 to 2033
Figure 134: South Asia Market Volume (Tons) Analysis by Board Type, 2018 to 2033
Figure 135: South Asia Market Value Share (%) and BPS Analysis by Board Type, 2023 to 2033
Figure 136: South Asia Market Y-o-Y Growth (%) Projections by Board Type, 2023 to 2033
Figure 137: South Asia Market Value (US$ Million) Analysis by End Use, 2018 to 2033
Figure 138: South Asia Market Volume (Tons) Analysis by End Use, 2018 to 2033
Figure 139: South Asia Market Value Share (%) and BPS Analysis by End Use, 2023 to 2033
Figure 140: South Asia Market Y-o-Y Growth (%) Projections by End Use, 2023 to 2033
Figure 141: South Asia Market Attractiveness by Flute Type, 2023 to 2033
Figure 142: South Asia Market Attractiveness by Board Type, 2023 to 2033
Figure 143: South Asia Market Attractiveness by End Use, 2023 to 2033
Figure 144: South Asia Market Attractiveness by Country, 2023 to 2033
Figure 145: Oceania Market Value (US$ Million) by Flute Type, 2023 to 2033
Figure 146: Oceania Market Value (US$ Million) by Board Type, 2023 to 2033
Figure 147: Oceania Market Value (US$ Million) by End Use, 2023 to 2033
Figure 148: Oceania Market Value (US$ Million) by Country, 2023 to 2033
Figure 149: Oceania Market Value (US$ Million) Analysis by Country, 2018 to 2033
Figure 150: Oceania Market Volume (Tons) Analysis by Country, 2018 to 2033
Figure 151: Oceania Market Value Share (%) and BPS Analysis by Country, 2023 to 2033
Figure 152: Oceania Market Y-o-Y Growth (%) Projections by Country, 2023 to 2033
Figure 153: Oceania Market Value (US$ Million) Analysis by Flute Type, 2018 to 2033
Figure 154: Oceania Market Volume (Tons) Analysis by Flute Type, 2018 to 2033
Figure 155: Oceania Market Value Share (%) and BPS Analysis by Flute Type, 2023 to 2033
Figure 156: Oceania Market Y-o-Y Growth (%) Projections by Flute Type, 2023 to 2033
Figure 157: Oceania Market Value (US$ Million) Analysis by Board Type, 2018 to 2033
Figure 158: Oceania Market Volume (Tons) Analysis by Board Type, 2018 to 2033
Figure 159: Oceania Market Value Share (%) and BPS Analysis by Board Type, 2023 to 2033
Figure 160: Oceania Market Y-o-Y Growth (%) Projections by Board Type, 2023 to 2033
Figure 161: Oceania Market Value (US$ Million) Analysis by End Use, 2018 to 2033
Figure 162: Oceania Market Volume (Tons) Analysis by End Use, 2018 to 2033
Figure 163: Oceania Market Value Share (%) and BPS Analysis by End Use, 2023 to 2033
Figure 164: Oceania Market Y-o-Y Growth (%) Projections by End Use, 2023 to 2033
Figure 165: Oceania Market Attractiveness by Flute Type, 2023 to 2033
Figure 166: Oceania Market Attractiveness by Board Type, 2023 to 2033
Figure 167: Oceania Market Attractiveness by End Use, 2023 to 2033
Figure 168: Oceania Market Attractiveness by Country, 2023 to 2033
Figure 169: Middle East and Africa Market Value (US$ Million) by Flute Type, 2023 to 2033
Figure 170: Middle East and Africa Market Value (US$ Million) by Board Type, 2023 to 2033
Figure 171: Middle East and Africa Market Value (US$ Million) by End Use, 2023 to 2033
Figure 172: Middle East and Africa Market Value (US$ Million) by Country, 2023 to 2033
Figure 173: Middle East and Africa Market Value (US$ Million) Analysis by Country, 2018 to 2033
Figure 174: Middle East and Africa Market Volume (Tons) Analysis by Country, 2018 to 2033
Figure 175: Middle East and Africa Market Value Share (%) and BPS Analysis by Country, 2023 to 2033
Figure 176: Middle East and Africa Market Y-o-Y Growth (%) Projections by Country, 2023 to 2033
Figure 177: Middle East and Africa Market Value (US$ Million) Analysis by Flute Type, 2018 to 2033
Figure 178: Middle East and Africa Market Volume (Tons) Analysis by Flute Type, 2018 to 2033
Figure 179: Middle East and Africa Market Value Share (%) and BPS Analysis by Flute Type, 2023 to 2033
Figure 180: Middle East and Africa Market Y-o-Y Growth (%) Projections by Flute Type, 2023 to 2033
Figure 181: Middle East and Africa Market Value (US$ Million) Analysis by Board Type, 2018 to 2033
Figure 182: Middle East and Africa Market Volume (Tons) Analysis by Board Type, 2018 to 2033
Figure 183: Middle East and Africa Market Value Share (%) and BPS Analysis by Board Type, 2023 to 2033
Figure 184: Middle East and Africa Market Y-o-Y Growth (%) Projections by Board Type, 2023 to 2033
Figure 185: Middle East and Africa Market Value (US$ Million) Analysis by End Use, 2018 to 2033
Figure 186: Middle East and Africa Market Volume (Tons) Analysis by End Use, 2018 to 2033
Figure 187: Middle East and Africa Market Value Share (%) and BPS Analysis by End Use, 2023 to 2033
Figure 188: Middle East and Africa Market Y-o-Y Growth (%) Projections by End Use, 2023 to 2033
Figure 189: Middle East and Africa Market Attractiveness by Flute Type, 2023 to 2033
Figure 190: Middle East and Africa Market Attractiveness by Board Type, 2023 to 2033
Figure 191: Middle East and Africa Market Attractiveness by End Use, 2023 to 2033
Figure 192: Middle East and Africa Market Attractiveness by Country, 2023 to 2033
Need specific information?
Request CustomizationExplore Packaging Insights
View Reports