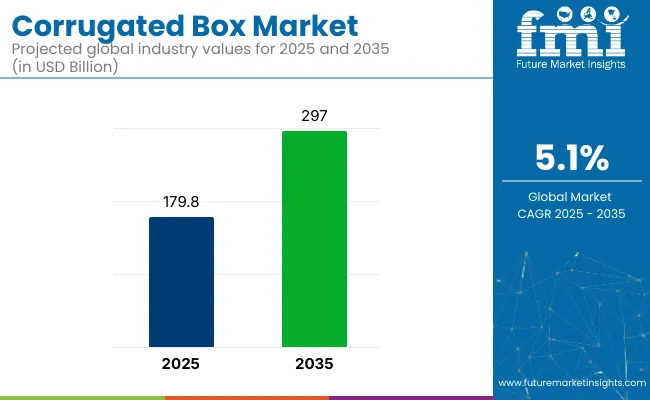
The global corrugated box market is projected to grow from USD 179.8 billion in 2025 to approximately USD 297.0 billion by 2035, registering a CAGR of 5.1% during the forecast period. This growth is primarily attributed to the increasing demand for sustainable and recyclable packaging solutions across various industries, including e-commerce, food and beverages, electronics, and pharmaceuticals.

| Metric | Value |
|---|---|
| Market Size in 2025 | USD 179.8 billion |
| Projected Market Size in 2035 | USD 297.0 billion |
| CAGR (2025 to 2035) | 5.1% |
Corrugated boxes are favored for their durability, lightweight nature, and cost-effectiveness, making them ideal for shipping and storage needs. The market's expansion is further driven by advancements in digital printing technologies, enabling enhanced customization and brand engagement opportunities.
In July 2024 Smurfit Westrock, operating in 40 countries and tapping into the expertise of over 100,000 people, has a unique and unrivalled ability to provide its customers with the most diverse, innovative and sustainable range of renewable and recyclable packaging solutions.
“Combining Smurfit Kappa and WestRock creates a world-leading sustainable packaging player, bringing together a tremendous depth of experience and expertise from both companies,” said Tony Smurfit, Smurfit Westrock Chief Executive Officer. “We believe that this combination has created the ‘go-to’ leader and partner of choice in sustainable packaging. I’m proud to be chosen to lead this great team of people.”
“The shareholders of both Smurfit Kappa and WestRock have overwhelmingly supported our combination. Smurfit Westrock has a unique geographic footprint and through our industry-leading applications, an unparalleled ability to provide value for our customers,” added Ken Bowles, Smurfit Westrock Chief Financial Officer.
Recent innovations in the corrugated box market have centered around enhancing sustainability, functionality, and adaptability to diverse applications. Manufacturers are increasingly adopting biodegradable and recyclable materials, such as recycled corrugates, to produce eco-friendly boxes that align with stringent environmental regulations and cater to the growing consumer demand for sustainable packaging solutions.
Advancements in digital printing technologies have led to the development of boxes with improved moisture resistance, UV protection, and tamper-evident features, ensuring better performance in various environmental conditions. Additionally, the integration of smart technologies, including QR codes and temperature sensors, is enabling better inventory management, product tracking, and real-time monitoring of environmental conditions, aligning with the growing trend of smart packaging and logistics.
The corrugated box market is expected to witness significant growth in emerging economies, particularly in the Asia-Pacific region, driven by rapid industrialization, urbanization, and infrastructural development. Countries like China, India, and Indonesia are experiencing a surge in demand for durable and sustainable materials in construction, agriculture, and packaging sectors.
The expansion of the e-commerce industry and the increasing need for efficient logistics and protective packaging solutions further propel the market's growth in these regions.
Manufacturers are anticipated to focus on developing cost-effective, sustainable, and customizable corrugated box solutions to cater to diverse industry needs and comply with evolving regulatory standards. Strategic collaborations, technological advancements, and investments in local production facilities are likely to play a crucial role in capturing market share and driving growth in these regions.
The market has been segmented based on product type, material, printing technology, end use, and region. By product type, slotted boxes, telescope boxes, folder boxes, and rigid boxes are designed to meet various shipping, retail, and bulk handling needs, balancing protection and cost-efficiency.
Material segmentation includes linerboard, medium, and other paper-based substrates providing strength, cushioning, and customization flexibility based on load and handling requirements. Printing technologies such as flexographic printing, digital printing, lithographic printing, and others support branding, traceability, and information display, increasingly demanded in retail-ready and e-commerce packaging.
End-use segmentation comprises food & beverage, industrial, home & personal care, textile goods, glassware & ceramics, e-commerce & parcel delivery, agricultural produce, and others representing broad cross-industry adoption of corrugated solutions. Regional segmentation spans North America, Europe, Latin America, Asia Pacific, and the Middle East and Africa, reflecting regional differences in packaging automation, environmental regulations, and consumer packaging expectations.

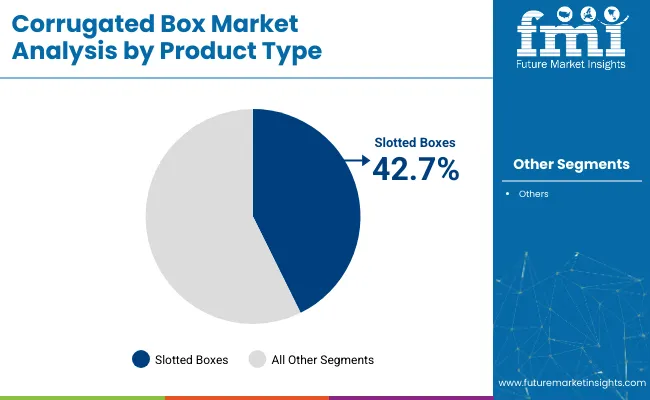
The slotted boxes segment is projected to capture the highest share of 42.7% in the corrugated box market by 2025, attributed to its cost-efficiency, adaptability, and widespread application across multiple industries. Slotted boxes particularly Regular Slotted Containers (RSCs) are the most commonly used box style globally due to their efficient manufacturing process, minimal material waste, and optimal strength-to-weight ratio.
These boxes are typically die-cut from a single sheet of corrugated board and folded into shape, offering strong edge-crush resistance and stacking capability, which makes them ideal for logistics, bulk storage, and retail-ready packaging. Their versatility spans across food and beverage shipments, industrial goods, personal care products, and e-commerce parcels.
The ease of flat shipping, rapid assembly, and compatibility with tape or glue-based sealing methods further increase their appeal in automated packing lines. Additionally, slotted boxes are highly customizable in terms of dimensions, flute profiles, and printability making them a preferred choice for brand-specific and volume-driven packaging needs.
As global supply chains increasingly prioritize sustainable, standardized, and durable solutions for packaging optimization, slotted boxes will remain the leading product type within the corrugated box segment through the next decade.

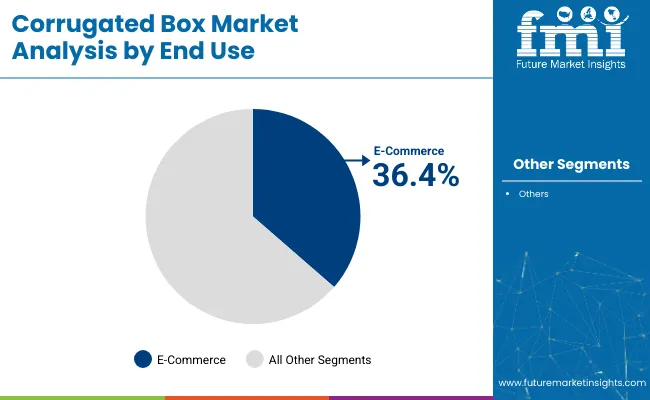
The e-commerce and parcel delivery segment is forecasted to lead the end-use category with a 36.4% share in 2025, propelled by exponential growth in online retail, Omni channel distribution, and direct-to-consumer (D2C) brands across sectors.
Corrugated boxes are essential to e-commerce logistics as they provide secure, stackable, and brandable packaging for a wide variety of SKUs from apparel and electronics to beauty and groceries. With rising consumer expectations for product protection, quick delivery, and unboxing experiences, corrugated boxes are being engineered for increased impact resistance, tear strength, and visual appeal.
Enhanced box formats featuring easy-open tabs, tamper-evident seals, and embedded return labels are tailored to address both convenience and circularity in reverse logistics. As global parcel volumes continue to grow especially across North America, Europe, and Southeast Asia the e-commerce and parcel delivery segment will continue to drive innovation and volume in the corrugated box industry, reinforcing its leadership in end-use applications.
Challenges
Fluctuating raw material costs and recyclability limitations Volatility in paper pulp prices and water-intensive production processes pose ongoing challenges. Achieving high moisture resistance while maintaining recyclability is a common packaging trade-off.
Opportunities
Smart packaging integration and digital transformation Opportunities are emerging through smart boxes with QR codes, tamper-evident designs, and RFID labeling. Custom printing, augmented reality features, and AI-assisted design tools are enabling packaging that supports both functionality and consumer engagement.

The corrugated box market in the United States has burgeoned with the phenomenal rise of e-commerce, food delivery, and retail logistics. Cost-effective, recyclable, and protective boxes have earned preference in the mass adoption by industries. USA Manufacturers use light fluting, turnkey paper liners with high-strength, and moisture-proof coatings for enhanced performance.
Such advances include smart tracking labels, QR coded authentication, and digital printing, thus enhancing supply chain traceability and brand presentation. Companies are also exploring multi-depth boxes and easy-fold formats to improve fulfillment efficiency and reduce material waste.
Temperature-sensitive corrugated packaging is being developed for pharmaceuticals and perishables. AI-driven box-sizing systems are helping warehouses reduce void fill and optimize space. Last but not least is the penchant creating demand for new and innovative designs in printed interiors of boxes for unboxing experience in consumers.
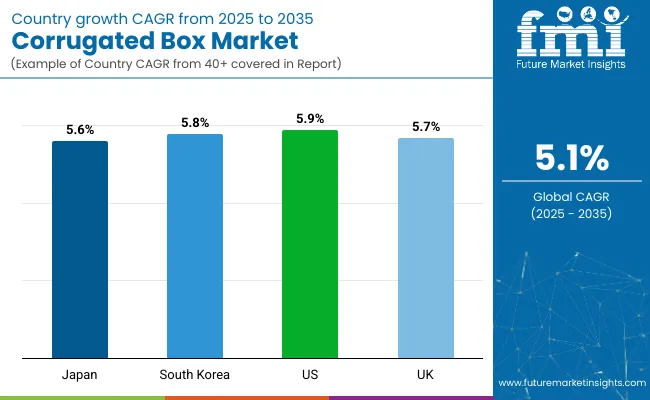
| Country | CAGR (2025 to 2035) |
|---|---|
| United States | 5.9% |
The UK corrugated box market is still on an upward path, thanks to increased consumption in sustainable retail packaging, grocery delivery, and pharmaceutical distribution. When eco-friendliness is prioritized by consumers and businesses alike, companies are going ahead to develop fully recyclable, plastic-free corrugated formats.
Manufacturers are coming up with custom-designed tear-resistant boxes featuring printed brand identification, easy-tear strips, and tamper-evident closures. Government initiatives to promote circular packaging and enact extended producer responsibility (EPR) schemes are further aiding market growth.
Evolve packaging trends have also brought about innovations in compact box designs that can be returned. Heavy-duty packaging lines are incorporating RFID tracking for accuracy in logistics. Meanwhile, anti-moisture coatings are being tested for shipping grocery and chilled goods. AI-based box assembly is being used in high-speed fulfillment operations.
| Country | CAGR (2025 to 2035) |
|---|---|
| United Kingdom | 5.7% |
The market for corrugated boxes in Japan depends on an accurate design, compact packaging, and consumer experience. An example of their specific emphasis is sustainability and aesthetics as they manufacture very lightweight but strong boxes suited for the electronics, cosmetics, and food industries. Their otherwise densely populated urban logistic demand foldable, stackable, and 0-defect packaging solutions for big products.
High-definition die-cutting and anti-humidity coatings enhance the performances of fresh produce and temperature-sensitive shipments. The Japan companies have included smart tags which could be amplified with other interesting features in unboxing. Temperature-sensitive inks are also utilized in this usage as freshness indicators. More compact designs with built-in handles improve convenience for final delivery miles. Increased precision with lower packaging waste results from modern innovations in AI-powered quality control systems.
| Country | CAGR (2025 to 2035) |
|---|---|
| Japan | 5.6% |
With K-mail commerce, exports of electronics goods, and home meal kits booming, the South Korean market for corrugated boxes is thriving. Corrugated packaging provides cushioning, excellent printing properties, and recyclability. Manufacturers are developing AI-based converting systems, biodegradable adhesives, and automated print inspection to satisfy quality and environmental requirements.
Smart box innovations include RFID labeling, temperature indicators, and modular packaging for individualized fulfillment. Eco-packaging policies promoted by the government and consumer preference against plastic packaging are fast-tracking the adoption of corrugated boxes. Antimicrobial coatings are being researched for food applications. Production of custom-sized boxes through AI is optimizing the use of raw materials. Interactive packaging embedded with AR experiences is gaining momentum in retail marketing.
| Country | CAGR (2025 to 2035) |
|---|---|
| South Korea | 5.8% |
Producers are investing in recyclable coatings, biodegradable adhesives, and AI-optimized cutting systems to drive eco-performance. Intelligent packaging elements such as track-and-trace sensors, inventory-linked codes, and real-time delivery notifications are enhancing logistics transparency.
Digital twin modeling and predictive analytics assist brands in minimizing overpacking and box size optimization. Blockchain technology is being tested to enhance packaging provenance and security. Smart inks and embedded sensors are allowing real-time temperature and freshness tracking. Augmented reality (AR) overlays are being investigated to provide interactive unpacking instructions and promotional materials.
As the world transitions towards sustainable, functional, and customer-focused packaging, corrugated boxes will continue to be the backbone of international supply chains. Ongoing innovation in materials, design, and automation will define the next generation of corrugated packaging solutions.
Corrugated Box Market Maintains Market Relevance as Global Packaging and E-Commerce Sectors Expand
Corrugated boxes remain the backbone of the packaging industry, offering durable, cost-effective, and recyclable solutions for transporting goods across sectors such as e-commerce, retail, food and beverage, manufacturing, and logistics. Their structural integrity, printability, and customizability have positioned them as a preferred packaging choice worldwide.
Rising global trade, a shift toward online shopping, and increased demand for sustainable packaging are key factors driving corrugated box adoption. Research shows that more than 75% of e-commerce shipments rely on corrugated boxes due to their lightweight nature and cushioning capabilities.
Manufacturers are enhancing box strength through multi-layered fluting, precision die-cutting, and reinforced edges while investing in water-resistant coatings and anti-theft designs. Sustainable innovations such as recycled kraft liners, soy-based inks, and mono-material packaging are gaining traction.
Corrugated boxes are widely used in automation-integrated packaging lines due to their compatibility with folding, gluing, and sealing machines. Smart packaging trends are also influencing box design, with brands adding QR codes, interactive elements, and augmented reality features for marketing and traceability.
E-Commerce and Food Sectors Drive Market Growth as Customization, Safety, and Sustainability Priorities Rise
E-commerce brands use corrugated boxes to ensure product protection during transit, reduce damage rates, and enhance the unboxing experience. These boxes also support personalized branding through printed exteriors and interiors.
In the food and beverage sector, corrugated boxes are used for secondary packaging of shelf-stable goods, beverages, and fresh produce. Coatings for moisture resistance and ventilated box formats support perishable logistics.
Retail and Manufacturing Industries Increase Corrugated Box Use as Standardization and Automation Evolve
Retailers benefit from shelf-ready corrugated boxes that double as in-store displays. Manufacturers use heavy-duty corrugated cartons to streamline palletization and warehouse storage.
Custom-fit inserts, edge protectors, and die-cut dividers are increasingly used to protect high-value industrial parts during transit. Corrugated boxes are also being adapted for automated storage and retrieval systems (ASRS) to increase picking accuracy. Foldable and reusable corrugated containers are gaining traction for reverse logistics applications.
In the manufacturing sector, color-coded corrugated bins are used for lean inventory practices and part traceability. Brands are incorporating printed assembly instructions on corrugated partitions to enhance operational efficiency. Additionally, QR-coded corrugated containers are being deployed for real-time inventory tracking and audit trail creation.
The corrugated box market is expanding globally, with key players focusing on lightweight designs, digital printing capabilities, and sustainability certifications. Automation in box manufacturing, just-in-time production, and on-demand box customization are transforming the industry. Major players are also collaborating with e-commerce and CPG brands to co-develop high-performance packaging. Advances in AI-based quality inspection are reducing waste and improving packaging precision.
Integration with smart logistics platforms is enhancing inventory tracking and delivery efficiency. Increased demand for biodegradable adhesives is reshaping glue formulations used in box assembly. Temperature-controlled corrugated packaging is emerging to support cold chain logistics. Additionally, minimalist packaging trends are driving design innovations for shelf-ready formats.
The overall market size for the Corrugated Box Market was USD 179.8 billion in 2025.
The Corrugated Box Market is expected to reach USD 297.0 billion in 2035.
The Corrugated Box Market will be driven by the growth in e-commerce, food distribution, sustainable packaging requirements, and the expansion of automation in warehousing and logistics.
The top 5 countries driving the development of the Corrugated Box Market are the USA, China, Germany, India, and Brazil.


Our Research Products

The "Full Research Suite" delivers actionable market intel, deep dives on markets or technologies, so clients act faster, cut risk, and unlock growth.

The Leaderboard benchmarks and ranks top vendors, classifying them as Established Leaders, Leading Challengers, or Disruptors & Challengers.

Locates where complements amplify value and substitutes erode it, forecasting net impact by horizon

We deliver granular, decision-grade intel: market sizing, 5-year forecasts, pricing, adoption, usage, revenue, and operational KPIs—plus competitor tracking, regulation, and value chains—across 60 countries broadly.

Spot the shifts before they hit your P&L. We track inflection points, adoption curves, pricing moves, and ecosystem plays to show where demand is heading, why it is changing, and what to do next across high-growth markets and disruptive tech

Real-time reads of user behavior. We track shifting priorities, perceptions of today’s and next-gen services, and provider experience, then pace how fast tech moves from trial to adoption, blending buyer, consumer, and channel inputs with social signals (#WhySwitch, #UX).

Partner with our analyst team to build a custom report designed around your business priorities. From analysing market trends to assessing competitors or crafting bespoke datasets, we tailor insights to your needs.
Supplier Intelligence
Discovery & Profiling
Capacity & Footprint
Performance & Risk
Compliance & Governance
Commercial Readiness
Who Supplies Whom
Scorecards & Shortlists
Playbooks & Docs
Category Intelligence
Definition & Scope
Demand & Use Cases
Cost Drivers
Market Structure
Supply Chain Map
Trade & Policy
Operating Norms
Deliverables
Buyer Intelligence
Account Basics
Spend & Scope
Procurement Model
Vendor Requirements
Terms & Policies
Entry Strategy
Pain Points & Triggers
Outputs
Pricing Analysis
Benchmarks
Trends
Should-Cost
Indexation
Landed Cost
Commercial Terms
Deliverables
Brand Analysis
Positioning & Value Prop
Share & Presence
Customer Evidence
Go-to-Market
Digital & Reputation
Compliance & Trust
KPIs & Gaps
Outputs
Full Research Suite comprises of:
Market outlook & trends analysis
Interviews & case studies
Strategic recommendations
Vendor profiles & capabilities analysis
5-year forecasts
8 regions and 60+ country-level data splits
Market segment data splits
12 months of continuous data updates
DELIVERED AS:
PDF EXCEL ONLINE
Corrugated Box Machine Market Size and Share Forecast Outlook 2025 to 2035
Corrugated Box Making Machine Market Size and Share Forecast Outlook 2025 to 2035
Corrugated Box Printer Slotter Machine Market Size and Share Forecast Outlook 2025 to 2035
Breaking Down Market Share in the Corrugated Box Industry
Competitive Breakdown of Corrugated Box Printer Slotter Machine Providers
Corrugated Bin Boxes Market by Dividers, Totes, Jumbo, Kraft Open Top Forecast 2025 to 2035
Evaluating Corrugated Bin Boxes Market Share & Provider Insights
Corrugated Handle Box Market
Corrugated Plastic Box Market Size and Share Forecast Outlook 2025 to 2035
Market Share Insights of the Corrugated Plastic Box Industry
Non-Corrugated Boxes Market Size and Share Forecast Outlook 2025 to 2035
Insulated Corrugated Boxes Market Size and Share Forecast Outlook 2025 to 2035
Market Share Breakdown of Leading Insulated Corrugated Boxes Manufacturers
Multi Depth Corrugated Box Market Size and Share Forecast Outlook 2025 to 2035
High Impact Corrugated Boxes Market Analysis - Size, Share, and Forecast Outlook 2025 to 2035
Corrugated Automotive Packaging Market Size and Share Forecast Outlook 2025 to 2035
Corrugated Fanfold Packaging Market Size and Share Forecast Outlook 2025 to 2035
Corrugated Board Packaging Market Size and Share Forecast Outlook 2025 to 2035
Corrugated Equipment Market Size and Share Forecast Outlook 2025 to 2035
Corrugated Fanfold Market Analysis - Size, Share, and Forecast 2025 to 2035

Thank you!
You will receive an email from our Business Development Manager. Please be sure to check your SPAM/JUNK folder too.
Chat With
MaRIA