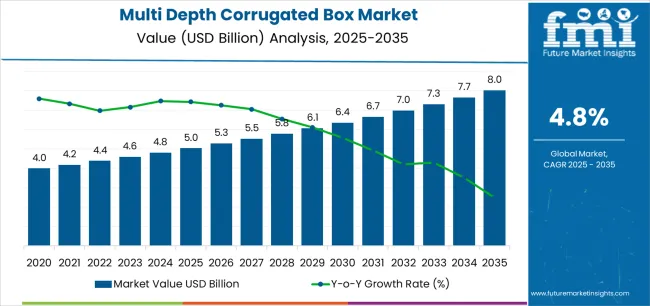
The multi depth corrugated box market had an estimated market share worth USD 4.5 billion in 2023, and it is predicted to reach a global market valuation of USD 7.7 billion by 2034, growing at a CAGR of 5% from 2024 to 2034.
Demand Analysis of Multi Depth Corrugated Box
Report Attribute | Details |
---|---|
Estimated Market Value in 2023 | USD 4.5 billion |
Expected Market Value in 2024 | USD 4.8 billion |
Projected Forecast Value in 2034 | USD 7.7 billion |
Anticipated Growth Rate from 2024 to 2034 | 5% CAGR |
The global demand for the multi depth corrugated box market was estimated to reach a valuation of USD 3.6 billion in 2018, according to a report from Future Market Insights (FMI). From 2018 to 2023, the multi depth corrugated box market witnessed significant growth, registering a CAGR of 4.1%.
Historical CAGR from 2018 to 2023 | 4.1% |
---|---|
Forecast CAGR from 2024 to 2034 | 5% |
The development of smart packaging solutions incorporating RFID (Radio Frequency Identification) technology was a milestone in the multi depth corrugated box market. These boxes improved supply chain visibility and logistical efficiency by enabling real time inventory tracking. The market for multi depth corrugated box is expected to grow in the future due to these factors:
Increasing Demand for Sustainable Packaging and Flourishing E Commerce to Boost Sales
Growing consumer desire for eco friendly packaging options is one of the main factors propelling the multi depth corrugated box market. Concerns about the environment are driving companies to adopt eco friendly products and procedures. This trend is supported by corrugated boxes with recyclable materials, which are fueling market expansion.
The expanding e commerce scene is a major driver of the multi depth corrugated box market. The rise of e commerce demands flexible packaging options that can effectively handle a wide variety of product lines for flawless delivery experiences. Because corrugated boxes can be made to any depth, they are the ideal solution for meeting this need and expanding the market.
Volatility in Raw Material Prices to Impede the Market Growth
The fluctuation of raw material prices, which affects manufacturing profit margins and production costs, is one major impediment. Complying with strict laws around waste management and packing materials is also difficult.
The market is vulnerable to recessions, which can have an impact on consumer purchasing habits and the need for packaged products. Intense competition within an industry drives down prices and limits innovation, which limits the capacity of key players to make profit.
This section focuses on providing detailed analysis of two particular market segments for multi depth corrugated box, the dominant sales channel and the significant end use. The two main segments discussed below are the e retail and food service.
Sales Channel | E Retail |
---|---|
Market Share in 2024 | 38% |
In 2024, the e retail sales channel segment is likely to gain a market share of 38%. They are adaptable, supporting a broad variety of product sizes and satisfying the various demands of online merchants. Their robust design guarantees that goods are kept safe in transit, which raises client satisfaction. The fact that they are adjustable corresponds with the constantly shifting needs of e commerce logistics. The growing inclination towards eco friendly packaging alternatives renders corrugated boxes a desirable option, propelling their integration in e retail transactions.
End Use | Food Service |
---|---|
Market Share in 2024 | 35% |
In 2024, the food service segment is anticipated to acquire 35% market share. The customizable design and protective qualities of multi depth corrugated boxes make them an ideal choice for food service packaging. With depths that can be adjusted, they hold a wide range of foods well, preserving their freshness and avoiding deterioration while in transit.
Their robust design guarantees product integrity, which is essential for maintaining food safety and quality. Corrugated boxes are frequently constructed from sustainable materials, which is in line with the growing need of the food service industry for environmentally responsible packaging options.
This section will go into detail on the multi depth corrugated box markets in a few key countries, including the United States, the United Kingdom, China, Japan and South Korea. This part will focus on the key factors that are driving up demand in these countries for multi depth corrugated box.
Countries | CAGR from 2024 to 2034 |
---|---|
The United States | 4.8% |
The United Kingdom | 3.9% |
China | 5.5% |
Japan | 5.5% |
South Korea | 4.9% |
The United States multi depth corrugated box ecosystem is anticipated to gain a CAGR of 4.8% through 2034. The ongoing growth of online shopping creates a demand for adaptable packaging solutions that can accommodate a wide range of product sizes, enabling the use of multi depth corrugated boxes in effective shipping and delivery procedures.
Growing consumer and company knowledge of environmental issues forces companies to give eco friendly packaging choices top priority. Multi depth corrugated boxes support sustainability objectives and are more widely used in the market since they are frequently constructed from recycled materials and are recyclable.
The multi depth corrugated box market in the United Kingdom is expected to expand with a 3.90% CAGR through 2034.
The diverse retail landscape in the country, which includes both large chains and small independent businesses, requires packaging solutions that can accommodate a wide range of needs and product types.
This makes multi depth corrugated boxes an adaptable choice for packaging applications in a variety of sectors and retail formats.
The multi depth corrugated box ecosystem in China is anticipated to develop with a 5.5% CAGR from 2024 to 2034. Rapid industrialization and manufacturing expansion in China create a high need for packaging solutions, such as multi depth corrugated boxes, to support the regional growing export oriented economy and domestic consumption.
The rapid growth of China's e commerce industry, which is being driven by their increased digitization and internet penetration, creates a huge demand for effective packaging solutions that can be customized, such as multi depth corrugated boxes, to enable the delivery of a variety of goods to customers across the country.
The multi depth corrugated box industry in Japan is anticipated to reach a 5.5% CAGR from 2024 to 2034. Japan has one of the most elderly populations, which has resulted in an increase in demand for home delivery services and specific packaging solutions for senior clients. This is opening up possibilities for innovative features like ergonomic handles and easy open designs in multi depth corrugated boxes.
Japan is renowned for its exacting attention to workmanship and quality. This need for perfection extends to packing materials, promoting the use of high quality multi depth corrugated boxes. It provides exceptional durability, protection, and attractiveness while fulfilling the stringent standards of Japanese consumers and enterprises.
The multi depth corrugated box ecosystem in South Korea is likely to evolve with a 4.90% CAGR during the forecast period.
The robust export driven economy of South Korea, especially in sectors like electronics, automobiles, and cosmetics, drives up the need for dependable and adaptable packaging options like multi depth corrugated boxes.
This will guarantee the secure delivery of commodities to global markets, fostering the expansion of the sector.
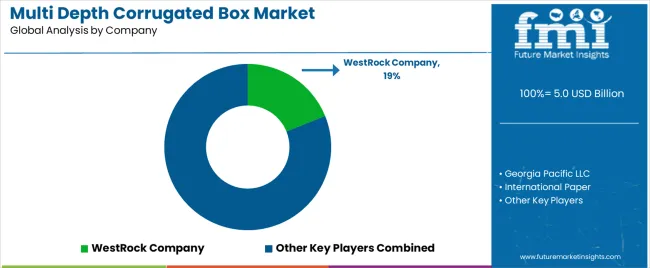
Key players in the multi depth corrugated box market are actively pursuing a number of initiatives in an effort to hold onto or improve their market shares. Their primary focus is innovation, as they introduce novel designs and materials to effectively suit a wide range of packaging demands. They have a strong emphasis on sustainability, creating environmentally friendly solutions to meet legal and customer requirements.
To improve manufacturing processes, increase efficiency, and save costs, they invest in technology. To increase market reach and capabilities, strategic alliances and acquisitions are sought for. All things considered, these companies place a high value on technical innovation, sustainability, and agility in order to prosper in the cutthroat multi depth corrugated box market. The key players in this market include:
Significant advancements in the multi depth corrugated box market are being made by key market participants, and these include:
Report Attribute | Details |
---|---|
Growth Rate | CAGR of 5% from 2024 to 2034 |
Market value in 2024 | USD 4.8 billion |
Market value in 2034 | USD 7.7 billion |
Base Year for Estimation | 2023 |
Historical Data | 2018 to 2023 |
Forecast Period | 2024 to 2034 |
Quantitative Units | USD billion for value |
Report Coverage | Revenue Forecast, Company Ranking, Competitive Landscape, Growth Factors, Trends, and Pricing Analysis |
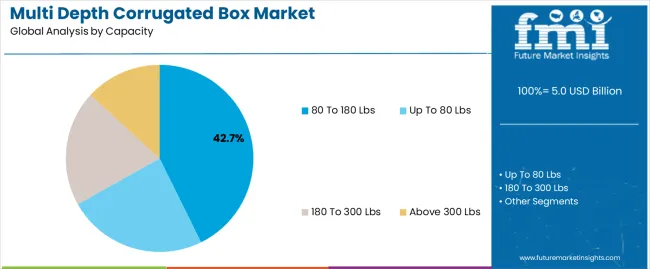
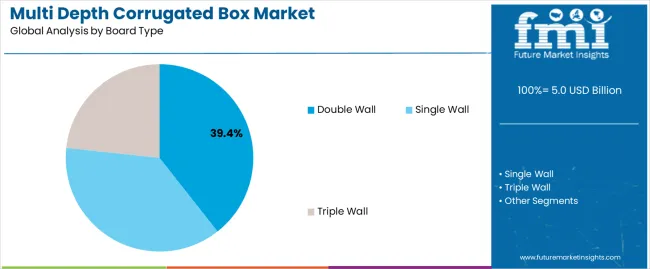
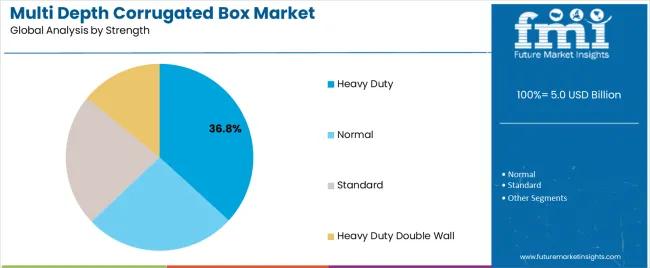
Segments Covered | Capacity, Board Type, Strength, End Use, Region |
Regions Covered | North America; Latin America; Western Europe; Eastern Europe; South Asia and Pacific; East Asia; The Middle East & Africa |
Countries Profiled | The United States, Canada, Brazil, Mexico, Germany, The United Kingdom, France, Spain, Italy, Poland, Russia, Czech Republic, Romania, India, Bangladesh, Australia, New Zealand, China, Japan, South Korea, GCC Countries, South Africa, Israel |
Key Companies Profiled | Georgia Pacific LLC; International Paper; DS Smith Packaging Limited; Oji Holdings Corporation; Pratt Industries Inc.; Acme Corrugated Box Co. Inc.; Great Little Box Company Ltd.; AD Incorporated Of Milwaukee; WestRock Company; Smurfit Kappa Group Plc; Uline Inc. |
Customization Scope | Available on Request |
Table 1: Global Market Value (US$ Million) Forecast by Region, 2019 to 2034
Table 2: Global Market Volume (Units) Forecast by Region, 2019 to 2034
Table 3: Global Market Value (US$ Million) Forecast by Capacity, 2019 to 2034
Table 4: Global Market Volume (Units) Forecast by Capacity, 2019 to 2034
Table 5: Global Market Value (US$ Million) Forecast by Board Type, 2019 to 2034
Table 6: Global Market Volume (Units) Forecast by Board Type, 2019 to 2034
Table 7: Global Market Value (US$ Million) Forecast by Strength, 2019 to 2034
Table 8: Global Market Volume (Units) Forecast by Strength, 2019 to 2034
Table 9: Global Market Value (US$ Million) Forecast by End Use, 2019 to 2034
Table 10: Global Market Volume (Units) Forecast by End Use, 2019 to 2034
Table 11: North America Market Value (US$ Million) Forecast by Country, 2019 to 2034
Table 12: North America Market Volume (Units) Forecast by Country, 2019 to 2034
Table 13: North America Market Value (US$ Million) Forecast by Capacity, 2019 to 2034
Table 14: North America Market Volume (Units) Forecast by Capacity, 2019 to 2034
Table 15: North America Market Value (US$ Million) Forecast by Board Type, 2019 to 2034
Table 16: North America Market Volume (Units) Forecast by Board Type, 2019 to 2034
Table 17: North America Market Value (US$ Million) Forecast by Strength, 2019 to 2034
Table 18: North America Market Volume (Units) Forecast by Strength, 2019 to 2034
Table 19: North America Market Value (US$ Million) Forecast by End Use, 2019 to 2034
Table 20: North America Market Volume (Units) Forecast by End Use, 2019 to 2034
Table 21: Latin America Market Value (US$ Million) Forecast by Country, 2019 to 2034
Table 22: Latin America Market Volume (Units) Forecast by Country, 2019 to 2034
Table 23: Latin America Market Value (US$ Million) Forecast by Capacity, 2019 to 2034
Table 24: Latin America Market Volume (Units) Forecast by Capacity, 2019 to 2034
Table 25: Latin America Market Value (US$ Million) Forecast by Board Type, 2019 to 2034
Table 26: Latin America Market Volume (Units) Forecast by Board Type, 2019 to 2034
Table 27: Latin America Market Value (US$ Million) Forecast by Strength, 2019 to 2034
Table 28: Latin America Market Volume (Units) Forecast by Strength, 2019 to 2034
Table 29: Latin America Market Value (US$ Million) Forecast by End Use, 2019 to 2034
Table 30: Latin America Market Volume (Units) Forecast by End Use, 2019 to 2034
Table 31: Western Europe Market Value (US$ Million) Forecast by Country, 2019 to 2034
Table 32: Western Europe Market Volume (Units) Forecast by Country, 2019 to 2034
Table 33: Western Europe Market Value (US$ Million) Forecast by Capacity, 2019 to 2034
Table 34: Western Europe Market Volume (Units) Forecast by Capacity, 2019 to 2034
Table 35: Western Europe Market Value (US$ Million) Forecast by Board Type, 2019 to 2034
Table 36: Western Europe Market Volume (Units) Forecast by Board Type, 2019 to 2034
Table 37: Western Europe Market Value (US$ Million) Forecast by Strength, 2019 to 2034
Table 38: Western Europe Market Volume (Units) Forecast by Strength, 2019 to 2034
Table 39: Western Europe Market Value (US$ Million) Forecast by End Use, 2019 to 2034
Table 40: Western Europe Market Volume (Units) Forecast by End Use, 2019 to 2034
Table 41: Eastern Europe Market Value (US$ Million) Forecast by Country, 2019 to 2034
Table 42: Eastern Europe Market Volume (Units) Forecast by Country, 2019 to 2034
Table 43: Eastern Europe Market Value (US$ Million) Forecast by Capacity, 2019 to 2034
Table 44: Eastern Europe Market Volume (Units) Forecast by Capacity, 2019 to 2034
Table 45: Eastern Europe Market Value (US$ Million) Forecast by Board Type, 2019 to 2034
Table 46: Eastern Europe Market Volume (Units) Forecast by Board Type, 2019 to 2034
Table 47: Eastern Europe Market Value (US$ Million) Forecast by Strength, 2019 to 2034
Table 48: Eastern Europe Market Volume (Units) Forecast by Strength, 2019 to 2034
Table 49: Eastern Europe Market Value (US$ Million) Forecast by End Use, 2019 to 2034
Table 50: Eastern Europe Market Volume (Units) Forecast by End Use, 2019 to 2034
Table 51: South Asia and Pacific Market Value (US$ Million) Forecast by Country, 2019 to 2034
Table 52: South Asia and Pacific Market Volume (Units) Forecast by Country, 2019 to 2034
Table 53: South Asia and Pacific Market Value (US$ Million) Forecast by Capacity, 2019 to 2034
Table 54: South Asia and Pacific Market Volume (Units) Forecast by Capacity, 2019 to 2034
Table 55: South Asia and Pacific Market Value (US$ Million) Forecast by Board Type, 2019 to 2034
Table 56: South Asia and Pacific Market Volume (Units) Forecast by Board Type, 2019 to 2034
Table 57: South Asia and Pacific Market Value (US$ Million) Forecast by Strength, 2019 to 2034
Table 58: South Asia and Pacific Market Volume (Units) Forecast by Strength, 2019 to 2034
Table 59: South Asia and Pacific Market Value (US$ Million) Forecast by End Use, 2019 to 2034
Table 60: South Asia and Pacific Market Volume (Units) Forecast by End Use, 2019 to 2034
Table 61: East Asia Market Value (US$ Million) Forecast by Country, 2019 to 2034
Table 62: East Asia Market Volume (Units) Forecast by Country, 2019 to 2034
Table 63: East Asia Market Value (US$ Million) Forecast by Capacity, 2019 to 2034
Table 64: East Asia Market Volume (Units) Forecast by Capacity, 2019 to 2034
Table 65: East Asia Market Value (US$ Million) Forecast by Board Type, 2019 to 2034
Table 66: East Asia Market Volume (Units) Forecast by Board Type, 2019 to 2034
Table 67: East Asia Market Value (US$ Million) Forecast by Strength, 2019 to 2034
Table 68: East Asia Market Volume (Units) Forecast by Strength, 2019 to 2034
Table 69: East Asia Market Value (US$ Million) Forecast by End Use, 2019 to 2034
Table 70: East Asia Market Volume (Units) Forecast by End Use, 2019 to 2034
Table 71: Middle East and Africa Market Value (US$ Million) Forecast by Country, 2019 to 2034
Table 72: Middle East and Africa Market Volume (Units) Forecast by Country, 2019 to 2034
Table 73: Middle East and Africa Market Value (US$ Million) Forecast by Capacity, 2019 to 2034
Table 74: Middle East and Africa Market Volume (Units) Forecast by Capacity, 2019 to 2034
Table 75: Middle East and Africa Market Value (US$ Million) Forecast by Board Type, 2019 to 2034
Table 76: Middle East and Africa Market Volume (Units) Forecast by Board Type, 2019 to 2034
Table 77: Middle East and Africa Market Value (US$ Million) Forecast by Strength, 2019 to 2034
Table 78: Middle East and Africa Market Volume (Units) Forecast by Strength, 2019 to 2034
Table 79: Middle East and Africa Market Value (US$ Million) Forecast by End Use, 2019 to 2034
Table 80: Middle East and Africa Market Volume (Units) Forecast by End Use, 2019 to 2034
Figure 1: Global Market Value (US$ Million) by Capacity, 2024 to 2034
Figure 2: Global Market Value (US$ Million) by Board Type, 2024 to 2034
Figure 3: Global Market Value (US$ Million) by Strength, 2024 to 2034
Figure 4: Global Market Value (US$ Million) by End Use, 2024 to 2034
Figure 5: Global Market Value (US$ Million) by Region, 2024 to 2034
Figure 6: Global Market Value (US$ Million) Analysis by Region, 2019 to 2034
Figure 7: Global Market Volume (Units) Analysis by Region, 2019 to 2034
Figure 8: Global Market Value Share (%) and BPS Analysis by Region, 2024 to 2034
Figure 9: Global Market Y-o-Y Growth (%) Projections by Region, 2024 to 2034
Figure 10: Global Market Value (US$ Million) Analysis by Capacity, 2019 to 2034
Figure 11: Global Market Volume (Units) Analysis by Capacity, 2019 to 2034
Figure 12: Global Market Value Share (%) and BPS Analysis by Capacity, 2024 to 2034
Figure 13: Global Market Y-o-Y Growth (%) Projections by Capacity, 2024 to 2034
Figure 14: Global Market Value (US$ Million) Analysis by Board Type, 2019 to 2034
Figure 15: Global Market Volume (Units) Analysis by Board Type, 2019 to 2034
Figure 16: Global Market Value Share (%) and BPS Analysis by Board Type, 2024 to 2034
Figure 17: Global Market Y-o-Y Growth (%) Projections by Board Type, 2024 to 2034
Figure 18: Global Market Value (US$ Million) Analysis by Strength, 2019 to 2034
Figure 19: Global Market Volume (Units) Analysis by Strength, 2019 to 2034
Figure 20: Global Market Value Share (%) and BPS Analysis by Strength, 2024 to 2034
Figure 21: Global Market Y-o-Y Growth (%) Projections by Strength, 2024 to 2034
Figure 22: Global Market Value (US$ Million) Analysis by End Use, 2019 to 2034
Figure 23: Global Market Volume (Units) Analysis by End Use, 2019 to 2034
Figure 24: Global Market Value Share (%) and BPS Analysis by End Use, 2024 to 2034
Figure 25: Global Market Y-o-Y Growth (%) Projections by End Use, 2024 to 2034
Figure 26: Global Market Attractiveness by Capacity, 2024 to 2034
Figure 27: Global Market Attractiveness by Board Type, 2024 to 2034
Figure 28: Global Market Attractiveness by Strength, 2024 to 2034
Figure 29: Global Market Attractiveness by End Use, 2024 to 2034
Figure 30: Global Market Attractiveness by Region, 2024 to 2034
Figure 31: North America Market Value (US$ Million) by Capacity, 2024 to 2034
Figure 32: North America Market Value (US$ Million) by Board Type, 2024 to 2034
Figure 33: North America Market Value (US$ Million) by Strength, 2024 to 2034
Figure 34: North America Market Value (US$ Million) by End Use, 2024 to 2034
Figure 35: North America Market Value (US$ Million) by Country, 2024 to 2034
Figure 36: North America Market Value (US$ Million) Analysis by Country, 2019 to 2034
Figure 37: North America Market Volume (Units) Analysis by Country, 2019 to 2034
Figure 38: North America Market Value Share (%) and BPS Analysis by Country, 2024 to 2034
Figure 39: North America Market Y-o-Y Growth (%) Projections by Country, 2024 to 2034
Figure 40: North America Market Value (US$ Million) Analysis by Capacity, 2019 to 2034
Figure 41: North America Market Volume (Units) Analysis by Capacity, 2019 to 2034
Figure 42: North America Market Value Share (%) and BPS Analysis by Capacity, 2024 to 2034
Figure 43: North America Market Y-o-Y Growth (%) Projections by Capacity, 2024 to 2034
Figure 44: North America Market Value (US$ Million) Analysis by Board Type, 2019 to 2034
Figure 45: North America Market Volume (Units) Analysis by Board Type, 2019 to 2034
Figure 46: North America Market Value Share (%) and BPS Analysis by Board Type, 2024 to 2034
Figure 47: North America Market Y-o-Y Growth (%) Projections by Board Type, 2024 to 2034
Figure 48: North America Market Value (US$ Million) Analysis by Strength, 2019 to 2034
Figure 49: North America Market Volume (Units) Analysis by Strength, 2019 to 2034
Figure 50: North America Market Value Share (%) and BPS Analysis by Strength, 2024 to 2034
Figure 51: North America Market Y-o-Y Growth (%) Projections by Strength, 2024 to 2034
Figure 52: North America Market Value (US$ Million) Analysis by End Use, 2019 to 2034
Figure 53: North America Market Volume (Units) Analysis by End Use, 2019 to 2034
Figure 54: North America Market Value Share (%) and BPS Analysis by End Use, 2024 to 2034
Figure 55: North America Market Y-o-Y Growth (%) Projections by End Use, 2024 to 2034
Figure 56: North America Market Attractiveness by Capacity, 2024 to 2034
Figure 57: North America Market Attractiveness by Board Type, 2024 to 2034
Figure 58: North America Market Attractiveness by Strength, 2024 to 2034
Figure 59: North America Market Attractiveness by End Use, 2024 to 2034
Figure 60: North America Market Attractiveness by Country, 2024 to 2034
Figure 61: Latin America Market Value (US$ Million) by Capacity, 2024 to 2034
Figure 62: Latin America Market Value (US$ Million) by Board Type, 2024 to 2034
Figure 63: Latin America Market Value (US$ Million) by Strength, 2024 to 2034
Figure 64: Latin America Market Value (US$ Million) by End Use, 2024 to 2034
Figure 65: Latin America Market Value (US$ Million) by Country, 2024 to 2034
Figure 66: Latin America Market Value (US$ Million) Analysis by Country, 2019 to 2034
Figure 67: Latin America Market Volume (Units) Analysis by Country, 2019 to 2034
Figure 68: Latin America Market Value Share (%) and BPS Analysis by Country, 2024 to 2034
Figure 69: Latin America Market Y-o-Y Growth (%) Projections by Country, 2024 to 2034
Figure 70: Latin America Market Value (US$ Million) Analysis by Capacity, 2019 to 2034
Figure 71: Latin America Market Volume (Units) Analysis by Capacity, 2019 to 2034
Figure 72: Latin America Market Value Share (%) and BPS Analysis by Capacity, 2024 to 2034
Figure 73: Latin America Market Y-o-Y Growth (%) Projections by Capacity, 2024 to 2034
Figure 74: Latin America Market Value (US$ Million) Analysis by Board Type, 2019 to 2034
Figure 75: Latin America Market Volume (Units) Analysis by Board Type, 2019 to 2034
Figure 76: Latin America Market Value Share (%) and BPS Analysis by Board Type, 2024 to 2034
Figure 77: Latin America Market Y-o-Y Growth (%) Projections by Board Type, 2024 to 2034
Figure 78: Latin America Market Value (US$ Million) Analysis by Strength, 2019 to 2034
Figure 79: Latin America Market Volume (Units) Analysis by Strength, 2019 to 2034
Figure 80: Latin America Market Value Share (%) and BPS Analysis by Strength, 2024 to 2034
Figure 81: Latin America Market Y-o-Y Growth (%) Projections by Strength, 2024 to 2034
Figure 82: Latin America Market Value (US$ Million) Analysis by End Use, 2019 to 2034
Figure 83: Latin America Market Volume (Units) Analysis by End Use, 2019 to 2034
Figure 84: Latin America Market Value Share (%) and BPS Analysis by End Use, 2024 to 2034
Figure 85: Latin America Market Y-o-Y Growth (%) Projections by End Use, 2024 to 2034
Figure 86: Latin America Market Attractiveness by Capacity, 2024 to 2034
Figure 87: Latin America Market Attractiveness by Board Type, 2024 to 2034
Figure 88: Latin America Market Attractiveness by Strength, 2024 to 2034
Figure 89: Latin America Market Attractiveness by End Use, 2024 to 2034
Figure 90: Latin America Market Attractiveness by Country, 2024 to 2034
Figure 91: Western Europe Market Value (US$ Million) by Capacity, 2024 to 2034
Figure 92: Western Europe Market Value (US$ Million) by Board Type, 2024 to 2034
Figure 93: Western Europe Market Value (US$ Million) by Strength, 2024 to 2034
Figure 94: Western Europe Market Value (US$ Million) by End Use, 2024 to 2034
Figure 95: Western Europe Market Value (US$ Million) by Country, 2024 to 2034
Figure 96: Western Europe Market Value (US$ Million) Analysis by Country, 2019 to 2034
Figure 97: Western Europe Market Volume (Units) Analysis by Country, 2019 to 2034
Figure 98: Western Europe Market Value Share (%) and BPS Analysis by Country, 2024 to 2034
Figure 99: Western Europe Market Y-o-Y Growth (%) Projections by Country, 2024 to 2034
Figure 100: Western Europe Market Value (US$ Million) Analysis by Capacity, 2019 to 2034
Figure 101: Western Europe Market Volume (Units) Analysis by Capacity, 2019 to 2034
Figure 102: Western Europe Market Value Share (%) and BPS Analysis by Capacity, 2024 to 2034
Figure 103: Western Europe Market Y-o-Y Growth (%) Projections by Capacity, 2024 to 2034
Figure 104: Western Europe Market Value (US$ Million) Analysis by Board Type, 2019 to 2034
Figure 105: Western Europe Market Volume (Units) Analysis by Board Type, 2019 to 2034
Figure 106: Western Europe Market Value Share (%) and BPS Analysis by Board Type, 2024 to 2034
Figure 107: Western Europe Market Y-o-Y Growth (%) Projections by Board Type, 2024 to 2034
Figure 108: Western Europe Market Value (US$ Million) Analysis by Strength, 2019 to 2034
Figure 109: Western Europe Market Volume (Units) Analysis by Strength, 2019 to 2034
Figure 110: Western Europe Market Value Share (%) and BPS Analysis by Strength, 2024 to 2034
Figure 111: Western Europe Market Y-o-Y Growth (%) Projections by Strength, 2024 to 2034
Figure 112: Western Europe Market Value (US$ Million) Analysis by End Use, 2019 to 2034
Figure 113: Western Europe Market Volume (Units) Analysis by End Use, 2019 to 2034
Figure 114: Western Europe Market Value Share (%) and BPS Analysis by End Use, 2024 to 2034
Figure 115: Western Europe Market Y-o-Y Growth (%) Projections by End Use, 2024 to 2034
Figure 116: Western Europe Market Attractiveness by Capacity, 2024 to 2034
Figure 117: Western Europe Market Attractiveness by Board Type, 2024 to 2034
Figure 118: Western Europe Market Attractiveness by Strength, 2024 to 2034
Figure 119: Western Europe Market Attractiveness by End Use, 2024 to 2034
Figure 120: Western Europe Market Attractiveness by Country, 2024 to 2034
Figure 121: Eastern Europe Market Value (US$ Million) by Capacity, 2024 to 2034
Figure 122: Eastern Europe Market Value (US$ Million) by Board Type, 2024 to 2034
Figure 123: Eastern Europe Market Value (US$ Million) by Strength, 2024 to 2034
Figure 124: Eastern Europe Market Value (US$ Million) by End Use, 2024 to 2034
Figure 125: Eastern Europe Market Value (US$ Million) by Country, 2024 to 2034
Figure 126: Eastern Europe Market Value (US$ Million) Analysis by Country, 2019 to 2034
Figure 127: Eastern Europe Market Volume (Units) Analysis by Country, 2019 to 2034
Figure 128: Eastern Europe Market Value Share (%) and BPS Analysis by Country, 2024 to 2034
Figure 129: Eastern Europe Market Y-o-Y Growth (%) Projections by Country, 2024 to 2034
Figure 130: Eastern Europe Market Value (US$ Million) Analysis by Capacity, 2019 to 2034
Figure 131: Eastern Europe Market Volume (Units) Analysis by Capacity, 2019 to 2034
Figure 132: Eastern Europe Market Value Share (%) and BPS Analysis by Capacity, 2024 to 2034
Figure 133: Eastern Europe Market Y-o-Y Growth (%) Projections by Capacity, 2024 to 2034
Figure 134: Eastern Europe Market Value (US$ Million) Analysis by Board Type, 2019 to 2034
Figure 135: Eastern Europe Market Volume (Units) Analysis by Board Type, 2019 to 2034
Figure 136: Eastern Europe Market Value Share (%) and BPS Analysis by Board Type, 2024 to 2034
Figure 137: Eastern Europe Market Y-o-Y Growth (%) Projections by Board Type, 2024 to 2034
Figure 138: Eastern Europe Market Value (US$ Million) Analysis by Strength, 2019 to 2034
Figure 139: Eastern Europe Market Volume (Units) Analysis by Strength, 2019 to 2034
Figure 140: Eastern Europe Market Value Share (%) and BPS Analysis by Strength, 2024 to 2034
Figure 141: Eastern Europe Market Y-o-Y Growth (%) Projections by Strength, 2024 to 2034
Figure 142: Eastern Europe Market Value (US$ Million) Analysis by End Use, 2019 to 2034
Figure 143: Eastern Europe Market Volume (Units) Analysis by End Use, 2019 to 2034
Figure 144: Eastern Europe Market Value Share (%) and BPS Analysis by End Use, 2024 to 2034
Figure 145: Eastern Europe Market Y-o-Y Growth (%) Projections by End Use, 2024 to 2034
Figure 146: Eastern Europe Market Attractiveness by Capacity, 2024 to 2034
Figure 147: Eastern Europe Market Attractiveness by Board Type, 2024 to 2034
Figure 148: Eastern Europe Market Attractiveness by Strength, 2024 to 2034
Figure 149: Eastern Europe Market Attractiveness by End Use, 2024 to 2034
Figure 150: Eastern Europe Market Attractiveness by Country, 2024 to 2034
Figure 151: South Asia and Pacific Market Value (US$ Million) by Capacity, 2024 to 2034
Figure 152: South Asia and Pacific Market Value (US$ Million) by Board Type, 2024 to 2034
Figure 153: South Asia and Pacific Market Value (US$ Million) by Strength, 2024 to 2034
Figure 154: South Asia and Pacific Market Value (US$ Million) by End Use, 2024 to 2034
Figure 155: South Asia and Pacific Market Value (US$ Million) by Country, 2024 to 2034
Figure 156: South Asia and Pacific Market Value (US$ Million) Analysis by Country, 2019 to 2034
Figure 157: South Asia and Pacific Market Volume (Units) Analysis by Country, 2019 to 2034
Figure 158: South Asia and Pacific Market Value Share (%) and BPS Analysis by Country, 2024 to 2034
Figure 159: South Asia and Pacific Market Y-o-Y Growth (%) Projections by Country, 2024 to 2034
Figure 160: South Asia and Pacific Market Value (US$ Million) Analysis by Capacity, 2019 to 2034
Figure 161: South Asia and Pacific Market Volume (Units) Analysis by Capacity, 2019 to 2034
Figure 162: South Asia and Pacific Market Value Share (%) and BPS Analysis by Capacity, 2024 to 2034
Figure 163: South Asia and Pacific Market Y-o-Y Growth (%) Projections by Capacity, 2024 to 2034
Figure 164: South Asia and Pacific Market Value (US$ Million) Analysis by Board Type, 2019 to 2034
Figure 165: South Asia and Pacific Market Volume (Units) Analysis by Board Type, 2019 to 2034
Figure 166: South Asia and Pacific Market Value Share (%) and BPS Analysis by Board Type, 2024 to 2034
Figure 167: South Asia and Pacific Market Y-o-Y Growth (%) Projections by Board Type, 2024 to 2034
Figure 168: South Asia and Pacific Market Value (US$ Million) Analysis by Strength, 2019 to 2034
Figure 169: South Asia and Pacific Market Volume (Units) Analysis by Strength, 2019 to 2034
Figure 170: South Asia and Pacific Market Value Share (%) and BPS Analysis by Strength, 2024 to 2034
Figure 171: South Asia and Pacific Market Y-o-Y Growth (%) Projections by Strength, 2024 to 2034
Figure 172: South Asia and Pacific Market Value (US$ Million) Analysis by End Use, 2019 to 2034
Figure 173: South Asia and Pacific Market Volume (Units) Analysis by End Use, 2019 to 2034
Figure 174: South Asia and Pacific Market Value Share (%) and BPS Analysis by End Use, 2024 to 2034
Figure 175: South Asia and Pacific Market Y-o-Y Growth (%) Projections by End Use, 2024 to 2034
Figure 176: South Asia and Pacific Market Attractiveness by Capacity, 2024 to 2034
Figure 177: South Asia and Pacific Market Attractiveness by Board Type, 2024 to 2034
Figure 178: South Asia and Pacific Market Attractiveness by Strength, 2024 to 2034
Figure 179: South Asia and Pacific Market Attractiveness by End Use, 2024 to 2034
Figure 180: South Asia and Pacific Market Attractiveness by Country, 2024 to 2034
Figure 181: East Asia Market Value (US$ Million) by Capacity, 2024 to 2034
Figure 182: East Asia Market Value (US$ Million) by Board Type, 2024 to 2034
Figure 183: East Asia Market Value (US$ Million) by Strength, 2024 to 2034
Figure 184: East Asia Market Value (US$ Million) by End Use, 2024 to 2034
Figure 185: East Asia Market Value (US$ Million) by Country, 2024 to 2034
Figure 186: East Asia Market Value (US$ Million) Analysis by Country, 2019 to 2034
Figure 187: East Asia Market Volume (Units) Analysis by Country, 2019 to 2034
Figure 188: East Asia Market Value Share (%) and BPS Analysis by Country, 2024 to 2034
Figure 189: East Asia Market Y-o-Y Growth (%) Projections by Country, 2024 to 2034
Figure 190: East Asia Market Value (US$ Million) Analysis by Capacity, 2019 to 2034
Figure 191: East Asia Market Volume (Units) Analysis by Capacity, 2019 to 2034
Figure 192: East Asia Market Value Share (%) and BPS Analysis by Capacity, 2024 to 2034
Figure 193: East Asia Market Y-o-Y Growth (%) Projections by Capacity, 2024 to 2034
Figure 194: East Asia Market Value (US$ Million) Analysis by Board Type, 2019 to 2034
Figure 195: East Asia Market Volume (Units) Analysis by Board Type, 2019 to 2034
Figure 196: East Asia Market Value Share (%) and BPS Analysis by Board Type, 2024 to 2034
Figure 197: East Asia Market Y-o-Y Growth (%) Projections by Board Type, 2024 to 2034
Figure 198: East Asia Market Value (US$ Million) Analysis by Strength, 2019 to 2034
Figure 199: East Asia Market Volume (Units) Analysis by Strength, 2019 to 2034
Figure 200: East Asia Market Value Share (%) and BPS Analysis by Strength, 2024 to 2034
Figure 201: East Asia Market Y-o-Y Growth (%) Projections by Strength, 2024 to 2034
Figure 202: East Asia Market Value (US$ Million) Analysis by End Use, 2019 to 2034
Figure 203: East Asia Market Volume (Units) Analysis by End Use, 2019 to 2034
Figure 204: East Asia Market Value Share (%) and BPS Analysis by End Use, 2024 to 2034
Figure 205: East Asia Market Y-o-Y Growth (%) Projections by End Use, 2024 to 2034
Figure 206: East Asia Market Attractiveness by Capacity, 2024 to 2034
Figure 207: East Asia Market Attractiveness by Board Type, 2024 to 2034
Figure 208: East Asia Market Attractiveness by Strength, 2024 to 2034
Figure 209: East Asia Market Attractiveness by End Use, 2024 to 2034
Figure 210: East Asia Market Attractiveness by Country, 2024 to 2034
Figure 211: Middle East and Africa Market Value (US$ Million) by Capacity, 2024 to 2034
Figure 212: Middle East and Africa Market Value (US$ Million) by Board Type, 2024 to 2034
Figure 213: Middle East and Africa Market Value (US$ Million) by Strength, 2024 to 2034
Figure 214: Middle East and Africa Market Value (US$ Million) by End Use, 2024 to 2034
Figure 215: Middle East and Africa Market Value (US$ Million) by Country, 2024 to 2034
Figure 216: Middle East and Africa Market Value (US$ Million) Analysis by Country, 2019 to 2034
Figure 217: Middle East and Africa Market Volume (Units) Analysis by Country, 2019 to 2034
Figure 218: Middle East and Africa Market Value Share (%) and BPS Analysis by Country, 2024 to 2034
Figure 219: Middle East and Africa Market Y-o-Y Growth (%) Projections by Country, 2024 to 2034
Figure 220: Middle East and Africa Market Value (US$ Million) Analysis by Capacity, 2019 to 2034
Figure 221: Middle East and Africa Market Volume (Units) Analysis by Capacity, 2019 to 2034
Figure 222: Middle East and Africa Market Value Share (%) and BPS Analysis by Capacity, 2024 to 2034
Figure 223: Middle East and Africa Market Y-o-Y Growth (%) Projections by Capacity, 2024 to 2034
Figure 224: Middle East and Africa Market Value (US$ Million) Analysis by Board Type, 2019 to 2034
Figure 225: Middle East and Africa Market Volume (Units) Analysis by Board Type, 2019 to 2034
Figure 226: Middle East and Africa Market Value Share (%) and BPS Analysis by Board Type, 2024 to 2034
Figure 227: Middle East and Africa Market Y-o-Y Growth (%) Projections by Board Type, 2024 to 2034
Figure 228: Middle East and Africa Market Value (US$ Million) Analysis by Strength, 2019 to 2034
Figure 229: Middle East and Africa Market Volume (Units) Analysis by Strength, 2019 to 2034
Figure 230: Middle East and Africa Market Value Share (%) and BPS Analysis by Strength, 2024 to 2034
Figure 231: Middle East and Africa Market Y-o-Y Growth (%) Projections by Strength, 2024 to 2034
Figure 232: Middle East and Africa Market Value (US$ Million) Analysis by End Use, 2019 to 2034
Figure 233: Middle East and Africa Market Volume (Units) Analysis by End Use, 2019 to 2034
Figure 234: Middle East and Africa Market Value Share (%) and BPS Analysis by End Use, 2024 to 2034
Figure 235: Middle East and Africa Market Y-o-Y Growth (%) Projections by End Use, 2024 to 2034
Figure 236: Middle East and Africa Market Attractiveness by Capacity, 2024 to 2034
Figure 237: Middle East and Africa Market Attractiveness by Board Type, 2024 to 2034
Figure 238: Middle East and Africa Market Attractiveness by Strength, 2024 to 2034
Figure 239: Middle East and Africa Market Attractiveness by End Use, 2024 to 2034
Figure 240: Middle East and Africa Market Attractiveness by Country, 2024 to 2034
The multi depth corrugated box market is expected to garner a 5% CAGR from 2024 to 2034.
By 2024, the global multi depth corrugated box market is likely to gain USD 4.8 billion.
By 2034, the multi depth corrugated box market valuation is likely to reach a sum of USD 7.7 billion.
The multi depth corrugated box industry in the United States is likely to garner a 4.8% CAGR during the forecast period.
The multi depth corrugated box is likely to be widely sold via the e retail channel and gain a 38% market share in 2024.
The multi depth corrugated box systems will be highly used for food service with an anticipated 35% market share in 2024.
Explore Similar Insights
Thank you!
You will receive an email from our Business Development Manager. Please be sure to check your SPAM/JUNK folder too.