The Multi-axis Motion Controller Market is estimated to be valued at USD 12.0 billion in 2025 and is projected to reach USD 28.8 billion by 2035, registering a compound annual growth rate (CAGR) of 9.1% over the forecast period.
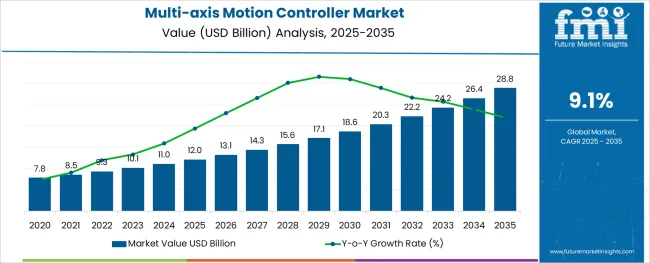
The multi-axis motion controller market is expanding steadily due to increased automation in manufacturing and advanced production processes. The growth in sectors like machine tools and robotics has boosted demand for precise control systems capable of managing complex movements. Industrial advancements and the adoption of computer numerical control (CNC) machines have increased the need for sophisticated motion controllers that enhance accuracy and efficiency.
Product developments focusing on digital signal processing have improved the responsiveness and programmability of controllers, supporting a wide range of applications. Additionally, the integration of these controllers into robotics and CNC machinery has enabled manufacturers to optimize operations and reduce cycle times.
Looking ahead, the market is poised for growth as industries continue to adopt automation technologies and improve manufacturing flexibility. Segmental growth is expected to be led by machine tools as the primary end user, robotics and CNC as key application areas, and digital signal processing type products for their advanced processing capabilities.
The market is segmented by End User, Applications, and Product Type and region. By End User, the market is divided into Machine Tools, Packaging and Labeling, Material Handling, Semiconductor, and Others. In terms of Applications, the market is classified into Robotics and CNC, GMC, Material Handling, Packaging and Labeling, Semiconductor Process, Flight Simulator, and Semiconductor.
Based on Product Type, the market is segmented into Digital Signal Processing Type, Analog Circuit Type, and Programmable Logic Type. Regionally, the market is classified into North America, Latin America, Western Europe, Eastern Europe, Balkan & Baltic Countries, Russia & Belarus, Central Asia, East Asia, South Asia & Pacific, and the Middle East & Africa.
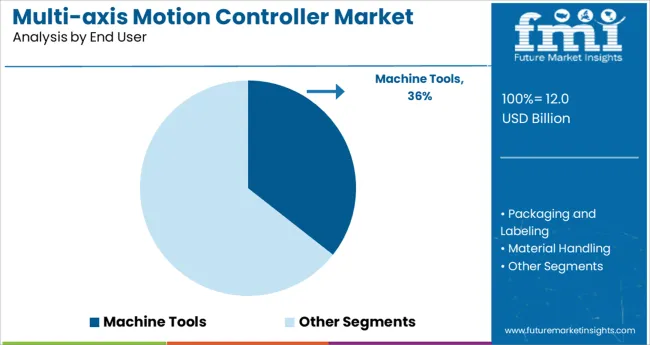
The Machine Tools segment is anticipated to contribute 35.6% of the multi-axis motion controller market revenue in 2025, maintaining its leading position among end users. This segment benefits from the ongoing modernization of manufacturing equipment that requires precise motion control for operations such as milling, turning, and drilling.
The need to achieve high precision and repeatability has encouraged the adoption of advanced controllers that can manage multiple axes simultaneously. Manufacturers have increasingly incorporated motion controllers to improve throughput and product quality while minimizing operational errors.
The rising demand for customizable and flexible machine tools further supports this segment's growth. As manufacturing processes continue to evolve, the Machine Tools segment will remain critical in driving market expansion.
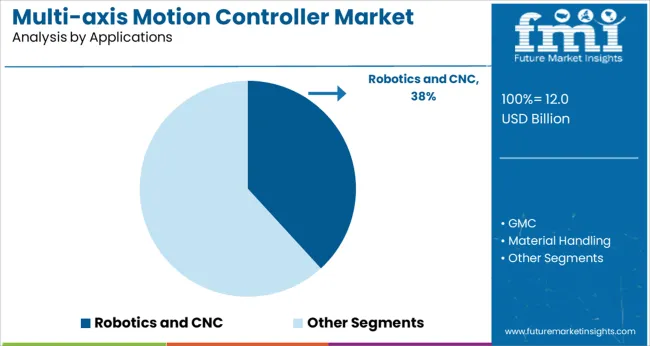
The Robotics and CNC segment is expected to hold 38.2% of the market revenue in 2025, positioning it as the leading application segment. Growth here is fueled by the increasing deployment of robots and CNC machines across automotive, aerospace, electronics, and general manufacturing industries.
These applications require motion controllers capable of handling precise and coordinated multi-axis movements for tasks such as assembly, welding, and material handling. The evolution of robotics toward collaborative robots and more complex CNC operations has highlighted the need for motion controllers that offer enhanced programmability and integration with control systems.
As automation becomes more prevalent and production demands grow, Robotics and CNC applications will continue to be the main drivers for motion controller adoption.
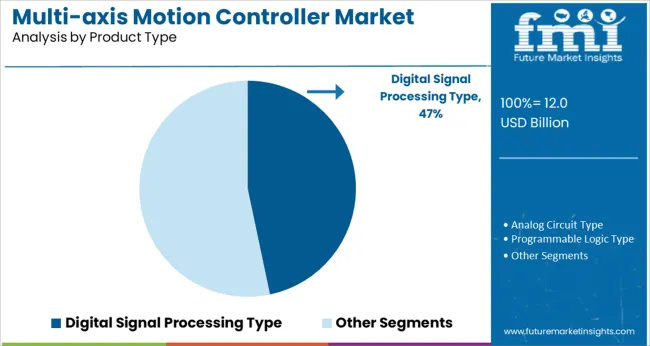
The Digital Signal Processing Type segment is projected to account for 46.7% of the multi-axis motion controller market revenue in 2025, making it the dominant product type. These controllers are preferred for their ability to process complex algorithms quickly and provide high precision control in dynamic environments.
The DSP-based controllers offer real-time feedback and adaptive control, which are essential for high-speed and multi-axis applications. Their flexibility allows them to be used across various industries, improving operational efficiency and product quality.
Continuous advancements in digital signal processing technology have enabled better noise reduction, error correction, and system stability. The Digital Signal Processing Type segment is expected to maintain its lead as industries seek more intelligent and responsive motion control solutions.
In the recent past, a concept known as the Internet of Things (IoT) for customized products has emerged. This concept, making its way through the market, has brought about an industrial revolution along with the concept of Industry 4.0.
The emergence of IoT is likely to drive the multi-axis motion controller market key trends & opportunities in the coming year. Also, one of the factors expected to push the growth of multi-axis motion controller market statistics.
As the machines used in the industries are gradually becoming electro-mechanically or electrically operated, the demand for multi-axis motion controllers is rising at a fast pace, especially in the machine tools segment.
Also, electric discharge machining and laser cutting machining are high-potential areas where growth is estimated at a high CAGR in the forecast period from 2025 to 2035.
The adoption of multi-axis motion controllers is anticipated to rise as they provide very high levels of precision control and accuracy and hence have a very high demand in the semiconductor segment of the multi-axis motion controller market.
All these key factors are playing a crucial role in the multi-axis motion controller market's future trends as per the multi-axis motion controller market report in the coming year.
Low-cost manufacturers are focusing on competitive strategies for deciding the prices of multi-axis motion controllers. This factor may restrain the multi-axis motion controller market growth during the forecast period from 2025 to 2035.
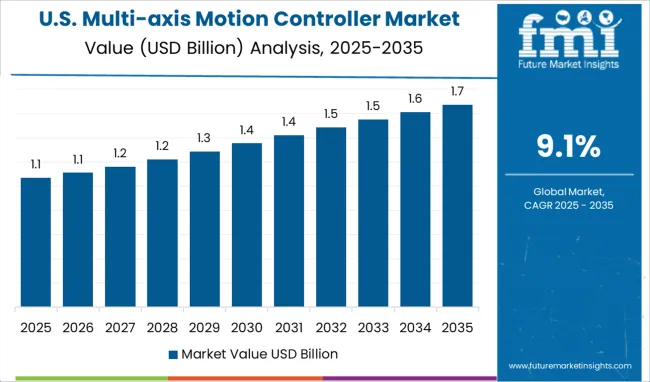
North America dominates the multi-axis motion controller market growth by acquiring a share of 33.7% in 2025. North America's multi-axis motion controller size rises due to rising production, accounting in the region.
This region has seen a rise in the investments made in the machinery production field, which has in turn led to an increase in the demand for the multi-axis motion controller. Hence, key players in the multi-axis motion controller market are willing to make huge investments in the manufacturing sector in the North American region.
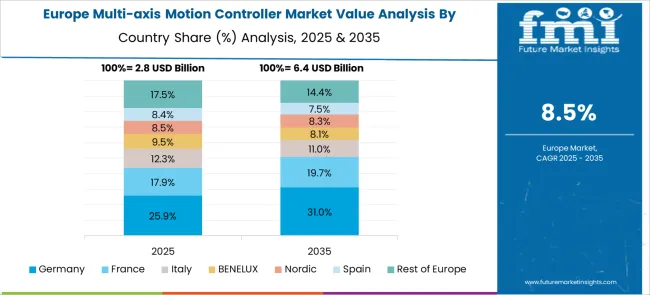
The Europe region is expected to show a growing trend in the multi-axis motion controller market future trends by acquiring 23.6% of the share of the multi-axis motion controller market size all around the globe during the forecast period from 2025 to 2035.
The packaging and labeling sector of the multi-axis motion controller market is estimated to show a high growth rate in the region likely to increase the sales of multi-axis motion controller in the coming year.
How is the Start-up Ecosystem in the Multi-axis Motion Controller Market?
The automobile sectors are the primary factor that rises the multi-axis motion controller market size wider with its new innovative and high-tech adoption. As per the latest and future trends, the multi-axis motion controller is better to supply power by utilizing both single and multi-axis controllers.
It also innovates remote diagnostic services, simplifies networks, is scalable, and is more flexible than other motion controller. The performance of the multi-axis is far better and are superior ultra-compact motion controller that is likely to grow high in the coming forecast period from 2025 to 2035.
The multi-axis motion controller startups are including a touch screen interface and the management of complex motion easily.
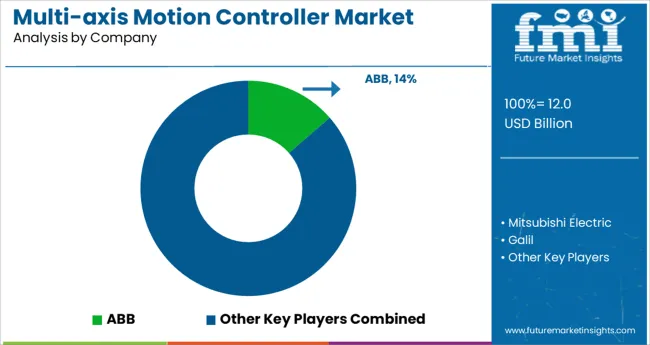
Some of the major players in the multi-axis motion control market are:-
These key players are contributing lion’s share while focusing and contributing their efforts on various technical methodologies and adoption including mergers, partnerships, collaborations, acquisitions, and others.
| Report Attribute | Details |
|---|---|
| Growth Rate | CAGR of 9.1% from 2025 to 2035 |
| Base Year for Estimation | 2024 |
| Historical Data | 2020 to 2024 |
| Forecast Period | 2025 to 2035 |
| Quantitative Units | Revenue in USD Million and CAGR from 2025 to 2035 |
| Report Coverage | Revenue Forecast, Volume Forecast, Company Ranking, Competitive Landscape, Growth Factors, Trends, and Pricing Analysis |
| Segments Covered | Application, Product Type, End User, Region |
| Regions Covered | North America; Latin America; Europe; East Asia; South Asia; Oceania; Middle East and Africa |
| Key Countries Profiled | USA, Canada, Brazil, Argentina, Germany, United Kingdom, France, Spain, Italy, Nordics, BENELUX, Australia & New Zealand, China, India, ASIAN, GCC Countries, South Africa |
| Key Companies Profiled | ABB; Mitsubishi Electric; Galil; Parker Hannifin; Bosch Rexroth |
| Customization | Available Upon Request |
The global multi-axis motion controller market is estimated to be valued at USD 12.0 billion in 2025.
It is projected to reach USD 28.8 billion by 2035.
The market is expected to grow at a 9.1% CAGR between 2025 and 2035.
The key product types are machine tools, packaging and labeling, material handling, semiconductor and others.
robotics and cnc segment is expected to dominate with a 38.2% industry share in 2025.


Our Research Products

The "Full Research Suite" delivers actionable market intel, deep dives on markets or technologies, so clients act faster, cut risk, and unlock growth.

The Leaderboard benchmarks and ranks top vendors, classifying them as Established Leaders, Leading Challengers, or Disruptors & Challengers.

Locates where complements amplify value and substitutes erode it, forecasting net impact by horizon

We deliver granular, decision-grade intel: market sizing, 5-year forecasts, pricing, adoption, usage, revenue, and operational KPIs—plus competitor tracking, regulation, and value chains—across 60 countries broadly.

Spot the shifts before they hit your P&L. We track inflection points, adoption curves, pricing moves, and ecosystem plays to show where demand is heading, why it is changing, and what to do next across high-growth markets and disruptive tech

Real-time reads of user behavior. We track shifting priorities, perceptions of today’s and next-gen services, and provider experience, then pace how fast tech moves from trial to adoption, blending buyer, consumer, and channel inputs with social signals (#WhySwitch, #UX).

Partner with our analyst team to build a custom report designed around your business priorities. From analysing market trends to assessing competitors or crafting bespoke datasets, we tailor insights to your needs.
Supplier Intelligence
Discovery & Profiling
Capacity & Footprint
Performance & Risk
Compliance & Governance
Commercial Readiness
Who Supplies Whom
Scorecards & Shortlists
Playbooks & Docs
Category Intelligence
Definition & Scope
Demand & Use Cases
Cost Drivers
Market Structure
Supply Chain Map
Trade & Policy
Operating Norms
Deliverables
Buyer Intelligence
Account Basics
Spend & Scope
Procurement Model
Vendor Requirements
Terms & Policies
Entry Strategy
Pain Points & Triggers
Outputs
Pricing Analysis
Benchmarks
Trends
Should-Cost
Indexation
Landed Cost
Commercial Terms
Deliverables
Brand Analysis
Positioning & Value Prop
Share & Presence
Customer Evidence
Go-to-Market
Digital & Reputation
Compliance & Trust
KPIs & Gaps
Outputs
Full Research Suite comprises of:
Market outlook & trends analysis
Interviews & case studies
Strategic recommendations
Vendor profiles & capabilities analysis
5-year forecasts
8 regions and 60+ country-level data splits
Market segment data splits
12 months of continuous data updates
DELIVERED AS:
PDF EXCEL ONLINE
Motion Control Software in Robotics Market Size and Share Forecast Outlook 2025 to 2035
Motion Simulation Market Size and Share Forecast Outlook 2025 to 2035
Motion Preservation Devices Market Size and Share Forecast Outlook 2025 to 2035
Motion Control Centers Market by Component, Deployment Mode, Mode & Region Forecast till 2025 to 2035
Motion Stimulation Therapy Market Trends – Growth & Forecast 2024-2034
Motion Sensors Market
Motion Controllers Market
Emotion Detection and Recognition Market
In Motion Dimensioning Systems Market Analysis Size and Share Forecast Outlook 2025 to 2035
Promotional Packaging Market Size and Share Forecast Outlook 2025 to 2035
3D Motion Capture Market by System, Component, Application & Region Forecast till 2035
Competitive Overview of Promotional Packaging Market Share
Promotion Bins Market
Spinal Motion-Preservation Devices Market
Safety Motion Control System Market
Weigh in Motion System Market - Trends & Forecast 2025 to 2035
Continuous Motion Cartoner Market Size and Share Forecast Outlook 2025 to 2035
Social and Emotional Learning Market Forecast Outlook 2025 to 2035
Radiotherapy Motion Management Market
Automotive Weigh-In Motion Market Size and Share Forecast Outlook 2025 to 2035

Thank you!
You will receive an email from our Business Development Manager. Please be sure to check your SPAM/JUNK folder too.
Chat With
MaRIA