Reports

- Global Locations -

Headquarters

Future Market Insights, Inc.

Christiana Corporate, 200
Continental Drive, Suite 401,
Newark, Delaware - 19713,
United States

T: +1-845-579-5705

Americas

Future Market Insights, Inc.

616 Corporate Way, Suite 2-9018,
Valley Cottage, NY 10989, United States

T: +1-347-918-3531

MEA

Future Market Insights

1602-6 Jumeirah Bay X2 Tower, Plot No: JLT-PH2-X2A,
Jumeirah Lakes Towers, Dubai,
United Arab Emirates

Europe

Future Market Insights

3rd Floor, 207 Regent Street,
W1B 3HH London
United Kingdom

T: + 44 (0) 20 8123 9659
D: +44 (0) 20 3287 4268

Asia Pacific

Future Market Insights

IndiaLand Global Tech Park, Unit UG-1, Behind Grand HighStreet, Phase 1, Hinjawadi, MH, Pune – 411057, India

Social and Emotional Learning Market Outlook from 2024 to 2034

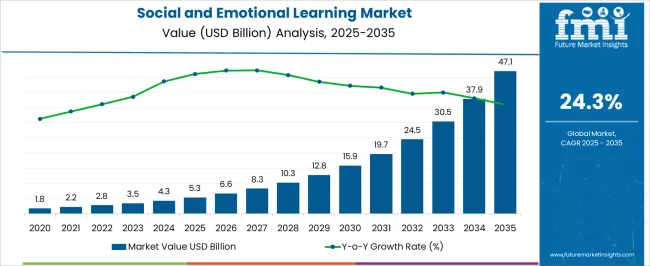
The social and emotional learning market is projected to be worth US$ 4.3 billion in 2024. The market is anticipated to reach US$ 38.0 billion by 2034. The market is further expected to surge at a CAGR of 24.3% during the forecast period 2024 to 2034.

Attributes Key Insights
Social and Emotional Learning Market Estimated Size in 2024 US$ 4.3 billion
Projected Market Value in 2034 US$ 38.0 billion
Value-based CAGR from 2024 to 2034 24.3%

Don't pay for what you don't need

Customize your report by selecting specific countries or regions and save 30%!

Key Market Trends and Highlights

There is growing demand for evidence based social and emotional learning programs and interventions, as research continues to demonstrate the positive impact of social and emotional learning on student outcomes. Educators and policymakers are seeking validated strategies that effectively promote social and emotional skills.

  • There is an increasing recognition of the importance of involving parents and communities in supporting social and emotional learning initiatives. Schools are partnering with parents and community organizations to create a cohesive approach to promoting social and emotional development across different contexts.
  • Employers are increasingly valuing social and emotional skills in addition to academic qualifications. There is a growing emphasis on integrating social and emotional learning into educational programs to equip students with the necessary skills for success in the workforce and in life.
  • The recognition of the universality of social and emotional skills transcends geographical boundaries. The programs are being adopted and adapted in various cultural contexts around the world, driving the global expansion of the market.

2019 to 2023 Historical Analysis vs. 2024 to 2034 Market Forecast Projections

The scope for social and emotional learning rose at a 28.4% CAGR between 2019 and 2023. The global market is anticipated to grow at a moderate CAGR of 24.3% over the forecast period 2024 to 2034.

There was an increasing awareness of the importance of social and emotional learning in education, during the historical period. Schools, educators, parents, and policymakers recognized the value of social and emotional learning in promoting well being, academic success, and long term outcomes of the students.

Many educational systems and jurisdictions might have integrated social and emotional learning principles and programs into their curriculum and educational policies. The integration had driven widespread adoption and implementation of social and emotional learning initiatives across diverse educational settings.

The integration of technology into education is expected to continue, offering new opportunities for delivering and enhancing social and emotional learning programs during the forecast period. Advancements in educational technology, such as artificial intelligence, personalized learning platforms, and immersive simulations, are expected to revolutionize the way the learning is delivered and experienced.

Continued policy support and funding initiatives at the local, national, and international levels is expected to fuel the market growth. Governments, non-profit organizations, and philanthropic foundations may invest in the initiatives as part of broader education reform efforts aimed at promoting equity, inclusion, and holistic student development.

Ronak Shah
Ronak Shah

Principal Consultant

Talk to Analyst

Find your sweet spots for generating winning opportunities in this market.

Social and Emotional Learning Market Key Drivers

There is a growing recognition of the importance of social and emotional skills in education and personal development. Schools, parents, and policymakers are placing greater emphasis on social and emotional learning as a crucial component of a well-rounded education.

  • There is a heightened focus on promoting emotional well-being and resilience, with rising concerns about mental health issues among children and adolescents. Social and emotional learning programs offer strategies and tools to support mental health and mitigate issues like anxiety, depression, and stress.
  • Many educational institutions are integrating social and emotional learning into their curriculum and educational frameworks. The programs are not only seen as beneficial for personal development of the students but also for improving academic performance and classroom behavior.
  • The integration of technology into education has opened up new avenues for delivering social and emotional learning programs. Digital platforms, apps, and online resources make the learning more accessible and scalable, allowing students to engage with social and emotional learning content both in and out of the classroom.

Challenges in the Social and Emotional Learning Market

Resistance from traditional education systems, stakeholders, and policymakers who prioritize academic achievement over social and emotional development may slow the adoption of social and emotional learning programs. Convincing stakeholders of the importance of learning and overcoming entrenched attitudes can be challenging.

  • Limited financial resources, budget cuts in education, and competing priorities may hinder the implementation of the initiatives. Schools and organizations may struggle to allocate funds and resources to support comprehensive social and emotional learning programs, especially in economically disadvantaged communities.
  • The effective implementation of these programs requires knowledgeable and skilled educators who can create supportive learning environments and facilitate meaningful interactions. The lack of adequate teacher training, professional development opportunities, and ongoing support systems may hinder the successful integration of social and emotional learning into classroom practices.
  • Assessing social and emotional skills is complex and often subjective, making it challenging to evaluate the effectiveness of the programs accurately. The absence of standardized assessment tools, reliable metrics, and rigorous evaluation frameworks may undermine efforts to measure and demonstrate the impact of learning interventions.

Get the data you need at a Fraction of the cost

Personalize your report by choosing insights you need
and save 40%!

Comparative View of Adjacent Industries

Future Market Insights has compared two other industries, smart education and learning market, and deep learning market. Government agencies and non profit organizations are increasingly supporting social and emotional learning initiatives through funding, policy frameworks, and advocacy efforts, which support helps drive the growth of the market by promoting awareness, research, and implementation of effective programs.

Rapid advancements in technology, including artificial intelligence, machine learning, augmented reality & virtual reality, and natural language processing, are transforming the landscape of education. The technologies enable the development of innovative learning solutions and personalized learning experiences that cater to individual needs and preferences.

The proliferation of big data and the need to extract meaningful insights from large and complex datasets are driving the demand for deep learning solutions. Deep learning algorithms excel at processing and analyzing vast amounts of data, uncovering patterns, and making predictions, making them invaluable for businesses and organizations seeking to leverage data driven decision making.

Social and Emotional Learning Market:

Attributes Social and Emotional Learning Market
CAGR from 2024 to 2034 24.3%
Key Trends
  • Efforts to address diversity, equity, and inclusion within social and emotional learning curricula and practices present opportunities for the development of tailored programs that meet the needs of diverse student populations.
  • Investing in teacher training and professional development in social and emotional learning is becoming a priority for many educational institutions.
Opportunity
  • Integrating mental health expertise into social and emotional learning programs strengthens support systems for students and fosters holistic approaches to well being.
  • Data driven approaches help optimize the effectiveness of social and emotional learning initiatives and demonstrate outcomes to stakeholders.

Smart Education and Learning Market:

Attributes Smart Education and Learning Market
CAGR from 2023 to 2033 18.9%
Key Trends
  • The proliferation of e-learning platforms, online courses, and virtual classrooms is driving the growth of the market.
  • Smart education solutions leverage data analytics, learning algorithms, and predictive analytics to tailor learning experiences to individual learning styles, preferences, and proficiency levels.
Opportunity
  • Smart education platforms offer opportunities for individuals to acquire new skills, update existing knowledge, and pursue career advancement in diverse fields and industries.
  • Gamification techniques and interactive learning experiences are enhancing learner engagement, motivation, and retention.

Deep Learning Market:

Attributes Deep Learning Market
CAGR from 2022 to 2032 26.4%
Key Trends
  • Deep learning, a subset of machine learning, has seen remarkable advancements in recent years, driven by breakthroughs in AI research, algorithms, and computing power.
  • Deep learning techniques find applications across a wide range of industries, including healthcare, finance, retail, automotive, and manufacturing.
Opportunity
  • The development of novel neural network architectures, such as convolutional neural networks, recurrent neural networks, and transformers, continues to drive the evolution of deep learning.
  • The availability of powerful computing infrastructure, including graphics processing units, tensor processing units, and cloud based resources, accelerates the training and deployment of deep learning models.

Country-wise Insights

The below table showcases revenues in terms of the top 5 leading countries, spearheaded by Korea and Japan. The countries are expected to lead the market through 2034.

Countries Forecast CAGRs from 2024 to 2034
The United States 24.5%
The United Kingdom 25.4%
China 24.9%
Japan 25.6%
Korea 26.0%

Recognition of the Importance of Social and Emotional Learning Driving the Market in the United States

The social and emotional learning market in the United States expected to expand at a CAGR of 24.5% through 2034. There is a growing recognition among educators, policymakers, and parents in the United States of the importance of social and emotional learning in supporting the overall well-being and academic success of the students. The acknowledgment is driving increased interest and investment in the learning programs and initiatives.

There is a heightened focus on mental health awareness and support in the United States, particularly among children and adolescents. The learning programs are viewed as essential tools for addressing mental health issues, such as stress, anxiety, depression, and social isolation, and promoting resilience and coping skills.

Inclusion in Educational Policy and Frameworks to Accelerate Market Growth in the United Kingdom

The social and emotional learning market in the United Kingdom is anticipated to expand at a CAGR of 25.4% through 2034. The integration of social and emotional learning into educational policies and frameworks is gaining momentum in the United Kingdom.

National and local authorities are incorporating learning competencies into curriculum guidelines, educational standards, and school improvement strategies, driving the systematic implementation of the learning initiatives.

Research studies and evidence from educational research institutions highlight the positive impact of social and emotional learning on student outcomes, including academic achievement, emotional regulation, interpersonal relationships, and overall well-being.

The availability of research based evidence supports the adoption and scaling of these programs in schools and educational settings across the United Kingdom.

Integration with Chinese Cultural Values Spearhead the Market in China

Social and emotional learning trends in China are taking a turn for the better. A 24.9% CAGR is forecast for the country from 2024 to 2034. Social and emotional learning programs in China are being adapted to align with Chinese cultural values, norms, and educational philosophies.

Customized social and emotional learning curricula, resources, and activities reflect the unique socio cultural context of China and resonate with the needs and preferences of Chinese students, educators, and families.

Collaboration between schools, community organizations, and mental health professionals is enhancing the delivery of social and emotional learning support to students in China. Partnerships with community based organizations, counseling services, and youth development programs extend the reach of learning initiatives and provide additional resources and support to students and families.
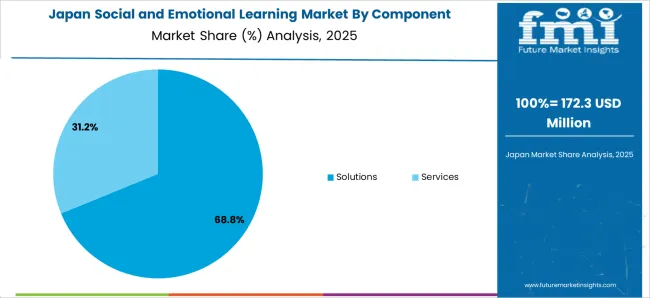
Shift in Educational Paradigm Fueling the Market in Japan

The social and emotional learning market in Japan is poised to expand at a CAGR of 25.6% through 2034. There is a shift in educational paradigm in Japan, towards holistic development and the cultivation of non-cognitive skills alongside academic achievement.

Social and emotional learning is increasingly valued as a key component of education, reflecting broader societal priorities and changing attitudes towards education.

Efforts to provide educators with training and professional development opportunities in social and emotional learning are expanding in Japan. Teacher training programs, workshops, and resources equip educators with the knowledge, skills, and strategies to integrate learning into their teaching practices and create supportive learning environments.
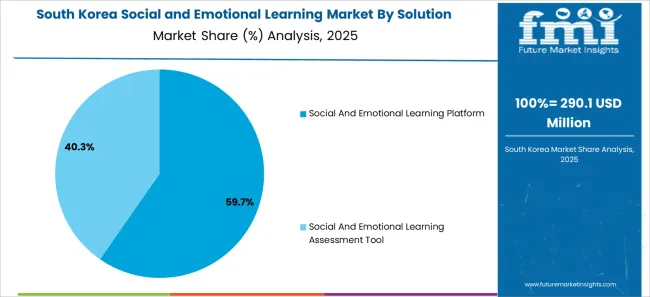
Parental Involvement and Engagement Driving the Demand in Korea

The social and emotional learning market in Korea is anticipated to expand at a CAGR of 26.0% through 2034. Involving parents, caregivers, and families in social and emotional learning initiatives is crucial for reinforcing social and emotional learning skills and promoting consistency between home and school environments.

Schools in Korea are engaging parents through workshops, family events, and communication channels to promote shared goals and reinforce the learning principles at home.

The integration of education technology and digital platforms into social and emotional learning programs is expanding in Korea. Digital resources, online platforms, and interactive tools enhance the accessibility, engagement, and effectiveness of social and emotional learning instruction, catering to diverse learning styles and preferences in the digital age.

Category-wise Insights

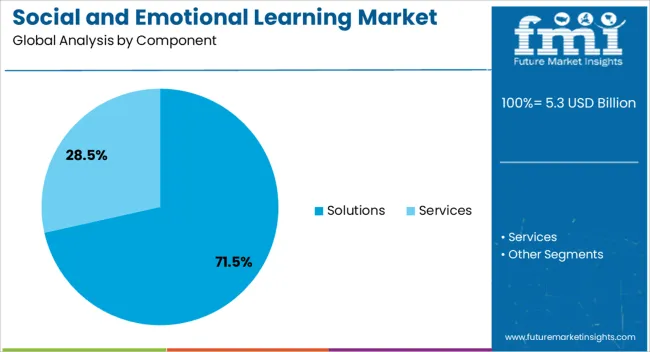
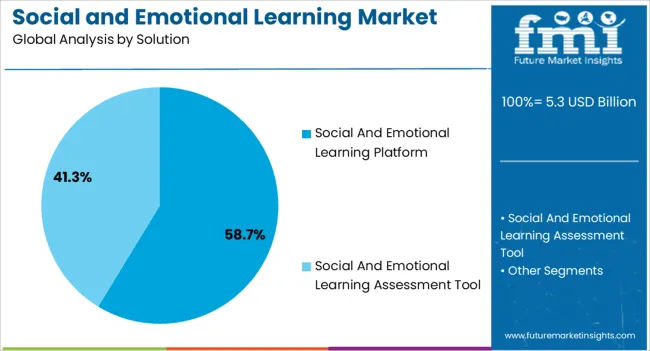
The below table highlights how solutions segment is projected to lead the market in terms of component, and is expected to account for a CAGR of 24.1% through 2034. Based on solution, the social and emotional learning platform segment is expected to account for a CAGR of 23.8% through 2034.

Category CAGR through 2034
Solutions 24.1%
Social and Emotional Learning Platform 23.8%

Solutions Claim High Demand for Social and Emotional Learning

Based on component, the solutions segment is expected to continue dominating the social and emotional learning market. The solutions segment encompasses a diverse range of the learning programs, platforms, and tools designed to promote social and emotional development among students.

The availability of comprehensive and customizable solutions tailored to the needs of different educational settings and student populations drives the growth of this segment.

The learning solutions are increasingly integrated into curriculum frameworks and instructional materials, offering educators structured and sequenced resources to support social and emotional learning in the classroom. The alignment of learning solutions with academic standards and educational goals enhances their relevance and adoption within schools and districts.

Social and Emotional Learning Platform Segment to Hold High Demand

In terms of solution, the social and emotional learning platform segment is expected to continue dominating the social and emotional learning market, attributed to several key factors.

The learning platforms offer comprehensive curriculum content, resources, and activities designed to promote social and emotional skills among students. The platforms provide educators with access to a wide range of instructional materials, lesson plans, assessments, and multimedia resources aligned with social and emotional learning standards and objectives.

The platforms incorporate customization and personalization features that enable educators to tailor learning interventions to the unique needs, preferences, and developmental levels of their students. Adaptive algorithms, content libraries, and assessment tools empower educators to create individualized learning pathways and activities that address specific social and emotional competencies.
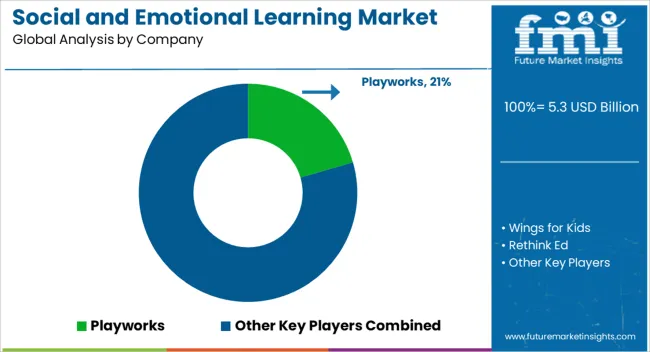
Competitive Landscape

The competitive landscape of the market is characterized by a diverse array of players, including education technology companies, publishers, non-profit organizations, research institutions, and government agencies.

Company Portfolio

  • CASEL is a leading organization dedicated to advancing the development and implementation of evidence based social and emotional learning programs and practices. CASEL develops learning standards, guidelines, and resources for educators, policymakers, and researchers. The company provides frameworks for integrating this learning into curriculum and school culture.
  • Panorama Education is an EdTech company focused on supporting schools and districts in measuring and improving student outcomes, including social emotional learning. Their platform allows educators to administer surveys to assess social emotional skills of the students and school climate. It provides data analytics and insights to inform intervention strategies and improve student wellbeing.

Key Coverage in the Social and Emotional Learning Industry Report

  • Social Emotional Learning Programs
  • SEL Curriculum Development
  • Emotional Intelligence Training
  • Social Skills Development
  • Mental Health Education
  • SEL Assessment Tools
  • Character Education Initiatives
  • Positive Psychology Practices
  • SEL Implementation Strategies
  • Mental Health and Wellness Services Market
  • Child and Adolescent Development Programs Market
  • Educational Psychology Services Market
  • Counseling and Therapy Services Market

Report Scope

Attribute Details
Estimated Market Size in 2024 US$ 4.3 billion
Projected Market Valuation in 2034 US$ 38.0 billion
Value-based CAGR 2024 to 2034 24.3%
Forecast Period 2024 to 2034
Historical Data Available for 2019 to 2023
Market Analysis Value in US$ billion
Key Regions Covered
  • North America
  • Latin America
  • Western Europe
  • Eastern Europe
  • South Asia and Pacific
  • East Asia
  • The Middle East & Africa
Key Market Segments Covered
  • Service
  • User
  • Type
  • Region
Key Countries Profiled
  • The United States
  • Canada
  • Brazil
  • Mexico
  • Germany
  • France
  • France
  • Spain
  • Italy
  • Russia
  • Poland
  • Czech Republic
  • Romania
  • India
  • Bangladesh
  • Australia
  • New Zealand
  • China
  • Japan
  • South Korea
  • GCC countries
  • South Africa
  • Israel
Key Companies Profiled
  • Playworks
  • Wings for Kids
  • Rethink Ed
  • Move This World
  • Positive Action
  • Brighten Learning
  • Aperture Education
  • Taproot Learning
  • MeandMine
  • Everyday Speech
  • CASEL
  • PANORAMA Education

Segmentation Analysis of the Social and Emotional Learning Market

By Component:

  • Solutions
  • Services

By Solution:

  • Social and Emotional Learning Platform
  • Social and Emotional Learning Assessment Tool

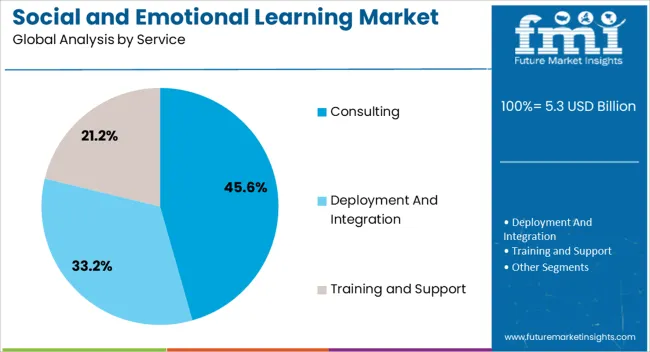
By Service:

  • Consulting
  • Deployment and Integration
  • Training and Support

By User:

  • Pre-K
  • Elementary School
  • Middle and High School

By Type:

  • Web Based
  • Application

By Region:

  • North America
  • Latin America
  • Western Europe
  • Eastern Europe
  • South Asia and Pacific
  • East Asia
  • The Middle East and Africa

Frequently Asked Questions

What is the anticipated value of the Social and Emotional Learning market in 2024?

The social and emotional learning market is projected to reach a valuation of US$ 4.3 Billion in 2024.

What is the expected CAGR for the Social and Emotional Learning market until 2034?

The social and emotional learning industry is set to expand by a CAGR of 24.3% through 2034.

How much valuation is projected for the Social and Emotional Learning market in 2034?

The social and emotional learning market is forecast to reach US$ 38.0 Billion by 2034.

Which country is projected to lead the Social and Emotional Learning market?

Japan is expected to be the top performing market, exhibiting a CAGR of 25.6% through 2034.

Which is the dominant component in the Social and Emotional Learning domain?

Solutions segment is preferred, and is expected to account for a CAGR of 24.1% through 2034.

Table of Content

1. Executive Summary

    1.1. Global Market Outlook

    1.2. Demand-side Trends

    1.3. Supply-side Trends

    1.4. Technology Roadmap Analysis

    1.5. Analysis and Recommendations

2. Market Overview

    2.1. Market Coverage / Taxonomy

    2.2. Market Definition / Scope / Limitations

3. Market Background

    3.1. Market Dynamics

        3.1.1. Drivers

        3.1.2. Restraints

        3.1.3. Opportunity

        3.1.4. Trends

    3.2. Scenario Forecast

        3.2.1. Demand in Optimistic Scenario

        3.2.2. Demand in Likely Scenario

        3.2.3. Demand in Conservative Scenario

    3.3. Opportunity Map Analysis

    3.4. Investment Feasibility Matrix

    3.5. PESTLE and Porter’s Analysis

    3.6. Regulatory Landscape

        3.6.1. By Key Regions

        3.6.2. By Key Countries

    3.7. Regional Parent Market Outlook

4. Global Market Analysis 2019 to 2023 and Forecast, 2024 to 2034

    4.1. Historical Market Size Value (US$ Million) Analysis, 2019 to 2023

    4.2. Current and Future Market Size Value (US$ Million) Projections, 2024 to 2034

        4.2.1. Y-o-Y Growth Trend Analysis

        4.2.2. Absolute $ Opportunity Analysis

5. Global Market Analysis 2019 to 2023 and Forecast 2024 to 2034, By Component

    5.1. Introduction / Key Findings

    5.2. Historical Market Size Value (US$ Million) Analysis By Component, 2019 to 2023

    5.3. Current and Future Market Size Value (US$ Million) Analysis and Forecast By Component, 2024 to 2034

        5.3.1. Solutions

        5.3.2. Services

    5.4. Y-o-Y Growth Trend Analysis By Component, 2019 to 2023

    5.5. Absolute $ Opportunity Analysis By Component, 2024 to 2034

6. Global Market Analysis 2019 to 2023 and Forecast 2024 to 2034, By Solution

    6.1. Introduction / Key Findings

    6.2. Historical Market Size Value (US$ Million) Analysis By Solution, 2019 to 2023

    6.3. Current and Future Market Size Value (US$ Million) Analysis and Forecast By Solution, 2024 to 2034

        6.3.1. Platform

        6.3.2. Assessment Tool

    6.4. Y-o-Y Growth Trend Analysis By Solution, 2019 to 2023

    6.5. Absolute $ Opportunity Analysis By Solution, 2024 to 2034

7. Global Market Analysis 2019 to 2023 and Forecast 2024 to 2034, By Service

    7.1. Introduction / Key Findings

    7.2. Historical Market Size Value (US$ Million) Analysis By Service, 2019 to 2023

    7.3. Current and Future Market Size Value (US$ Million) Analysis and Forecast By Service, 2024 to 2034

        7.3.1. Consulting

        7.3.2. Deployment and Integration

        7.3.3. Training and Support

    7.4. Y-o-Y Growth Trend Analysis By Service, 2019 to 2023

    7.5. Absolute $ Opportunity Analysis By Service, 2024 to 2034

8. Global Market Analysis 2019 to 2023 and Forecast 2024 to 2034, By User

    8.1. Introduction / Key Findings

    8.2. Historical Market Size Value (US$ Million) Analysis By User, 2019 to 2023

    8.3. Current and Future Market Size Value (US$ Million) Analysis and Forecast By User, 2024 to 2034

        8.3.1. Pre-K

        8.3.2. Elementary School

        8.3.3. Middle & High School

    8.4. Y-o-Y Growth Trend Analysis By User, 2019 to 2023

    8.5. Absolute $ Opportunity Analysis By User, 2024 to 2034

9. Global Market Analysis 2019 to 2023 and Forecast 2024 to 2034, By Type

    9.1. Introduction / Key Findings

    9.2. Historical Market Size Value (US$ Million) Analysis By Type, 2019 to 2023

    9.3. Current and Future Market Size Value (US$ Million) Analysis and Forecast By Type, 2024 to 2034

        9.3.1. Web-Based

        9.3.2. Application

    9.4. Y-o-Y Growth Trend Analysis By Type, 2019 to 2023

    9.5. Absolute $ Opportunity Analysis By Type, 2024 to 2034

10. Global Market Analysis 2019 to 2023 and Forecast 2024 to 2034, By Region

    10.1. Introduction

    10.2. Historical Market Size Value (US$ Million) Analysis By Region, 2019 to 2023

    10.3. Current Market Size Value (US$ Million) Analysis and Forecast By Region, 2024 to 2034

        10.3.1. North America

        10.3.2. Latin America

        10.3.3. Western Europe

        10.3.4. Eastern Europe

        10.3.5. South Asia and Pacific

        10.3.6. East Asia

        10.3.7. Middle East and Africa

    10.4. Market Attractiveness Analysis By Region

11. North America Market Analysis 2019 to 2023 and Forecast 2024 to 2034, By Country

    11.1. Historical Market Size Value (US$ Million) Trend Analysis By Market Taxonomy, 2019 to 2023

    11.2. Market Size Value (US$ Million) Forecast By Market Taxonomy, 2024 to 2034

        11.2.1. By Country

            11.2.1.1. USA

            11.2.1.2. Canada

        11.2.2. By Component

        11.2.3. By Solution

        11.2.4. By Service

        11.2.5. By User

        11.2.6. By Type

    11.3. Market Attractiveness Analysis

        11.3.1. By Country

        11.3.2. By Component

        11.3.3. By Solution

        11.3.4. By Service

        11.3.5. By User

        11.3.6. By Type

    11.4. Key Takeaways

12. Latin America Market Analysis 2019 to 2023 and Forecast 2024 to 2034, By Country

    12.1. Historical Market Size Value (US$ Million) Trend Analysis By Market Taxonomy, 2019 to 2023

    12.2. Market Size Value (US$ Million) Forecast By Market Taxonomy, 2024 to 2034

        12.2.1. By Country

            12.2.1.1. Brazil

            12.2.1.2. Mexico

            12.2.1.3. Rest of Latin America

        12.2.2. By Component

        12.2.3. By Solution

        12.2.4. By Service

        12.2.5. By User

        12.2.6. By Type

    12.3. Market Attractiveness Analysis

        12.3.1. By Country

        12.3.2. By Component

        12.3.3. By Solution

        12.3.4. By Service

        12.3.5. By User

        12.3.6. By Type

    12.4. Key Takeaways

13. Western Europe Market Analysis 2019 to 2023 and Forecast 2024 to 2034, By Country

    13.1. Historical Market Size Value (US$ Million) Trend Analysis By Market Taxonomy, 2019 to 2023

    13.2. Market Size Value (US$ Million) Forecast By Market Taxonomy, 2024 to 2034

        13.2.1. By Country

            13.2.1.1. Germany

            13.2.1.2. UK

            13.2.1.3. France

            13.2.1.4. Spain

            13.2.1.5. Italy

            13.2.1.6. Rest of Western Europe

        13.2.2. By Component

        13.2.3. By Solution

        13.2.4. By Service

        13.2.5. By User

        13.2.6. By Type

    13.3. Market Attractiveness Analysis

        13.3.1. By Country

        13.3.2. By Component

        13.3.3. By Solution

        13.3.4. By Service

        13.3.5. By User

        13.3.6. By Type

    13.4. Key Takeaways

14. Eastern Europe Market Analysis 2019 to 2023 and Forecast 2024 to 2034, By Country

    14.1. Historical Market Size Value (US$ Million) Trend Analysis By Market Taxonomy, 2019 to 2023

    14.2. Market Size Value (US$ Million) Forecast By Market Taxonomy, 2024 to 2034

        14.2.1. By Country

            14.2.1.1. Poland

            14.2.1.2. Russia

            14.2.1.3. Czech Republic

            14.2.1.4. Romania

            14.2.1.5. Rest of Eastern Europe

        14.2.2. By Component

        14.2.3. By Solution

        14.2.4. By Service

        14.2.5. By User

        14.2.6. By Type

    14.3. Market Attractiveness Analysis

        14.3.1. By Country

        14.3.2. By Component

        14.3.3. By Solution

        14.3.4. By Service

        14.3.5. By User

        14.3.6. By Type

    14.4. Key Takeaways

15. South Asia and Pacific Market Analysis 2019 to 2023 and Forecast 2024 to 2034, By Country

    15.1. Historical Market Size Value (US$ Million) Trend Analysis By Market Taxonomy, 2019 to 2023

    15.2. Market Size Value (US$ Million) Forecast By Market Taxonomy, 2024 to 2034

        15.2.1. By Country

            15.2.1.1. India

            15.2.1.2. Bangladesh

            15.2.1.3. Australia

            15.2.1.4. New Zealand

            15.2.1.5. Rest of South Asia and Pacific

        15.2.2. By Component

        15.2.3. By Solution

        15.2.4. By Service

        15.2.5. By User

        15.2.6. By Type

    15.3. Market Attractiveness Analysis

        15.3.1. By Country

        15.3.2. By Component

        15.3.3. By Solution

        15.3.4. By Service

        15.3.5. By User

        15.3.6. By Type

    15.4. Key Takeaways

16. East Asia Market Analysis 2019 to 2023 and Forecast 2024 to 2034, By Country

    16.1. Historical Market Size Value (US$ Million) Trend Analysis By Market Taxonomy, 2019 to 2023

    16.2. Market Size Value (US$ Million) Forecast By Market Taxonomy, 2024 to 2034

        16.2.1. By Country

            16.2.1.1. China

            16.2.1.2. Japan

            16.2.1.3. South Korea

        16.2.2. By Component

        16.2.3. By Solution

        16.2.4. By Service

        16.2.5. By User

        16.2.6. By Type

    16.3. Market Attractiveness Analysis

        16.3.1. By Country

        16.3.2. By Component

        16.3.3. By Solution

        16.3.4. By Service

        16.3.5. By User

        16.3.6. By Type

    16.4. Key Takeaways

17. Middle East and Africa Market Analysis 2019 to 2023 and Forecast 2024 to 2034, By Country

    17.1. Historical Market Size Value (US$ Million) Trend Analysis By Market Taxonomy, 2019 to 2023

    17.2. Market Size Value (US$ Million) Forecast By Market Taxonomy, 2024 to 2034

        17.2.1. By Country

            17.2.1.1. GCC Countries

            17.2.1.2. South Africa

            17.2.1.3. Israel

            17.2.1.4. Rest of MEA

        17.2.2. By Component

        17.2.3. By Solution

        17.2.4. By Service

        17.2.5. By User

        17.2.6. By Type

    17.3. Market Attractiveness Analysis

        17.3.1. By Country

        17.3.2. By Component

        17.3.3. By Solution

        17.3.4. By Service

        17.3.5. By User

        17.3.6. By Type

    17.4. Key Takeaways

18. Key Countries Market Analysis

    18.1. USA

        18.1.1. Pricing Analysis

        18.1.2. Market Share Analysis, 2023

            18.1.2.1. By Component

            18.1.2.2. By Solution

            18.1.2.3. By Service

            18.1.2.4. By User

            18.1.2.5. By Type

    18.2. Canada

        18.2.1. Pricing Analysis

        18.2.2. Market Share Analysis, 2023

            18.2.2.1. By Component

            18.2.2.2. By Solution

            18.2.2.3. By Service

            18.2.2.4. By User

            18.2.2.5. By Type

    18.3. Brazil

        18.3.1. Pricing Analysis

        18.3.2. Market Share Analysis, 2023

            18.3.2.1. By Component

            18.3.2.2. By Solution

            18.3.2.3. By Service

            18.3.2.4. By User

            18.3.2.5. By Type

    18.4. Mexico

        18.4.1. Pricing Analysis

        18.4.2. Market Share Analysis, 2023

            18.4.2.1. By Component

            18.4.2.2. By Solution

            18.4.2.3. By Service

            18.4.2.4. By User

            18.4.2.5. By Type

    18.5. Germany

        18.5.1. Pricing Analysis

        18.5.2. Market Share Analysis, 2023

            18.5.2.1. By Component

            18.5.2.2. By Solution

            18.5.2.3. By Service

            18.5.2.4. By User

            18.5.2.5. By Type

    18.6. UK

        18.6.1. Pricing Analysis

        18.6.2. Market Share Analysis, 2023

            18.6.2.1. By Component

            18.6.2.2. By Solution

            18.6.2.3. By Service

            18.6.2.4. By User

            18.6.2.5. By Type

    18.7. France

        18.7.1. Pricing Analysis

        18.7.2. Market Share Analysis, 2023

            18.7.2.1. By Component

            18.7.2.2. By Solution

            18.7.2.3. By Service

            18.7.2.4. By User

            18.7.2.5. By Type

    18.8. Spain

        18.8.1. Pricing Analysis

        18.8.2. Market Share Analysis, 2023

            18.8.2.1. By Component

            18.8.2.2. By Solution

            18.8.2.3. By Service

            18.8.2.4. By User

            18.8.2.5. By Type

    18.9. Italy

        18.9.1. Pricing Analysis

        18.9.2. Market Share Analysis, 2023

            18.9.2.1. By Component

            18.9.2.2. By Solution

            18.9.2.3. By Service

            18.9.2.4. By User

            18.9.2.5. By Type

    18.10. Poland

        18.10.1. Pricing Analysis

        18.10.2. Market Share Analysis, 2023

            18.10.2.1. By Component

            18.10.2.2. By Solution

            18.10.2.3. By Service

            18.10.2.4. By User

            18.10.2.5. By Type

    18.11. Russia

        18.11.1. Pricing Analysis

        18.11.2. Market Share Analysis, 2023

            18.11.2.1. By Component

            18.11.2.2. By Solution

            18.11.2.3. By Service

            18.11.2.4. By User

            18.11.2.5. By Type

    18.12. Czech Republic

        18.12.1. Pricing Analysis

        18.12.2. Market Share Analysis, 2023

            18.12.2.1. By Component

            18.12.2.2. By Solution

            18.12.2.3. By Service

            18.12.2.4. By User

            18.12.2.5. By Type

    18.13. Romania

        18.13.1. Pricing Analysis

        18.13.2. Market Share Analysis, 2023

            18.13.2.1. By Component

            18.13.2.2. By Solution

            18.13.2.3. By Service

            18.13.2.4. By User

            18.13.2.5. By Type

    18.14. India

        18.14.1. Pricing Analysis

        18.14.2. Market Share Analysis, 2023

            18.14.2.1. By Component

            18.14.2.2. By Solution

            18.14.2.3. By Service

            18.14.2.4. By User

            18.14.2.5. By Type

    18.15. Bangladesh

        18.15.1. Pricing Analysis

        18.15.2. Market Share Analysis, 2023

            18.15.2.1. By Component

            18.15.2.2. By Solution

            18.15.2.3. By Service

            18.15.2.4. By User

            18.15.2.5. By Type

    18.16. Australia

        18.16.1. Pricing Analysis

        18.16.2. Market Share Analysis, 2023

            18.16.2.1. By Component

            18.16.2.2. By Solution

            18.16.2.3. By Service

            18.16.2.4. By User

            18.16.2.5. By Type

    18.17. New Zealand

        18.17.1. Pricing Analysis

        18.17.2. Market Share Analysis, 2023

            18.17.2.1. By Component

            18.17.2.2. By Solution

            18.17.2.3. By Service

            18.17.2.4. By User

            18.17.2.5. By Type

    18.18. China

        18.18.1. Pricing Analysis

        18.18.2. Market Share Analysis, 2023

            18.18.2.1. By Component

            18.18.2.2. By Solution

            18.18.2.3. By Service

            18.18.2.4. By User

            18.18.2.5. By Type

    18.19. Japan

        18.19.1. Pricing Analysis

        18.19.2. Market Share Analysis, 2023

            18.19.2.1. By Component

            18.19.2.2. By Solution

            18.19.2.3. By Service

            18.19.2.4. By User

            18.19.2.5. By Type

    18.20. South Korea

        18.20.1. Pricing Analysis

        18.20.2. Market Share Analysis, 2023

            18.20.2.1. By Component

            18.20.2.2. By Solution

            18.20.2.3. By Service

            18.20.2.4. By User

            18.20.2.5. By Type

    18.21. GCC Countries

        18.21.1. Pricing Analysis

        18.21.2. Market Share Analysis, 2023

            18.21.2.1. By Component

            18.21.2.2. By Solution

            18.21.2.3. By Service

            18.21.2.4. By User

            18.21.2.5. By Type

    18.22. South Africa

        18.22.1. Pricing Analysis

        18.22.2. Market Share Analysis, 2023

            18.22.2.1. By Component

            18.22.2.2. By Solution

            18.22.2.3. By Service

            18.22.2.4. By User

            18.22.2.5. By Type

    18.23. Israel

        18.23.1. Pricing Analysis

        18.23.2. Market Share Analysis, 2023

            18.23.2.1. By Component

            18.23.2.2. By Solution

            18.23.2.3. By Service

            18.23.2.4. By User

            18.23.2.5. By Type

19. Market Structure Analysis

    19.1. Competition Dashboard

    19.2. Competition Benchmarking

    19.3. Market Share Analysis of Top Players

        19.3.1. By Regional

        19.3.2. By Component

        19.3.3. By Solution

        19.3.4. By Service

        19.3.5. By User

        19.3.6. By Type

20. Competition Analysis

    20.1. Competition Deep Dive

        20.1.1. Playworks

            20.1.1.1. Overview

            20.1.1.2. Product Portfolio

            20.1.1.3. Profitability by Market Segments

            20.1.1.4. Sales Footprint

            20.1.1.5. Strategy Overview

                20.1.1.5.1. Marketing Strategy

        20.1.2. Wings for Kids

            20.1.2.1. Overview

            20.1.2.2. Product Portfolio

            20.1.2.3. Profitability by Market Segments

            20.1.2.4. Sales Footprint

            20.1.2.5. Strategy Overview

                20.1.2.5.1. Marketing Strategy

        20.1.3. Rethink Ed

            20.1.3.1. Overview

            20.1.3.2. Product Portfolio

            20.1.3.3. Profitability by Market Segments

            20.1.3.4. Sales Footprint

            20.1.3.5. Strategy Overview

                20.1.3.5.1. Marketing Strategy

        20.1.4. Move This World

            20.1.4.1. Overview

            20.1.4.2. Product Portfolio

            20.1.4.3. Profitability by Market Segments

            20.1.4.4. Sales Footprint

            20.1.4.5. Strategy Overview

                20.1.4.5.1. Marketing Strategy

        20.1.5. Positive Action

            20.1.5.1. Overview

            20.1.5.2. Product Portfolio

            20.1.5.3. Profitability by Market Segments

            20.1.5.4. Sales Footprint

            20.1.5.5. Strategy Overview

                20.1.5.5.1. Marketing Strategy

        20.1.6. Brighten Learning

            20.1.6.1. Overview

            20.1.6.2. Product Portfolio

            20.1.6.3. Profitability by Market Segments

            20.1.6.4. Sales Footprint

            20.1.6.5. Strategy Overview

                20.1.6.5.1. Marketing Strategy

        20.1.7. Aperture Education

            20.1.7.1. Overview

            20.1.7.2. Product Portfolio

            20.1.7.3. Profitability by Market Segments

            20.1.7.4. Sales Footprint

            20.1.7.5. Strategy Overview

                20.1.7.5.1. Marketing Strategy

        20.1.8. Taproot Learning

            20.1.8.1. Overview

            20.1.8.2. Product Portfolio

            20.1.8.3. Profitability by Market Segments

            20.1.8.4. Sales Footprint

            20.1.8.5. Strategy Overview

                20.1.8.5.1. Marketing Strategy

        20.1.9. MeandMine

            20.1.9.1. Overview

            20.1.9.2. Product Portfolio

            20.1.9.3. Profitability by Market Segments

            20.1.9.4. Sales Footprint

            20.1.9.5. Strategy Overview

                20.1.9.5.1. Marketing Strategy

        20.1.10. Everyday Speech

            20.1.10.1. Overview

            20.1.10.2. Product Portfolio

            20.1.10.3. Profitability by Market Segments

            20.1.10.4. Sales Footprint

            20.1.10.5. Strategy Overview

                20.1.10.5.1. Marketing Strategy

21. Assumptions & Acronyms Used

22. Research Methodology

List of Tables

Table 1: Global Market Value (US$ Million) Forecast by Region, 2019 to 2034

Table 2: Global Market Value (US$ Million) Forecast by Component, 2019 to 2034

Table 3: Global Market Value (US$ Million) Forecast by Solution, 2019 to 2034

Table 4: Global Market Value (US$ Million) Forecast by Service, 2019 to 2034

Table 5: Global Market Value (US$ Million) Forecast by User, 2019 to 2034

Table 6: Global Market Value (US$ Million) Forecast by Type, 2019 to 2034

Table 7: North America Market Value (US$ Million) Forecast by Country, 2019 to 2034

Table 8: North America Market Value (US$ Million) Forecast by Component, 2019 to 2034

Table 9: North America Market Value (US$ Million) Forecast by Solution, 2019 to 2034

Table 10: North America Market Value (US$ Million) Forecast by Service, 2019 to 2034

Table 11: North America Market Value (US$ Million) Forecast by User, 2019 to 2034

Table 12: North America Market Value (US$ Million) Forecast by Type, 2019 to 2034

Table 13: Latin America Market Value (US$ Million) Forecast by Country, 2019 to 2034

Table 14: Latin America Market Value (US$ Million) Forecast by Component, 2019 to 2034

Table 15: Latin America Market Value (US$ Million) Forecast by Solution, 2019 to 2034

Table 16: Latin America Market Value (US$ Million) Forecast by Service, 2019 to 2034

Table 17: Latin America Market Value (US$ Million) Forecast by User, 2019 to 2034

Table 18: Latin America Market Value (US$ Million) Forecast by Type, 2019 to 2034

Table 19: Western Europe Market Value (US$ Million) Forecast by Country, 2019 to 2034

Table 20: Western Europe Market Value (US$ Million) Forecast by Component, 2019 to 2034

Table 21: Western Europe Market Value (US$ Million) Forecast by Solution, 2019 to 2034

Table 22: Western Europe Market Value (US$ Million) Forecast by Service, 2019 to 2034

Table 23: Western Europe Market Value (US$ Million) Forecast by User, 2019 to 2034

Table 24: Western Europe Market Value (US$ Million) Forecast by Type, 2019 to 2034

Table 25: Eastern Europe Market Value (US$ Million) Forecast by Country, 2019 to 2034

Table 26: Eastern Europe Market Value (US$ Million) Forecast by Component, 2019 to 2034

Table 27: Eastern Europe Market Value (US$ Million) Forecast by Solution, 2019 to 2034

Table 28: Eastern Europe Market Value (US$ Million) Forecast by Service, 2019 to 2034

Table 29: Eastern Europe Market Value (US$ Million) Forecast by User, 2019 to 2034

Table 30: Eastern Europe Market Value (US$ Million) Forecast by Type, 2019 to 2034

Table 31: South Asia and Pacific Market Value (US$ Million) Forecast by Country, 2019 to 2034

Table 32: South Asia and Pacific Market Value (US$ Million) Forecast by Component, 2019 to 2034

Table 33: South Asia and Pacific Market Value (US$ Million) Forecast by Solution, 2019 to 2034

Table 34: South Asia and Pacific Market Value (US$ Million) Forecast by Service, 2019 to 2034

Table 35: South Asia and Pacific Market Value (US$ Million) Forecast by User, 2019 to 2034

Table 36: South Asia and Pacific Market Value (US$ Million) Forecast by Type, 2019 to 2034

Table 37: East Asia Market Value (US$ Million) Forecast by Country, 2019 to 2034

Table 38: East Asia Market Value (US$ Million) Forecast by Component, 2019 to 2034

Table 39: East Asia Market Value (US$ Million) Forecast by Solution, 2019 to 2034

Table 40: East Asia Market Value (US$ Million) Forecast by Service, 2019 to 2034

Table 41: East Asia Market Value (US$ Million) Forecast by User, 2019 to 2034

Table 42: East Asia Market Value (US$ Million) Forecast by Type, 2019 to 2034

Table 43: Middle East and Africa Market Value (US$ Million) Forecast by Country, 2019 to 2034

Table 44: Middle East and Africa Market Value (US$ Million) Forecast by Component, 2019 to 2034

Table 45: Middle East and Africa Market Value (US$ Million) Forecast by Solution, 2019 to 2034

Table 46: Middle East and Africa Market Value (US$ Million) Forecast by Service, 2019 to 2034

Table 47: Middle East and Africa Market Value (US$ Million) Forecast by User, 2019 to 2034

Table 48: Middle East and Africa Market Value (US$ Million) Forecast by Type, 2019 to 2034

List of Charts

Figure 1: Global Market Value (US$ Million) by Component, 2024 to 2034

Figure 2: Global Market Value (US$ Million) by Solution, 2024 to 2034

Figure 3: Global Market Value (US$ Million) by Service, 2024 to 2034

Figure 4: Global Market Value (US$ Million) by User, 2024 to 2034

Figure 5: Global Market Value (US$ Million) by Type, 2024 to 2034

Figure 6: Global Market Value (US$ Million) by Region, 2024 to 2034

Figure 7: Global Market Value (US$ Million) Analysis by Region, 2019 to 2034

Figure 8: Global Market Value Share (%) and BPS Analysis by Region, 2024 to 2034

Figure 9: Global Market Y-o-Y Growth (%) Projections by Region, 2024 to 2034

Figure 10: Global Market Value (US$ Million) Analysis by Component, 2019 to 2034

Figure 11: Global Market Value Share (%) and BPS Analysis by Component, 2024 to 2034

Figure 12: Global Market Y-o-Y Growth (%) Projections by Component, 2024 to 2034

Figure 13: Global Market Value (US$ Million) Analysis by Solution, 2019 to 2034

Figure 14: Global Market Value Share (%) and BPS Analysis by Solution, 2024 to 2034

Figure 15: Global Market Y-o-Y Growth (%) Projections by Solution, 2024 to 2034

Figure 16: Global Market Value (US$ Million) Analysis by Service, 2019 to 2034

Figure 17: Global Market Value Share (%) and BPS Analysis by Service, 2024 to 2034

Figure 18: Global Market Y-o-Y Growth (%) Projections by Service, 2024 to 2034

Figure 19: Global Market Value (US$ Million) Analysis by User, 2019 to 2034

Figure 20: Global Market Value Share (%) and BPS Analysis by User, 2024 to 2034

Figure 21: Global Market Y-o-Y Growth (%) Projections by User, 2024 to 2034

Figure 22: Global Market Value (US$ Million) Analysis by Type, 2019 to 2034

Figure 23: Global Market Value Share (%) and BPS Analysis by Type, 2024 to 2034

Figure 24: Global Market Y-o-Y Growth (%) Projections by Type, 2024 to 2034

Figure 25: Global Market Attractiveness by Component, 2024 to 2034

Figure 26: Global Market Attractiveness by Solution, 2024 to 2034

Figure 27: Global Market Attractiveness by Service, 2024 to 2034

Figure 28: Global Market Attractiveness by User, 2024 to 2034

Figure 29: Global Market Attractiveness by Type, 2024 to 2034

Figure 30: Global Market Attractiveness by Region, 2024 to 2034

Figure 31: North America Market Value (US$ Million) by Component, 2024 to 2034

Figure 32: North America Market Value (US$ Million) by Solution, 2024 to 2034

Figure 33: North America Market Value (US$ Million) by Service, 2024 to 2034

Figure 34: North America Market Value (US$ Million) by User, 2024 to 2034

Figure 35: North America Market Value (US$ Million) by Type, 2024 to 2034

Figure 36: North America Market Value (US$ Million) by Country, 2024 to 2034

Figure 37: North America Market Value (US$ Million) Analysis by Country, 2019 to 2034

Figure 38: North America Market Value Share (%) and BPS Analysis by Country, 2024 to 2034

Figure 39: North America Market Y-o-Y Growth (%) Projections by Country, 2024 to 2034

Figure 40: North America Market Value (US$ Million) Analysis by Component, 2019 to 2034

Figure 41: North America Market Value Share (%) and BPS Analysis by Component, 2024 to 2034

Figure 42: North America Market Y-o-Y Growth (%) Projections by Component, 2024 to 2034

Figure 43: North America Market Value (US$ Million) Analysis by Solution, 2019 to 2034

Figure 44: North America Market Value Share (%) and BPS Analysis by Solution, 2024 to 2034

Figure 45: North America Market Y-o-Y Growth (%) Projections by Solution, 2024 to 2034

Figure 46: North America Market Value (US$ Million) Analysis by Service, 2019 to 2034

Figure 47: North America Market Value Share (%) and BPS Analysis by Service, 2024 to 2034

Figure 48: North America Market Y-o-Y Growth (%) Projections by Service, 2024 to 2034

Figure 49: North America Market Value (US$ Million) Analysis by User, 2019 to 2034

Figure 50: North America Market Value Share (%) and BPS Analysis by User, 2024 to 2034

Figure 51: North America Market Y-o-Y Growth (%) Projections by User, 2024 to 2034

Figure 52: North America Market Value (US$ Million) Analysis by Type, 2019 to 2034

Figure 53: North America Market Value Share (%) and BPS Analysis by Type, 2024 to 2034

Figure 54: North America Market Y-o-Y Growth (%) Projections by Type, 2024 to 2034

Figure 55: North America Market Attractiveness by Component, 2024 to 2034

Figure 56: North America Market Attractiveness by Solution, 2024 to 2034

Figure 57: North America Market Attractiveness by Service, 2024 to 2034

Figure 58: North America Market Attractiveness by User, 2024 to 2034

Figure 59: North America Market Attractiveness by Type, 2024 to 2034

Figure 60: North America Market Attractiveness by Country, 2024 to 2034

Figure 61: Latin America Market Value (US$ Million) by Component, 2024 to 2034

Figure 62: Latin America Market Value (US$ Million) by Solution, 2024 to 2034

Figure 63: Latin America Market Value (US$ Million) by Service, 2024 to 2034

Figure 64: Latin America Market Value (US$ Million) by User, 2024 to 2034

Figure 65: Latin America Market Value (US$ Million) by Type, 2024 to 2034

Figure 66: Latin America Market Value (US$ Million) by Country, 2024 to 2034

Figure 67: Latin America Market Value (US$ Million) Analysis by Country, 2019 to 2034

Figure 68: Latin America Market Value Share (%) and BPS Analysis by Country, 2024 to 2034

Figure 69: Latin America Market Y-o-Y Growth (%) Projections by Country, 2024 to 2034

Figure 70: Latin America Market Value (US$ Million) Analysis by Component, 2019 to 2034

Figure 71: Latin America Market Value Share (%) and BPS Analysis by Component, 2024 to 2034

Figure 72: Latin America Market Y-o-Y Growth (%) Projections by Component, 2024 to 2034

Figure 73: Latin America Market Value (US$ Million) Analysis by Solution, 2019 to 2034

Figure 74: Latin America Market Value Share (%) and BPS Analysis by Solution, 2024 to 2034

Figure 75: Latin America Market Y-o-Y Growth (%) Projections by Solution, 2024 to 2034

Figure 76: Latin America Market Value (US$ Million) Analysis by Service, 2019 to 2034

Figure 77: Latin America Market Value Share (%) and BPS Analysis by Service, 2024 to 2034

Figure 78: Latin America Market Y-o-Y Growth (%) Projections by Service, 2024 to 2034

Figure 79: Latin America Market Value (US$ Million) Analysis by User, 2019 to 2034

Figure 80: Latin America Market Value Share (%) and BPS Analysis by User, 2024 to 2034

Figure 81: Latin America Market Y-o-Y Growth (%) Projections by User, 2024 to 2034

Figure 82: Latin America Market Value (US$ Million) Analysis by Type, 2019 to 2034

Figure 83: Latin America Market Value Share (%) and BPS Analysis by Type, 2024 to 2034

Figure 84: Latin America Market Y-o-Y Growth (%) Projections by Type, 2024 to 2034

Figure 85: Latin America Market Attractiveness by Component, 2024 to 2034

Figure 86: Latin America Market Attractiveness by Solution, 2024 to 2034

Figure 87: Latin America Market Attractiveness by Service, 2024 to 2034

Figure 88: Latin America Market Attractiveness by User, 2024 to 2034

Figure 89: Latin America Market Attractiveness by Type, 2024 to 2034

Figure 90: Latin America Market Attractiveness by Country, 2024 to 2034

Figure 91: Western Europe Market Value (US$ Million) by Component, 2024 to 2034

Figure 92: Western Europe Market Value (US$ Million) by Solution, 2024 to 2034

Figure 93: Western Europe Market Value (US$ Million) by Service, 2024 to 2034

Figure 94: Western Europe Market Value (US$ Million) by User, 2024 to 2034

Figure 95: Western Europe Market Value (US$ Million) by Type, 2024 to 2034

Figure 96: Western Europe Market Value (US$ Million) by Country, 2024 to 2034

Figure 97: Western Europe Market Value (US$ Million) Analysis by Country, 2019 to 2034

Figure 98: Western Europe Market Value Share (%) and BPS Analysis by Country, 2024 to 2034

Figure 99: Western Europe Market Y-o-Y Growth (%) Projections by Country, 2024 to 2034

Figure 100: Western Europe Market Value (US$ Million) Analysis by Component, 2019 to 2034

Figure 101: Western Europe Market Value Share (%) and BPS Analysis by Component, 2024 to 2034

Figure 102: Western Europe Market Y-o-Y Growth (%) Projections by Component, 2024 to 2034

Figure 103: Western Europe Market Value (US$ Million) Analysis by Solution, 2019 to 2034

Figure 104: Western Europe Market Value Share (%) and BPS Analysis by Solution, 2024 to 2034

Figure 105: Western Europe Market Y-o-Y Growth (%) Projections by Solution, 2024 to 2034

Figure 106: Western Europe Market Value (US$ Million) Analysis by Service, 2019 to 2034

Figure 107: Western Europe Market Value Share (%) and BPS Analysis by Service, 2024 to 2034

Figure 108: Western Europe Market Y-o-Y Growth (%) Projections by Service, 2024 to 2034

Figure 109: Western Europe Market Value (US$ Million) Analysis by User, 2019 to 2034

Figure 110: Western Europe Market Value Share (%) and BPS Analysis by User, 2024 to 2034

Figure 111: Western Europe Market Y-o-Y Growth (%) Projections by User, 2024 to 2034

Figure 112: Western Europe Market Value (US$ Million) Analysis by Type, 2019 to 2034

Figure 113: Western Europe Market Value Share (%) and BPS Analysis by Type, 2024 to 2034

Figure 114: Western Europe Market Y-o-Y Growth (%) Projections by Type, 2024 to 2034

Figure 115: Western Europe Market Attractiveness by Component, 2024 to 2034

Figure 116: Western Europe Market Attractiveness by Solution, 2024 to 2034

Figure 117: Western Europe Market Attractiveness by Service, 2024 to 2034

Figure 118: Western Europe Market Attractiveness by User, 2024 to 2034

Figure 119: Western Europe Market Attractiveness by Type, 2024 to 2034

Figure 120: Western Europe Market Attractiveness by Country, 2024 to 2034

Figure 121: Eastern Europe Market Value (US$ Million) by Component, 2024 to 2034

Figure 122: Eastern Europe Market Value (US$ Million) by Solution, 2024 to 2034

Figure 123: Eastern Europe Market Value (US$ Million) by Service, 2024 to 2034

Figure 124: Eastern Europe Market Value (US$ Million) by User, 2024 to 2034

Figure 125: Eastern Europe Market Value (US$ Million) by Type, 2024 to 2034

Figure 126: Eastern Europe Market Value (US$ Million) by Country, 2024 to 2034

Figure 127: Eastern Europe Market Value (US$ Million) Analysis by Country, 2019 to 2034

Figure 128: Eastern Europe Market Value Share (%) and BPS Analysis by Country, 2024 to 2034

Figure 129: Eastern Europe Market Y-o-Y Growth (%) Projections by Country, 2024 to 2034

Figure 130: Eastern Europe Market Value (US$ Million) Analysis by Component, 2019 to 2034

Figure 131: Eastern Europe Market Value Share (%) and BPS Analysis by Component, 2024 to 2034

Figure 132: Eastern Europe Market Y-o-Y Growth (%) Projections by Component, 2024 to 2034

Figure 133: Eastern Europe Market Value (US$ Million) Analysis by Solution, 2019 to 2034

Figure 134: Eastern Europe Market Value Share (%) and BPS Analysis by Solution, 2024 to 2034

Figure 135: Eastern Europe Market Y-o-Y Growth (%) Projections by Solution, 2024 to 2034

Figure 136: Eastern Europe Market Value (US$ Million) Analysis by Service, 2019 to 2034

Figure 137: Eastern Europe Market Value Share (%) and BPS Analysis by Service, 2024 to 2034

Figure 138: Eastern Europe Market Y-o-Y Growth (%) Projections by Service, 2024 to 2034

Figure 139: Eastern Europe Market Value (US$ Million) Analysis by User, 2019 to 2034

Figure 140: Eastern Europe Market Value Share (%) and BPS Analysis by User, 2024 to 2034

Figure 141: Eastern Europe Market Y-o-Y Growth (%) Projections by User, 2024 to 2034

Figure 142: Eastern Europe Market Value (US$ Million) Analysis by Type, 2019 to 2034

Figure 143: Eastern Europe Market Value Share (%) and BPS Analysis by Type, 2024 to 2034

Figure 144: Eastern Europe Market Y-o-Y Growth (%) Projections by Type, 2024 to 2034

Figure 145: Eastern Europe Market Attractiveness by Component, 2024 to 2034

Figure 146: Eastern Europe Market Attractiveness by Solution, 2024 to 2034

Figure 147: Eastern Europe Market Attractiveness by Service, 2024 to 2034

Figure 148: Eastern Europe Market Attractiveness by User, 2024 to 2034

Figure 149: Eastern Europe Market Attractiveness by Type, 2024 to 2034

Figure 150: Eastern Europe Market Attractiveness by Country, 2024 to 2034

Figure 151: South Asia and Pacific Market Value (US$ Million) by Component, 2024 to 2034

Figure 152: South Asia and Pacific Market Value (US$ Million) by Solution, 2024 to 2034

Figure 153: South Asia and Pacific Market Value (US$ Million) by Service, 2024 to 2034

Figure 154: South Asia and Pacific Market Value (US$ Million) by User, 2024 to 2034

Figure 155: South Asia and Pacific Market Value (US$ Million) by Type, 2024 to 2034

Figure 156: South Asia and Pacific Market Value (US$ Million) by Country, 2024 to 2034

Figure 157: South Asia and Pacific Market Value (US$ Million) Analysis by Country, 2019 to 2034

Figure 158: South Asia and Pacific Market Value Share (%) and BPS Analysis by Country, 2024 to 2034

Figure 159: South Asia and Pacific Market Y-o-Y Growth (%) Projections by Country, 2024 to 2034

Figure 160: South Asia and Pacific Market Value (US$ Million) Analysis by Component, 2019 to 2034

Figure 161: South Asia and Pacific Market Value Share (%) and BPS Analysis by Component, 2024 to 2034

Figure 162: South Asia and Pacific Market Y-o-Y Growth (%) Projections by Component, 2024 to 2034

Figure 163: South Asia and Pacific Market Value (US$ Million) Analysis by Solution, 2019 to 2034

Figure 164: South Asia and Pacific Market Value Share (%) and BPS Analysis by Solution, 2024 to 2034

Figure 165: South Asia and Pacific Market Y-o-Y Growth (%) Projections by Solution, 2024 to 2034

Figure 166: South Asia and Pacific Market Value (US$ Million) Analysis by Service, 2019 to 2034

Figure 167: South Asia and Pacific Market Value Share (%) and BPS Analysis by Service, 2024 to 2034

Figure 168: South Asia and Pacific Market Y-o-Y Growth (%) Projections by Service, 2024 to 2034

Figure 169: South Asia and Pacific Market Value (US$ Million) Analysis by User, 2019 to 2034

Figure 170: South Asia and Pacific Market Value Share (%) and BPS Analysis by User, 2024 to 2034

Figure 171: South Asia and Pacific Market Y-o-Y Growth (%) Projections by User, 2024 to 2034

Figure 172: South Asia and Pacific Market Value (US$ Million) Analysis by Type, 2019 to 2034

Figure 173: South Asia and Pacific Market Value Share (%) and BPS Analysis by Type, 2024 to 2034

Figure 174: South Asia and Pacific Market Y-o-Y Growth (%) Projections by Type, 2024 to 2034

Figure 175: South Asia and Pacific Market Attractiveness by Component, 2024 to 2034

Figure 176: South Asia and Pacific Market Attractiveness by Solution, 2024 to 2034

Figure 177: South Asia and Pacific Market Attractiveness by Service, 2024 to 2034

Figure 178: South Asia and Pacific Market Attractiveness by User, 2024 to 2034

Figure 179: South Asia and Pacific Market Attractiveness by Type, 2024 to 2034

Figure 180: South Asia and Pacific Market Attractiveness by Country, 2024 to 2034

Figure 181: East Asia Market Value (US$ Million) by Component, 2024 to 2034

Figure 182: East Asia Market Value (US$ Million) by Solution, 2024 to 2034

Figure 183: East Asia Market Value (US$ Million) by Service, 2024 to 2034

Figure 184: East Asia Market Value (US$ Million) by User, 2024 to 2034

Figure 185: East Asia Market Value (US$ Million) by Type, 2024 to 2034

Figure 186: East Asia Market Value (US$ Million) by Country, 2024 to 2034

Figure 187: East Asia Market Value (US$ Million) Analysis by Country, 2019 to 2034

Figure 188: East Asia Market Value Share (%) and BPS Analysis by Country, 2024 to 2034

Figure 189: East Asia Market Y-o-Y Growth (%) Projections by Country, 2024 to 2034

Figure 190: East Asia Market Value (US$ Million) Analysis by Component, 2019 to 2034

Figure 191: East Asia Market Value Share (%) and BPS Analysis by Component, 2024 to 2034

Figure 192: East Asia Market Y-o-Y Growth (%) Projections by Component, 2024 to 2034

Figure 193: East Asia Market Value (US$ Million) Analysis by Solution, 2019 to 2034

Figure 194: East Asia Market Value Share (%) and BPS Analysis by Solution, 2024 to 2034

Figure 195: East Asia Market Y-o-Y Growth (%) Projections by Solution, 2024 to 2034

Figure 196: East Asia Market Value (US$ Million) Analysis by Service, 2019 to 2034

Figure 197: East Asia Market Value Share (%) and BPS Analysis by Service, 2024 to 2034

Figure 198: East Asia Market Y-o-Y Growth (%) Projections by Service, 2024 to 2034

Figure 199: East Asia Market Value (US$ Million) Analysis by User, 2019 to 2034

Figure 200: East Asia Market Value Share (%) and BPS Analysis by User, 2024 to 2034

Figure 201: East Asia Market Y-o-Y Growth (%) Projections by User, 2024 to 2034

Figure 202: East Asia Market Value (US$ Million) Analysis by Type, 2019 to 2034

Figure 203: East Asia Market Value Share (%) and BPS Analysis by Type, 2024 to 2034

Figure 204: East Asia Market Y-o-Y Growth (%) Projections by Type, 2024 to 2034

Figure 205: East Asia Market Attractiveness by Component, 2024 to 2034

Figure 206: East Asia Market Attractiveness by Solution, 2024 to 2034

Figure 207: East Asia Market Attractiveness by Service, 2024 to 2034

Figure 208: East Asia Market Attractiveness by User, 2024 to 2034

Figure 209: East Asia Market Attractiveness by Type, 2024 to 2034

Figure 210: East Asia Market Attractiveness by Country, 2024 to 2034

Figure 211: Middle East and Africa Market Value (US$ Million) by Component, 2024 to 2034

Figure 212: Middle East and Africa Market Value (US$ Million) by Solution, 2024 to 2034

Figure 213: Middle East and Africa Market Value (US$ Million) by Service, 2024 to 2034

Figure 214: Middle East and Africa Market Value (US$ Million) by User, 2024 to 2034

Figure 215: Middle East and Africa Market Value (US$ Million) by Type, 2024 to 2034

Figure 216: Middle East and Africa Market Value (US$ Million) by Country, 2024 to 2034

Figure 217: Middle East and Africa Market Value (US$ Million) Analysis by Country, 2019 to 2034

Figure 218: Middle East and Africa Market Value Share (%) and BPS Analysis by Country, 2024 to 2034

Figure 219: Middle East and Africa Market Y-o-Y Growth (%) Projections by Country, 2024 to 2034

Figure 220: Middle East and Africa Market Value (US$ Million) Analysis by Component, 2019 to 2034

Figure 221: Middle East and Africa Market Value Share (%) and BPS Analysis by Component, 2024 to 2034

Figure 222: Middle East and Africa Market Y-o-Y Growth (%) Projections by Component, 2024 to 2034

Figure 223: Middle East and Africa Market Value (US$ Million) Analysis by Solution, 2019 to 2034

Figure 224: Middle East and Africa Market Value Share (%) and BPS Analysis by Solution, 2024 to 2034

Figure 225: Middle East and Africa Market Y-o-Y Growth (%) Projections by Solution, 2024 to 2034

Figure 226: Middle East and Africa Market Value (US$ Million) Analysis by Service, 2019 to 2034

Figure 227: Middle East and Africa Market Value Share (%) and BPS Analysis by Service, 2024 to 2034

Figure 228: Middle East and Africa Market Y-o-Y Growth (%) Projections by Service, 2024 to 2034

Figure 229: Middle East and Africa Market Value (US$ Million) Analysis by User, 2019 to 2034

Figure 230: Middle East and Africa Market Value Share (%) and BPS Analysis by User, 2024 to 2034

Figure 231: Middle East and Africa Market Y-o-Y Growth (%) Projections by User, 2024 to 2034

Figure 232: Middle East and Africa Market Value (US$ Million) Analysis by Type, 2019 to 2034

Figure 233: Middle East and Africa Market Value Share (%) and BPS Analysis by Type, 2024 to 2034

Figure 234: Middle East and Africa Market Y-o-Y Growth (%) Projections by Type, 2024 to 2034

Figure 235: Middle East and Africa Market Attractiveness by Component, 2024 to 2034

Figure 236: Middle East and Africa Market Attractiveness by Solution, 2024 to 2034

Figure 237: Middle East and Africa Market Attractiveness by Service, 2024 to 2034

Figure 238: Middle East and Africa Market Attractiveness by User, 2024 to 2034

Figure 239: Middle East and Africa Market Attractiveness by Type, 2024 to 2034

Figure 240: Middle East and Africa Market Attractiveness by Country, 2024 to 2034

Recommendations

Technology

Social Business Intelligence Market

Published : November 2023

Technology

Smart Education and Learning Market

Published : February 2023

Technology

Deep Learning Market

Published : September 2022

Technology

Emotion Detection and Recognition Market

Published : October 2021

Explore Services and Utilities Insights

View Reports

Social and Emotional Learning Market