Reports

- Global Locations -

Headquarters

Future Market Insights, Inc.

Christiana Corporate, 200
Continental Drive, Suite 401,
Newark, Delaware - 19713,
United States

T: +1-845-579-5705

Americas

Future Market Insights, Inc.

616 Corporate Way, Suite 2-9018,
Valley Cottage, NY 10989, United States

T: +1-347-918-3531

MEA

Future Market Insights

1602-6 Jumeirah Bay X2 Tower, Plot No: JLT-PH2-X2A,
Jumeirah Lakes Towers, Dubai,
United Arab Emirates

Europe

Future Market Insights

3rd Floor, 207 Regent Street,
W1B 3HH London
United Kingdom

T: + 44 (0) 20 8123 9659
D: +44 (0) 20 3287 4268

Asia Pacific

Future Market Insights

IndiaLand Global Tech Park, Unit UG-1, Behind Grand HighStreet, Phase 1, Hinjawadi, MH, Pune – 411057, India

Social Advertising Tools Market Outlook (2022-2032)

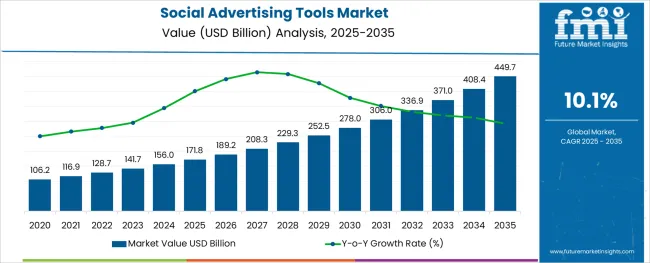
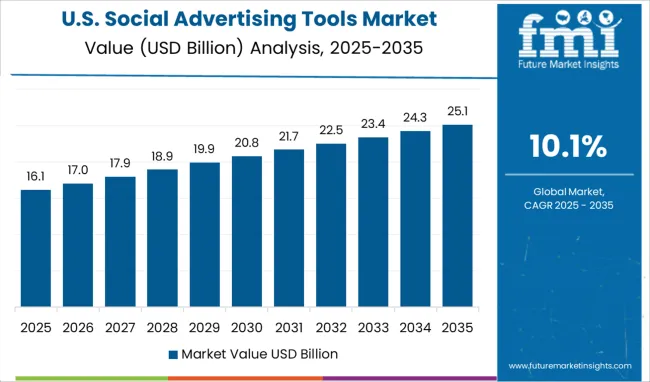
[323 Pages Report] The global social advertising tools market is anticipated to reach US$ 3,35,822.0 million by 2032, up from US$ 1,28,729.0 million in 2022, with a CAGR of 10.1% during the forecast period.

Rising investment in digital advertising by organizations across different industries is projected to scale up the global social advertising tools market growth.The demand also grows as a number of companies use these tools to expand business reach and drive traffic to their websites and create ads for target audience groups right down to specific individuals based on their interests.

Social media advertising has become the core business strategy by organizations across the world, thereby fostering the market as these tools also have various features to track ad performance, revise ad budgets & schedules, & edit existing ads.

Report Attribute Details
Social Advertising Tools Market Value (2022) US$ 1,28,729.0 Million
Social Advertising Tools Market Anticipated Forecast Value (2032) US$ 3,35,822.0 Million
Social Advertising Tools Market Projected Growth Rate (2022 to 2032) 10.1%

Every industry must be present on every social platform in order to spike their visibility and reach due to the widespread adoption of social media through mobile, computers, and tablets for daily tasks, in turn surging the demand for social advertising tools.

Likewise, there is a tonne of potential for travel and tourism on these platforms, including travel planning and booking, increased travel brand awareness, mobile ticketing, personalised itinerary builders, mPay tools, opportunities for exceptional ROI and more.

The adoption of social advertising tools is bolstered by various organizations as they can obtain a wealth of data about consumer perceptions of their brands, using that data to plan their marketing and sales initiatives.

Furthermore, businesses can use social media management tools to increase their brand awareness and gain a competitive edge by using these tools to analyse the market, the competition, and user behaviour on social media platforms.

Don't pay for what you don't need

Customize your report by selecting specific countries or regions and save 30%!

What Factors are Shaping the Social Advertising Tools Market?

Increasing social media users in tandem with expanding social media communication volumes are expected to surge the demand for social advertising tools to a significant extent. Moreover, the constant rise in the number of time people spend on social media contributes to the growth of the global social advertising tools market. The rising focus on delivering personalized content based on overall user behaviour & preference holds sway over the global social advertising tools adoption trends.

The future market trends are augured well by the expanding small and medium-sized enterprises (SMEs) and continuous preference for social media adverting tools to reach customers. However, constraints on lack of proper insights into whether social media advertising channels have generated any revenue business are identified as restraints that likely deter the progression of the global social advertising tools market.
Virtual Reality and Augmented Reality to Amplify North America’s Potential

With an anticipated market share of 35.5% in terms of revenue in 2022, North America is expected to lead the social advertising tools market over the forecast period, boosted by technological developments in virtual reality and augmented reality.

Additionally, the social advertising tools market growth is being accelerated by the region's rapidly increasing internet user population. The market in this region is also anticipated to be driven by the rising investments in digital advertising, particularly in social media consulting.
Sudip Saha
Sudip Saha

Principal Consultant

Talk to Analyst

Find your sweet spots for generating winning opportunities in this market.

Rising Number of Influencers in Key Tourist Locations to Underpin Growth in Europe

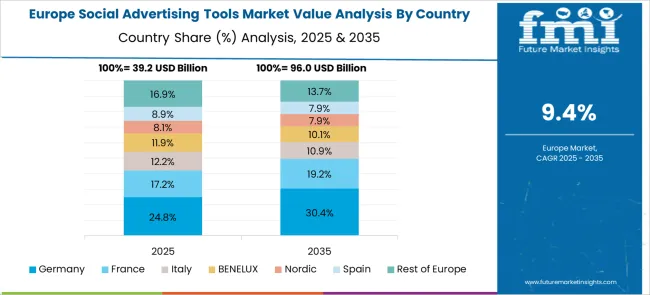
By 2022, Europe social advertising tools market is likely to get hold of a share of about 23.4% in 2022. The adoption of social advertising tools is expected to grow as a result of the estimated sharp increase in smartphone penetration and the rising number of users who have access to the internet in the region.

The World Bank reports that Germany has a sizable population of frequent internet users, which has aided in the development of social media, where one of the main ways to access social media content is through smartphones.

How is the Start-up Ecosystem in the Social Advertising Tools Market?

Business models change over time, sometimes as a result of market changes and other times as a result of technological advancements, which leads to the emergence of exciting new trends.

A legion of start-ups in the social advertising tools market is proliferation from various countries, bringing about emerging trends in the social advertising tools market.

For example, one of the latest start-ups, Sprinklr, is a software for managing the customer experience in the cloud. The platform enables businesses to use public discourse on cutting-edge platforms to gain useful insights for bettering marketing, advertising, customer service, product development, and other areas. Accenture, Cognizant, Deloitte, IBM, RichRelevance, SHIFT, and this moment are some of the partners. It acquired Scup, Branderati, Dachis Group, TBG, GetSatisfaction, and Pluck in addition to new brand analytics.
Get the data you need at a Fraction of the cost

Personalize your report by choosing insights you need
and save 40%!

What is the Competition Landscape in the Social Advertising Tools Market?

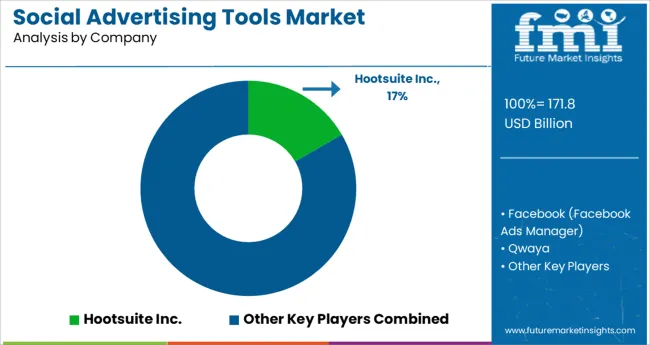
The market for social advertising tools is highly competitive with various key players involving in strategies such as mergers & acquisitions, partnerships, collaborations, etc., in turn shaping the social advertising tools market trends and forecast.

Some of such recent developments are:

  • For Adobe Commerce, Adobe unveiled a live search powered by AI. Retailers using Adobe Commerce can give their customers relevant, customised search results based on their needs.
  • In order to bring HCL Software's cloud-native Digital Experience (DX) and Unica Marketing platforms to Google Cloud, HCL Technologies and Google Cloud recently announced the expansion of their strategic partnership.

Key Players

  • Hootsuite Inc.
  • Facebook (Facebook Ads Manager)
  • Qwaya
  • AdEspresso, Inc.
  • Social Ads Tool
  • ADSTAGE
  • goraPulse
  • Sprout Social, Inc.
  • Driftrock Ltd.
  • AdRoll.com

Report Scope

Report Attribute Details
Growth Rate CAGR of 10.1% from 2022 to 2032
Base Year for Estimation 2021
Historical Data 2016 to 2021
Forecast Period 2022 to 2032
Quantitative Units Revenue in US$ Million and CAGR from 2022 to 2032
Report Coverage Revenue Forecast, Volume Forecast, Company Ranking, Competitive Landscape, Growth Factors, Trends and Pricing Analysis
Segments Covered
  • Platform
  • Organization Type
  • End Use
  • Region
Regions Covered
  • North America
  • Latin America
  • Asia Pacific
  • The Middle East and Africa
  • Europe
Key Countries Profiled
  • USA
  • Canada
  • Brazil
  • Argentina
  • Germany
  • UK
  • France
  • Spain
  • Italy
  • Nordics
  • BENELUX
  • Australia & New Zealand
  • China
  • India
  • ASEAN
  • GCC
  • South Africa
Key Companies Profiled
  • Hootsuite Inc.
  • Facebook (Facebook Ads Manager)
  • Qwaya
  • AdEspresso, Inc.
  • Social Ads Tool
  • ADSTAGE
  • goraPulse
  • Sprout Social, Inc.
  • Driftrock Ltd.
  • AdRoll.com
Customization Available Upon Request

Key Segments Profiled in the Social Advertising Tools Market Survey

By Platform:

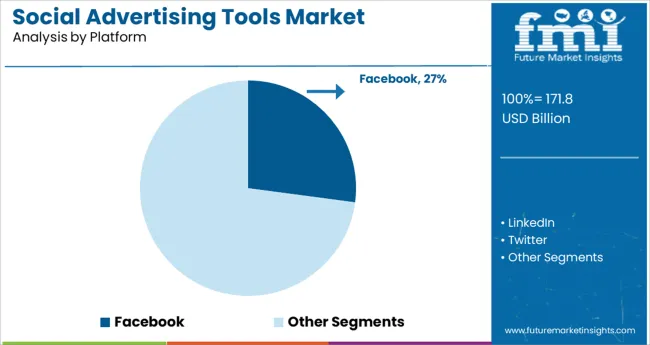
  • Facebook
  • LinkedIn
  • Twitter
  • Instagram
  • Pinterest
  • Others

By Organization Type:

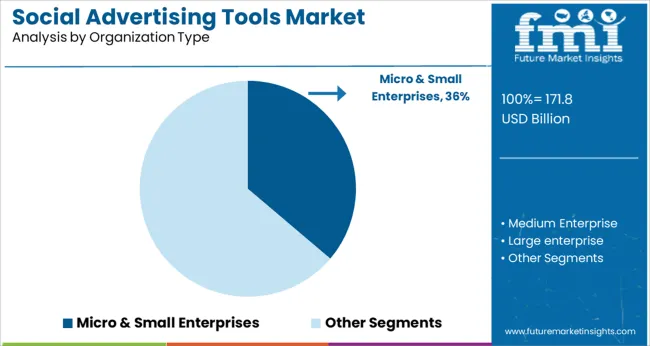
  • Micro & Small Enterprises
  • Medium Enterprise
  • Large enterprise

By End Use:

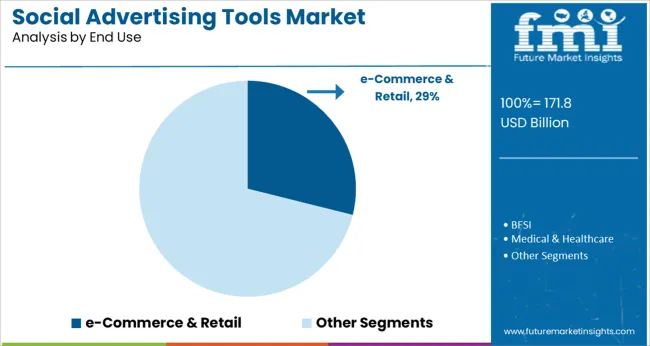
  • e-Commerce & Retail
  • BFSI
  • Medical & Healthcare
  • Transportation & Logistics
  • Media & Entertainment
  • Others

By Region:

  • North America
  • Latin America
  • Asia Pacific
  • Middle East and Africa
  • Europe

Frequently Asked Questions

What is the Growth Outlook for the Social Advertising Tools Market?

The social advertising tools market is set to advance at a CAGR of 10.1% (2022-2032).

What is the Estimated Social Advertising Tools Market Share of North America?

North America is likely to hold a social advertising tools market share of 35.5% in 2022.

What is the Future of the Social Advertising Tools Market?

Social advertising tools market is anticipated to account for about US$ 3,35,822.0 million by 2032.

Table of Content

1. Executive Summary

    1.1. Global Market Outlook

    1.2. Demand-side Trends

    1.3. Supply-side Trends

    1.4. Technology Roadmap Analysis

    1.5. Analysis and Recommendations

2. Market Overview

    2.1. Market Coverage / Taxonomy

    2.2. Market Definition / Scope / Limitations

3. Market Background

    3.1. Market Dynamics

        3.1.1. Drivers

        3.1.2. Restraints

        3.1.3. Opportunity

        3.1.4. Trends

    3.2. Scenario Forecast

        3.2.1. Demand in Optimistic Scenario

        3.2.2. Demand in Likely Scenario

        3.2.3. Demand in Conservative Scenario

    3.3. Opportunity Map Analysis

    3.4. Investment Feasibility Matrix

    3.5. PESTLE and Porter’s Analysis

    3.6. Regulatory Landscape

        3.6.1. By Key Regions

        3.6.2. By Key Countries

    3.7. Regional Parent Market Outlook

4. Global Social Advertising Tools Market Analysis 2017-2021 and Forecast, 2022-2032

    4.1. Historical Market Size Value (US$ Mn) Analysis, 2017-2021

    4.2. Current and Future Market Size Value (US$ Mn) Projections, 2022-2032

        4.2.1. Y-o-Y Growth Trend Analysis

        4.2.2. Absolute $ Opportunity Analysis

5. Global Social Advertising Tools Market Analysis 2017-2021 and Forecast 2022-2032, By Platform

    5.1. Introduction / Key Findings

    5.2. Historical Market Size Value (US$ Mn) Analysis By Platform, 2017-2021

    5.3. Current and Future Market Size Value (US$ Mn) Analysis and Forecast By Platform, 2022-2032

        5.3.1. Facebook

        5.3.2. LinkedIn

        5.3.3. Twitter

        5.3.4. Instagram

        5.3.5. Pinterest

        5.3.6. Others

    5.4. Y-o-Y Growth Trend Analysis By Platform, 2017-2021

    5.5. Absolute $ Opportunity Analysis By Platform, 2022-2032

6. Global Social Advertising Tools Market Analysis 2017-2021 and Forecast 2022-2032, By End-user type

    6.1. Introduction / Key Findings

    6.2. Historical Market Size Value (US$ Mn) Analysis By End-user type, 2017-2021

    6.3. Current and Future Market Size Value (US$ Mn) Analysis and Forecast By End-user type, 2022-2032

        6.3.1. Micro & Small enterprises

        6.3.2. Medium enterprise

        6.3.3. Large enterprise

    6.4. Y-o-Y Growth Trend Analysis By End-user type, 2017-2021

    6.5. Absolute $ Opportunity Analysis By End-user type, 2022-2032

7. Global Social Advertising Tools Market Analysis 2017-2021 and Forecast 2022-2032, By End-user industry

    7.1. Introduction / Key Findings

    7.2. Historical Market Size Value (US$ Mn) Analysis By End-user industry, 2017-2021

    7.3. Current and Future Market Size Value (US$ Mn) Analysis and Forecast By End-user industry, 2022-2032

        7.3.1. E-commerce & Retail

        7.3.2. BFSI

        7.3.3. Medical & Healthcare

        7.3.4. Transportation & Logistics

        7.3.5. Media & Entertainment

        7.3.6. Others

    7.4. Y-o-Y Growth Trend Analysis By End-user industry, 2017-2021

    7.5. Absolute $ Opportunity Analysis By End-user industry, 2022-2032

8. Global Social Advertising Tools Market Analysis 2017-2021 and Forecast 2022-2032, By Region

    8.1. Introduction

    8.2. Historical Market Size Value (US$ Mn) Analysis By Region, 2017-2021

    8.3. Current Market Size Value (US$ Mn) Analysis and Forecast By Region, 2022-2032

        8.3.1. North America

        8.3.2. Latin America

        8.3.3. Europe

        8.3.4. Asia Pacific

        8.3.5. MEA

    8.4. Market Attractiveness Analysis By Region

9. North America Social Advertising Tools Market Analysis 2017-2021 and Forecast 2022-2032, By Country

    9.1. Historical Market Size Value (US$ Mn) Trend Analysis By Market Taxonomy, 2017-2021

    9.2. Market Size Value (US$ Mn) Forecast By Market Taxonomy, 2022-2032

        9.2.1. By Country

            9.2.1.1. U.S.

            9.2.1.2. Canada

        9.2.2. By Platform

        9.2.3. By End-user type

        9.2.4. By End-user industry

    9.3. Market Attractiveness Analysis

        9.3.1. By Country

        9.3.2. By Platform

        9.3.3. By End-user type

        9.3.4. By End-user industry

    9.4. Key Takeaways

10. Latin America Social Advertising Tools Market Analysis 2017-2021 and Forecast 2022-2032, By Country

    10.1. Historical Market Size Value (US$ Mn) Trend Analysis By Market Taxonomy, 2017-2021

    10.2. Market Size Value (US$ Mn) Forecast By Market Taxonomy, 2022-2032

        10.2.1. By Country

            10.2.1.1. Brazil

            10.2.1.2. Mexico

            10.2.1.3. Rest of Latin America

        10.2.2. By Platform

        10.2.3. By End-user type

        10.2.4. By End-user industry

    10.3. Market Attractiveness Analysis

        10.3.1. By Country

        10.3.2. By Platform

        10.3.3. By End-user type

        10.3.4. By End-user industry

    10.4. Key Takeaways

11. Europe Social Advertising Tools Market Analysis 2017-2021 and Forecast 2022-2032, By Country

    11.1. Historical Market Size Value (US$ Mn) Trend Analysis By Market Taxonomy, 2017-2021

    11.2. Market Size Value (US$ Mn) Forecast By Market Taxonomy, 2022-2032

        11.2.1. By Country

            11.2.1.1. Germany

            11.2.1.2. U.K.

            11.2.1.3. France

            11.2.1.4. Spain

            11.2.1.5. Italy

            11.2.1.6. Rest of Europe

        11.2.2. By Platform

        11.2.3. By End-user type

        11.2.4. By End-user industry

    11.3. Market Attractiveness Analysis

        11.3.1. By Country

        11.3.2. By Platform

        11.3.3. By End-user type

        11.3.4. By End-user industry

    11.4. Key Takeaways

12. Asia Pacific Social Advertising Tools Market Analysis 2017-2021 and Forecast 2022-2032, By Country

    12.1. Historical Market Size Value (US$ Mn) Trend Analysis By Market Taxonomy, 2017-2021

    12.2. Market Size Value (US$ Mn) Forecast By Market Taxonomy, 2022-2032

        12.2.1. By Country

            12.2.1.1. China

            12.2.1.2. Japan

            12.2.1.3. South Korea

            12.2.1.4. Malaysia

            12.2.1.5. Singapore

            12.2.1.6. Australia

            12.2.1.7. Rest of Asia Pacific

        12.2.2. By Platform

        12.2.3. By End-user type

        12.2.4. By End-user industry

    12.3. Market Attractiveness Analysis

        12.3.1. By Country

        12.3.2. By Platform

        12.3.3. By End-user type

        12.3.4. By End-user industry

    12.4. Key Takeaways

13. MEA Social Advertising Tools Market Analysis 2017-2021 and Forecast 2022-2032, By Country

    13.1. Historical Market Size Value (US$ Mn) Trend Analysis By Market Taxonomy, 2017-2021

    13.2. Market Size Value (US$ Mn) Forecast By Market Taxonomy, 2022-2032

        13.2.1. By Country

            13.2.1.1. GCC Countries

            13.2.1.2. South Africa

            13.2.1.3. Israel

            13.2.1.4. Rest of MEA

        13.2.2. By Platform

        13.2.3. By End-user type

        13.2.4. By End-user industry

    13.3. Market Attractiveness Analysis

        13.3.1. By Country

        13.3.2. By Platform

        13.3.3. By End-user type

        13.3.4. By End-user industry

    13.4. Key Takeaways

14. Key Countries Social Advertising Tools Market Analysis

    14.1. U.K.

        14.1.1. Pricing Analysis

        14.1.2. Market Share Analysis, 2021

            14.1.2.1. By Platform

            14.1.2.2. By End-user type

            14.1.2.3. By End-user industry

    14.2. Canada

        14.2.1. Pricing Analysis

        14.2.2. Market Share Analysis, 2021

            14.2.2.1. By Platform

            14.2.2.2. By End-user type

            14.2.2.3. By End-user industry

    14.3. Brazil

        14.3.1. Pricing Analysis

        14.3.2. Market Share Analysis, 2021

            14.3.2.1. By Platform

            14.3.2.2. By End-user type

            14.3.2.3. By End-user industry

    14.4. Mexico

        14.4.1. Pricing Analysis

        14.4.2. Market Share Analysis, 2021

            14.4.2.1. By Platform

            14.4.2.2. By End-user type

            14.4.2.3. By End-user industry

    14.5. Rest of Latin America

        14.5.1. Pricing Analysis

        14.5.2. Market Share Analysis, 2021

            14.5.2.1. By Platform

            14.5.2.2. By End-user type

            14.5.2.3. By End-user industry

    14.6. Germany

        14.6.1. Pricing Analysis

        14.6.2. Market Share Analysis, 2021

            14.6.2.1. By Platform

            14.6.2.2. By End-user type

            14.6.2.3. By End-user industry

    14.7. U.K.

        14.7.1. Pricing Analysis

        14.7.2. Market Share Analysis, 2021

            14.7.2.1. By Platform

            14.7.2.2. By End-user type

            14.7.2.3. By End-user industry

    14.8. France

        14.8.1. Pricing Analysis

        14.8.2. Market Share Analysis, 2021

            14.8.2.1. By Platform

            14.8.2.2. By End-user type

            14.8.2.3. By End-user industry

    14.9. Spain

        14.9.1. Pricing Analysis

        14.9.2. Market Share Analysis, 2021

            14.9.2.1. By Platform

            14.9.2.2. By End-user type

            14.9.2.3. By End-user industry

    14.10. Italy

        14.10.1. Pricing Analysis

        14.10.2. Market Share Analysis, 2021

            14.10.2.1. By Platform

            14.10.2.2. By End-user type

            14.10.2.3. By End-user industry

    14.11. Rest of Europe

        14.11.1. Pricing Analysis

        14.11.2. Market Share Analysis, 2021

            14.11.2.1. By Platform

            14.11.2.2. By End-user type

            14.11.2.3. By End-user industry

    14.12. China

        14.12.1. Pricing Analysis

        14.12.2. Market Share Analysis, 2021

            14.12.2.1. By Platform

            14.12.2.2. By End-user type

            14.12.2.3. By End-user industry

    14.13. Japan

        14.13.1. Pricing Analysis

        14.13.2. Market Share Analysis, 2021

            14.13.2.1. By Platform

            14.13.2.2. By End-user type

            14.13.2.3. By End-user industry

    14.14. South Korea

        14.14.1. Pricing Analysis

        14.14.2. Market Share Analysis, 2021

            14.14.2.1. By Platform

            14.14.2.2. By End-user type

            14.14.2.3. By End-user industry

    14.15. Malaysia

        14.15.1. Pricing Analysis

        14.15.2. Market Share Analysis, 2021

            14.15.2.1. By Platform

            14.15.2.2. By End-user type

            14.15.2.3. By End-user industry

    14.16. Singapore

        14.16.1. Pricing Analysis

        14.16.2. Market Share Analysis, 2021

            14.16.2.1. By Platform

            14.16.2.2. By End-user type

            14.16.2.3. By End-user industry

    14.17. Australia

        14.17.1. Pricing Analysis

        14.17.2. Market Share Analysis, 2021

            14.17.2.1. By Platform

            14.17.2.2. By End-user type

            14.17.2.3. By End-user industry

    14.18. Rest of Asia Pacific

        14.18.1. Pricing Analysis

        14.18.2. Market Share Analysis, 2021

            14.18.2.1. By Platform

            14.18.2.2. By End-user type

            14.18.2.3. By End-user industry

    14.19. GCC Countries

        14.19.1. Pricing Analysis

        14.19.2. Market Share Analysis, 2021

            14.19.2.1. By Platform

            14.19.2.2. By End-user type

            14.19.2.3. By End-user industry

    14.20. South Africa

        14.20.1. Pricing Analysis

        14.20.2. Market Share Analysis, 2021

            14.20.2.1. By Platform

            14.20.2.2. By End-user type

            14.20.2.3. By End-user industry

    14.21. Israel

        14.21.1. Pricing Analysis

        14.21.2. Market Share Analysis, 2021

            14.21.2.1. By Platform

            14.21.2.2. By End-user type

            14.21.2.3. By End-user industry

    14.22. Rest of MEA

        14.22.1. Pricing Analysis

        14.22.2. Market Share Analysis, 2021

            14.22.2.1. By Platform

            14.22.2.2. By End-user type

            14.22.2.3. By End-user industry

15. Market Structure Analysis

    15.1. Competition Dashboard

    15.2. Competition Benchmarking

    15.3. Market Share Analysis of Top Players

        15.3.1. By Regional

        15.3.2. By Platform

        15.3.3. By End-user type

        15.3.4. By End-user industry

16. Competition Analysis

    16.1. Competition Deep Dive

        16.1.1. Hootsuite Inc.

            16.1.1.1. Overview

            16.1.1.2. Product Portfolio

            16.1.1.3. Profitability by Market Segments

            16.1.1.4. Sales Footprint

            16.1.1.5. Strategy Overview

                16.1.1.5.1. Marketing Strategy

        16.1.2. Facebook (Facebook Ads Manager)

            16.1.2.1. Overview

            16.1.2.2. Product Portfolio

            16.1.2.3. Profitability by Market Segments

            16.1.2.4. Sales Footprint

            16.1.2.5. Strategy Overview

                16.1.2.5.1. Marketing Strategy

        16.1.3. Qwaya

            16.1.3.1. Overview

            16.1.3.2. Product Portfolio

            16.1.3.3. Profitability by Market Segments

            16.1.3.4. Sales Footprint

            16.1.3.5. Strategy Overview

                16.1.3.5.1. Marketing Strategy

        16.1.4. AdEspresso, Inc.

            16.1.4.1. Overview

            16.1.4.2. Product Portfolio

            16.1.4.3. Profitability by Market Segments

            16.1.4.4. Sales Footprint

            16.1.4.5. Strategy Overview

                16.1.4.5.1. Marketing Strategy

        16.1.5. Social Ads Tool

            16.1.5.1. Overview

            16.1.5.2. Product Portfolio

            16.1.5.3. Profitability by Market Segments

            16.1.5.4. Sales Footprint

            16.1.5.5. Strategy Overview

                16.1.5.5.1. Marketing Strategy

        16.1.6. ADSTAGE

            16.1.6.1. Overview

            16.1.6.2. Product Portfolio

            16.1.6.3. Profitability by Market Segments

            16.1.6.4. Sales Footprint

            16.1.6.5. Strategy Overview

                16.1.6.5.1. Marketing Strategy

        16.1.7. AgoraPulse

            16.1.7.1. Overview

            16.1.7.2. Product Portfolio

            16.1.7.3. Profitability by Market Segments

            16.1.7.4. Sales Footprint

            16.1.7.5. Strategy Overview

                16.1.7.5.1. Marketing Strategy

        16.1.8. Sprout Social, Inc.

            16.1.8.1. Overview

            16.1.8.2. Product Portfolio

            16.1.8.3. Profitability by Market Segments

            16.1.8.4. Sales Footprint

            16.1.8.5. Strategy Overview

                16.1.8.5.1. Marketing Strategy

        16.1.9. Driftrock Ltd.

            16.1.9.1. Overview

            16.1.9.2. Product Portfolio

            16.1.9.3. Profitability by Market Segments

            16.1.9.4. Sales Footprint

            16.1.9.5. Strategy Overview

                16.1.9.5.1. Marketing Strategy

        16.1.10. AdRoll

            16.1.10.1. Overview

            16.1.10.2. Product Portfolio

            16.1.10.3. Profitability by Market Segments

            16.1.10.4. Sales Footprint

            16.1.10.5. Strategy Overview

                16.1.10.5.1. Marketing Strategy

17. Assumptions & Acronyms Used

18. Research Methodology

Don't pay for what you don't need

Customize your report by selecting specific countries or regions and save 30%!

List of Tables

Table 1: Global Social Advertising Tools Market Value (US$ Mn) Forecast by Region, 2017-2032

Table 2: Global Social Advertising Tools Market Value (US$ Mn) Forecast by Platform, 2017-2032

Table 3: Global Social Advertising Tools Market Value (US$ Mn) Forecast by End-user type, 2017-2032

Table 4: Global Social Advertising Tools Market Value (US$ Mn) Forecast by End-user industry, 2017-2032

Table 5: North America Social Advertising Tools Market Value (US$ Mn) Forecast by Country, 2017-2032

Table 6: North America Social Advertising Tools Market Value (US$ Mn) Forecast by Platform, 2017-2032

Table 7: North America Social Advertising Tools Market Value (US$ Mn) Forecast by End-user type, 2017-2032

Table 8: North America Social Advertising Tools Market Value (US$ Mn) Forecast by End-user industry, 2017-2032

Table 9: Latin America Social Advertising Tools Market Value (US$ Mn) Forecast by Country, 2017-2032

Table 10: Latin America Social Advertising Tools Market Value (US$ Mn) Forecast by Platform, 2017-2032

Table 11: Latin America Social Advertising Tools Market Value (US$ Mn) Forecast by End-user type, 2017-2032

Table 12: Latin America Social Advertising Tools Market Value (US$ Mn) Forecast by End-user industry, 2017-2032

Table 13: Europe Social Advertising Tools Market Value (US$ Mn) Forecast by Country, 2017-2032

Table 14: Europe Social Advertising Tools Market Value (US$ Mn) Forecast by Platform, 2017-2032

Table 15: Europe Social Advertising Tools Market Value (US$ Mn) Forecast by End-user type, 2017-2032

Table 16: Europe Social Advertising Tools Market Value (US$ Mn) Forecast by End-user industry, 2017-2032

Table 17: Asia Pacific Social Advertising Tools Market Value (US$ Mn) Forecast by Country, 2017-2032

Table 18: Asia Pacific Social Advertising Tools Market Value (US$ Mn) Forecast by Platform, 2017-2032

Table 19: Asia Pacific Social Advertising Tools Market Value (US$ Mn) Forecast by End-user type, 2017-2032

Table 20: Asia Pacific Social Advertising Tools Market Value (US$ Mn) Forecast by End-user industry, 2017-2032

Table 21: MEA Social Advertising Tools Market Value (US$ Mn) Forecast by Country, 2017-2032

Table 22: MEA Social Advertising Tools Market Value (US$ Mn) Forecast by Platform, 2017-2032

Table 23: MEA Social Advertising Tools Market Value (US$ Mn) Forecast by End-user type, 2017-2032

Table 24: MEA Social Advertising Tools Market Value (US$ Mn) Forecast by End-user industry, 2017-2032
Sudip Saha
Sudip Saha

Principal Consultant

Talk to Analyst

Find your sweet spots for generating winning opportunities in this market.

List of Charts

Figure 1: Global Social Advertising Tools Market Value (US$ Mn) by Platform, 2022-2032

Figure 2: Global Social Advertising Tools Market Value (US$ Mn) by End-user type, 2022-2032

Figure 3: Global Social Advertising Tools Market Value (US$ Mn) by End-user industry, 2022-2032

Figure 4: Global Social Advertising Tools Market Value (US$ Mn) by Region, 2022-2032

Figure 5: Global Social Advertising Tools Market Value (US$ Mn) Analysis by Region, 2017-2032

Figure 6: Global Social Advertising Tools Market Value Share (%) and BPS Analysis by Region, 2022-2032

Figure 7: Global Social Advertising Tools Market Y-o-Y Growth (%) Projections by Region, 2022-2032

Figure 8: Global Social Advertising Tools Market Value (US$ Mn) Analysis by Platform, 2017-2032

Figure 9: Global Social Advertising Tools Market Value Share (%) and BPS Analysis by Platform, 2022-2032

Figure 10: Global Social Advertising Tools Market Y-o-Y Growth (%) Projections by Platform, 2022-2032

Figure 11: Global Social Advertising Tools Market Value (US$ Mn) Analysis by End-user type, 2017-2032

Figure 12: Global Social Advertising Tools Market Value Share (%) and BPS Analysis by End-user type, 2022-2032

Figure 13: Global Social Advertising Tools Market Y-o-Y Growth (%) Projections by End-user type, 2022-2032

Figure 14: Global Social Advertising Tools Market Value (US$ Mn) Analysis by End-user industry, 2017-2032

Figure 15: Global Social Advertising Tools Market Value Share (%) and BPS Analysis by End-user industry, 2022-2032

Figure 16: Global Social Advertising Tools Market Y-o-Y Growth (%) Projections by End-user industry, 2022-2032

Figure 17: Global Social Advertising Tools Market Attractiveness by Platform, 2022-2032

Figure 18: Global Social Advertising Tools Market Attractiveness by End-user type, 2022-2032

Figure 19: Global Social Advertising Tools Market Attractiveness by End-user industry, 2022-2032

Figure 20: Global Social Advertising Tools Market Attractiveness by Region, 2022-2032

Figure 21: North America Social Advertising Tools Market Value (US$ Mn) by Platform, 2022-2032

Figure 22: North America Social Advertising Tools Market Value (US$ Mn) by End-user type, 2022-2032

Figure 23: North America Social Advertising Tools Market Value (US$ Mn) by End-user industry, 2022-2032

Figure 24: North America Social Advertising Tools Market Value (US$ Mn) by Country, 2022-2032

Figure 25: North America Social Advertising Tools Market Value (US$ Mn) Analysis by Country, 2017-2032

Figure 26: North America Social Advertising Tools Market Value Share (%) and BPS Analysis by Country, 2022-2032

Figure 27: North America Social Advertising Tools Market Y-o-Y Growth (%) Projections by Country, 2022-2032

Figure 28: North America Social Advertising Tools Market Value (US$ Mn) Analysis by Platform, 2017-2032

Figure 29: North America Social Advertising Tools Market Value Share (%) and BPS Analysis by Platform, 2022-2032

Figure 30: North America Social Advertising Tools Market Y-o-Y Growth (%) Projections by Platform, 2022-2032

Figure 31: North America Social Advertising Tools Market Value (US$ Mn) Analysis by End-user type, 2017-2032

Figure 32: North America Social Advertising Tools Market Value Share (%) and BPS Analysis by End-user type, 2022-2032

Figure 33: North America Social Advertising Tools Market Y-o-Y Growth (%) Projections by End-user type, 2022-2032

Figure 34: North America Social Advertising Tools Market Value (US$ Mn) Analysis by End-user industry, 2017-2032

Figure 35: North America Social Advertising Tools Market Value Share (%) and BPS Analysis by End-user industry, 2022-2032

Figure 36: North America Social Advertising Tools Market Y-o-Y Growth (%) Projections by End-user industry, 2022-2032

Figure 37: North America Social Advertising Tools Market Attractiveness by Platform, 2022-2032

Figure 38: North America Social Advertising Tools Market Attractiveness by End-user type, 2022-2032

Figure 39: North America Social Advertising Tools Market Attractiveness by End-user industry, 2022-2032

Figure 40: North America Social Advertising Tools Market Attractiveness by Country, 2022-2032

Figure 41: Latin America Social Advertising Tools Market Value (US$ Mn) by Platform, 2022-2032

Figure 42: Latin America Social Advertising Tools Market Value (US$ Mn) by End-user type, 2022-2032

Figure 43: Latin America Social Advertising Tools Market Value (US$ Mn) by End-user industry, 2022-2032

Figure 44: Latin America Social Advertising Tools Market Value (US$ Mn) by Country, 2022-2032

Figure 45: Latin America Social Advertising Tools Market Value (US$ Mn) Analysis by Country, 2017-2032

Figure 46: Latin America Social Advertising Tools Market Value Share (%) and BPS Analysis by Country, 2022-2032

Figure 47: Latin America Social Advertising Tools Market Y-o-Y Growth (%) Projections by Country, 2022-2032

Figure 48: Latin America Social Advertising Tools Market Value (US$ Mn) Analysis by Platform, 2017-2032

Figure 49: Latin America Social Advertising Tools Market Value Share (%) and BPS Analysis by Platform, 2022-2032

Figure 50: Latin America Social Advertising Tools Market Y-o-Y Growth (%) Projections by Platform, 2022-2032

Figure 51: Latin America Social Advertising Tools Market Value (US$ Mn) Analysis by End-user type, 2017-2032

Figure 52: Latin America Social Advertising Tools Market Value Share (%) and BPS Analysis by End-user type, 2022-2032

Figure 53: Latin America Social Advertising Tools Market Y-o-Y Growth (%) Projections by End-user type, 2022-2032

Figure 54: Latin America Social Advertising Tools Market Value (US$ Mn) Analysis by End-user industry, 2017-2032

Figure 55: Latin America Social Advertising Tools Market Value Share (%) and BPS Analysis by End-user industry, 2022-2032

Figure 56: Latin America Social Advertising Tools Market Y-o-Y Growth (%) Projections by End-user industry, 2022-2032

Figure 57: Latin America Social Advertising Tools Market Attractiveness by Platform, 2022-2032

Figure 58: Latin America Social Advertising Tools Market Attractiveness by End-user type, 2022-2032

Figure 59: Latin America Social Advertising Tools Market Attractiveness by End-user industry, 2022-2032

Figure 60: Latin America Social Advertising Tools Market Attractiveness by Country, 2022-2032

Figure 61: Europe Social Advertising Tools Market Value (US$ Mn) by Platform, 2022-2032

Figure 62: Europe Social Advertising Tools Market Value (US$ Mn) by End-user type, 2022-2032

Figure 63: Europe Social Advertising Tools Market Value (US$ Mn) by End-user industry, 2022-2032

Figure 64: Europe Social Advertising Tools Market Value (US$ Mn) by Country, 2022-2032

Figure 65: Europe Social Advertising Tools Market Value (US$ Mn) Analysis by Country, 2017-2032

Figure 66: Europe Social Advertising Tools Market Value Share (%) and BPS Analysis by Country, 2022-2032

Figure 67: Europe Social Advertising Tools Market Y-o-Y Growth (%) Projections by Country, 2022-2032

Figure 68: Europe Social Advertising Tools Market Value (US$ Mn) Analysis by Platform, 2017-2032

Figure 69: Europe Social Advertising Tools Market Value Share (%) and BPS Analysis by Platform, 2022-2032

Figure 70: Europe Social Advertising Tools Market Y-o-Y Growth (%) Projections by Platform, 2022-2032

Figure 71: Europe Social Advertising Tools Market Value (US$ Mn) Analysis by End-user type, 2017-2032

Figure 72: Europe Social Advertising Tools Market Value Share (%) and BPS Analysis by End-user type, 2022-2032

Figure 73: Europe Social Advertising Tools Market Y-o-Y Growth (%) Projections by End-user type, 2022-2032

Figure 74: Europe Social Advertising Tools Market Value (US$ Mn) Analysis by End-user industry, 2017-2032

Figure 75: Europe Social Advertising Tools Market Value Share (%) and BPS Analysis by End-user industry, 2022-2032

Figure 76: Europe Social Advertising Tools Market Y-o-Y Growth (%) Projections by End-user industry, 2022-2032

Figure 77: Europe Social Advertising Tools Market Attractiveness by Platform, 2022-2032

Figure 78: Europe Social Advertising Tools Market Attractiveness by End-user type, 2022-2032

Figure 79: Europe Social Advertising Tools Market Attractiveness by End-user industry, 2022-2032

Figure 80: Europe Social Advertising Tools Market Attractiveness by Country, 2022-2032

Figure 81: Asia Pacific Social Advertising Tools Market Value (US$ Mn) by Platform, 2022-2032

Figure 82: Asia Pacific Social Advertising Tools Market Value (US$ Mn) by End-user type, 2022-2032

Figure 83: Asia Pacific Social Advertising Tools Market Value (US$ Mn) by End-user industry, 2022-2032

Figure 84: Asia Pacific Social Advertising Tools Market Value (US$ Mn) by Country, 2022-2032

Figure 85: Asia Pacific Social Advertising Tools Market Value (US$ Mn) Analysis by Country, 2017-2032

Figure 86: Asia Pacific Social Advertising Tools Market Value Share (%) and BPS Analysis by Country, 2022-2032

Figure 87: Asia Pacific Social Advertising Tools Market Y-o-Y Growth (%) Projections by Country, 2022-2032

Figure 88: Asia Pacific Social Advertising Tools Market Value (US$ Mn) Analysis by Platform, 2017-2032

Figure 89: Asia Pacific Social Advertising Tools Market Value Share (%) and BPS Analysis by Platform, 2022-2032

Figure 90: Asia Pacific Social Advertising Tools Market Y-o-Y Growth (%) Projections by Platform, 2022-2032

Figure 91: Asia Pacific Social Advertising Tools Market Value (US$ Mn) Analysis by End-user type, 2017-2032

Figure 92: Asia Pacific Social Advertising Tools Market Value Share (%) and BPS Analysis by End-user type, 2022-2032

Figure 93: Asia Pacific Social Advertising Tools Market Y-o-Y Growth (%) Projections by End-user type, 2022-2032

Figure 94: Asia Pacific Social Advertising Tools Market Value (US$ Mn) Analysis by End-user industry, 2017-2032

Figure 95: Asia Pacific Social Advertising Tools Market Value Share (%) and BPS Analysis by End-user industry, 2022-2032

Figure 96: Asia Pacific Social Advertising Tools Market Y-o-Y Growth (%) Projections by End-user industry, 2022-2032

Figure 97: Asia Pacific Social Advertising Tools Market Attractiveness by Platform, 2022-2032

Figure 98: Asia Pacific Social Advertising Tools Market Attractiveness by End-user type, 2022-2032

Figure 99: Asia Pacific Social Advertising Tools Market Attractiveness by End-user industry, 2022-2032

Figure 100: Asia Pacific Social Advertising Tools Market Attractiveness by Country, 2022-2032

Figure 101: MEA Social Advertising Tools Market Value (US$ Mn) by Platform, 2022-2032

Figure 102: MEA Social Advertising Tools Market Value (US$ Mn) by End-user type, 2022-2032

Figure 103: MEA Social Advertising Tools Market Value (US$ Mn) by End-user industry, 2022-2032

Figure 104: MEA Social Advertising Tools Market Value (US$ Mn) by Country, 2022-2032

Figure 105: MEA Social Advertising Tools Market Value (US$ Mn) Analysis by Country, 2017-2032

Figure 106: MEA Social Advertising Tools Market Value Share (%) and BPS Analysis by Country, 2022-2032

Figure 107: MEA Social Advertising Tools Market Y-o-Y Growth (%) Projections by Country, 2022-2032

Figure 108: MEA Social Advertising Tools Market Value (US$ Mn) Analysis by Platform, 2017-2032

Figure 109: MEA Social Advertising Tools Market Value Share (%) and BPS Analysis by Platform, 2022-2032

Figure 110: MEA Social Advertising Tools Market Y-o-Y Growth (%) Projections by Platform, 2022-2032

Figure 111: MEA Social Advertising Tools Market Value (US$ Mn) Analysis by End-user type, 2017-2032

Figure 112: MEA Social Advertising Tools Market Value Share (%) and BPS Analysis by End-user type, 2022-2032

Figure 113: MEA Social Advertising Tools Market Y-o-Y Growth (%) Projections by End-user type, 2022-2032

Figure 114: MEA Social Advertising Tools Market Value (US$ Mn) Analysis by End-user industry, 2017-2032

Figure 115: MEA Social Advertising Tools Market Value Share (%) and BPS Analysis by End-user industry, 2022-2032

Figure 116: MEA Social Advertising Tools Market Y-o-Y Growth (%) Projections by End-user industry, 2022-2032

Figure 117: MEA Social Advertising Tools Market Attractiveness by Platform, 2022-2032

Figure 118: MEA Social Advertising Tools Market Attractiveness by End-user type, 2022-2032

Figure 119: MEA Social Advertising Tools Market Attractiveness by End-user industry, 2022-2032

Figure 120: MEA Social Advertising Tools Market Attractiveness by Country, 2022-2032

Recommendations

Technology

Native Video Advertising Market

Published : May 2022

Technology

Social Video Advertising Market

Published : May 2022

Explore Technology Insights

View Reports

Social Advertising Tools Market