Reports

- Global Locations -

Headquarters

Future Market Insights, Inc.

Christiana Corporate, 200
Continental Drive, Suite 401,
Newark, Delaware - 19713,
United States

T: +1-845-579-5705

Americas

Future Market Insights, Inc.

616 Corporate Way, Suite 2-9018,
Valley Cottage, NY 10989, United States

T: +1-347-918-3531

MEA

Future Market Insights

1602-6 Jumeirah Bay X2 Tower, Plot No: JLT-PH2-X2A,
Jumeirah Lakes Towers, Dubai,
United Arab Emirates

Europe

Future Market Insights

3rd Floor, 207 Regent Street,
W1B 3HH London
United Kingdom

T: + 44 (0) 20 8123 9659
D: +44 (0) 20 3287 4268

Asia Pacific

Future Market Insights

Office No. 401-A, 4th Floor,
VANTAGE 9, S.No. 36/1/1,
Baner, Pune 411045, India

Pharma and Healthcare Social Media Marketing Market

Pharma and Healthcare Social Media Marketing Market Snapshot (2022 to 2032)

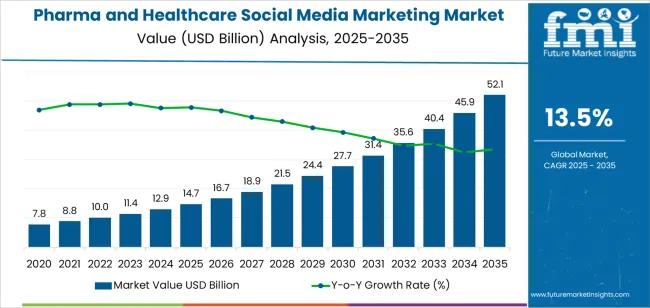
The global pharma and healthcare social media marketing market is expected to be valued at US$ 11,060.0 Million in 2022. Pharma and healthcare social media marketing is an area that is extremely relevant to the modern, digital age, where stakeholders in the pharmaceuticals and healthcare industries are reaching out to their potential customers through digital, social media platforms. The overall demand for pharma and healthcare social media marketing is projected to grow at a CAGR of 17.5% between 2022 and 2032, totaling around US$ 55,500.0 Million by 2032.

Data Points Key Statistics
Pharma and Healthcare Social Media Marketing Market Value 2022 US$ 11,060.0 Million
Pharma and Healthcare Social Media Marketing Market Projected Value (2032) US$ 55,500.0 Million
Pharma and Healthcare Social Media Marketing Market CAGR (2022 to 2032) 17.5%

Don't pay for what you don't need

Customize your report by selecting specific countries or regions and save 30%!

Pharma and Healthcare Social Media Marketing Demand Analysis (2016 to 2021) Vs Market Outlook (2022 to 2032)

From 2016 to 2021, sales witnessed significant growth, registering a CAGR of 13.2%. The global market for pharma and healthcare social media marketing services is booming in the information age, as almost all the stakeholders in the pharma and healthcare industries are emerging in the world of social media to market their products, mainly because their potential customers are spending most of their time on social media.

Though social media tools are proving highly effective for the marketing of pharma and healthcare products in the world of customer-centric business, their use is still a matter of debate among end users. Nevertheless, the overall growth of the global market for pharma and healthcare social media marketing services is expected to witness astonishing growth in the coming years, as a majority of businesses are taking their operations digitally.

Leading players in the market are increasing their focus on crafting creative marketing campaigns to help their customers gain a competitive advantage through more effective interaction and engagement with their target audience consistently. The overall demand for the pharma and healthcare social media marketing market is projected to grow at a CAGR of 17.5% between 2022 and 2032, totaling around US$ 55,500.0 Million by 2032.

Which Drivers Underpin Pharma and Healthcare Social Media Marketing Industry Expansion?

Social Media Marketing Strategies to Help Strengthen Customer Relationships

Leading players in the pharmaceuticals and healthcare sector have always been experimenting with innovative ways to expand their customer base and gain a competitive advantage, while there are multiple restrictions on the advertising and marketing of pharmaceuticals and medical products. However, social media platforms have emerged as a useful tool for pharma and healthcare companies to implement effective marketing campaigns that can give amplified results to their efforts of improving engagement, expanding their customer base, and ultimately, dramatically boosting brand performance in global markets.

Global leaders in the pharmaceuticals and healthcare markets are leveraging modern social media platforms to establish a new brand identity and create brand awareness among their existing as well as potential customer bases. This enables them to create a personal bond with each one of their audience on social media, which further strengthens their customer relationship management operations, and it is expected to further highlight the importance of social media marketing among pharma and healthcare companies in the coming years.

In addition to this, social media marketing is also giving a completely different perspective to pharma and healthcare marketing, as it can also contribute to the end users’ efforts not only in building but also in improving corporate communication and investor relations. It has also helped them improve their customer services even on corporate levels through the implementation of creative social media marketing campaigns.

Sudip Saha
Sudip Saha

Principal Consultant

Talk to Analyst

Find your sweet spots for generating winning opportunities in this market.

Which Factors are limiting the Growth of the Pharma and Healthcare Social Media Marketing Market?

Involvement of Regulatory Bodies may restrict the Scope of Social Media Marketing for Pharma and Healthcare Companies

The pharma and healthcare sector is subjected to various rules and regulations regarding the marketing of medical and pharmaceutical products, and this scenario also follows in the planning of social media marketing strategies for these companies. Governing bodies are modifying their traditional regulatory restrictions on the advertising of drugs and other marketing innovations in the pharma and healthcare industries.

Involvement of regulatory bodies in the global market for pharma and healthcare social media marketing is mainly in the areas of crafting and issuing guidelines in advertising drugs and biologists through interactive media. Various policies along with laws and regulations play an instrumental role in deciding the importance and effectiveness of social media in the marketing of pharma and healthcare products, though it restricts the scope of marketing campaigns.

For instance, the United States of America Food and Drug Administration (FDA) released new guidelines in January 2014, for the pharmaceuticals and healthcare industries defining the regulatory requirements vis-a-vis the marketing submissions for human and animal drugs across social media platforms. Through its draft, the FDA also clarified various guidelines for content creators and marketers working in the pharmaceutical and healthcare marketing industry while working on the dissemination of branded information about drugs and biologics.

Region-wise Insights

Will North America Continue Dominance in the Global Pharma and Healthcare Social Media Marketing Market?

Rising Market Competition to Boost the Market Growth in North America

The North America Pharma and Healthcare Social Media Marketing market is expected to accumulate a market share of 34.4% in 2022. Though the social media marketing industry has defied all the norms of geographical boundaries, the growth of the pharma and healthcare social media marketing market is expected to remain significantly high in developed countries - mainly in the United States of America.

With the increasing number of pharma and healthcare companies making a tectonic shift from traditional marketing platforms to social media platforms, the demand for pharma and healthcare social media marketing services is increasing in North America. A mounting number of digital marketing agencies are jumping to grab the lucrative opportunities in the North American market for pharma and healthcare social media marketing.

How Big is the Pharma and Healthcare Social Media Marketing Market in Europe?

Rising Research and Development to Boost Market Growth in Europe

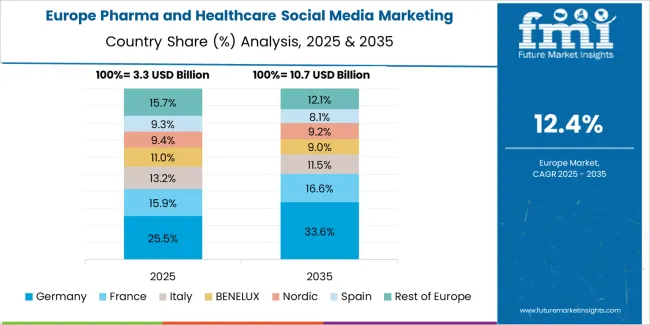
The European region is anticipated to hold a market share of 21.2%.  Extensive research and studies have taken place in the European market. Social media tools in the region are enabling one-to-one interactions among stakeholders and their target customers via content creation, and sharing, along with the exchange of new ideas and information about products through virtual communities and social networks.

Get the data you need at a Fraction of the cost

Personalize your report by choosing insights you need
and save 40%!

Start-ups For Pharma and Healthcare Social Media Marketing Market

Some key start-ups in the Pharma and Healthcare Social Media Marketing market include-

  • Founded in 2006, Semgeeks is a nationally-recognized digital agency with the goal of growing and scaling your company. Our team of 20+ has extensive experience in integrated creative/development and digital marketing strategies for both B2B and B2C clientele, including Fortune 500 brands. For the last 16 years, the team has helped its clients craft, refine and optimize their digital strategy through a multitude of strategies such as PPC, SEO, Email, Social, and Web Design/Development with experience on channels like Google.
  • SEOteric is a search-first digital marketing agency that evolved from our roots as an SEO firm. Founded in 2009, the company specializes in creating marketing strategies for businesses to engage with customers by leveraging SEO, PPC advertising, social media, email, and websites. The team has two main divisions of Marketing Operations and Website Operations.

Who are the Leading Players in the Pharma and Healthcare Social Media Marketing Market?

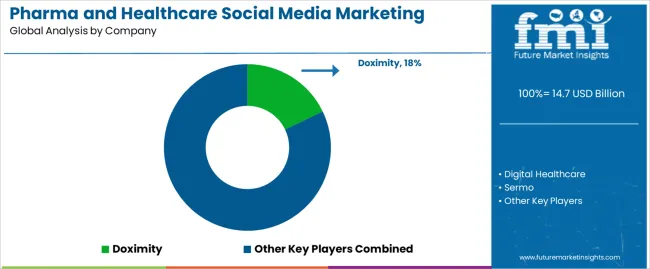
Prominent players in the Pharma and Healthcare Social Media Marketing market are Digital Healthcare, Sermo, MomMD, Student Doctors Network, QuantiaMD, Doximity, Healthcare and Medical Software, Orthomind, WeMedUp, Medical Apps, DoctorsHangout, Nurse Zone, All Nurses, Medical Doctors, Ozmosis, and other regional players.

  • In January 2022, Docstokes, a pioneer in healthcare digital marketing, is planning to spread its wings across the country and provide the healthcare industry with a helping hand in undergoing a major digital transformation. The company works towards bridging the gap between the integrated marketing needs of doctors with solutions offered by marketing and IT experts.
  • Through its vast offerings, digital branding, and strategy consultancy, Docstokes aims to reach more healthcare professionals in need in the near future. In 2021, Docstokes took a major leap and is now servicing doctors (clients) based out of Mumbai, Delhi, Ahmedabad, and Surat, creating and maintaining their brand profiles with a strong marketing plan. With its growing popularity, majorly in the western region, Docstokes is now expanding its offices in Pune, Mumbai, Gurgaon, and Delhi-NCR.

Report Scope

Report Attributes Details
Growth Rate CAGR of 17.5% from 2022 to 2032
Market Value in 2022 US$ 11,060.0 Million
Market Value in 2032 US$ 55,500.0 Million
Base Year for Estimation 2021
Historical Data 2016 to 2021
Forecast Period 2022 to 2032
Quantitative Units Revenue in US$ Million and CAGR from 2022 to 2032
Report Coverage Revenue Forecast, Company Ranking, Competitive Landscape, Growth Factors, Trends, and Pricing Analysis
Segments Covered
  • End User
  • Social Media Platform
  • Region
Regions Covered
  • North America
  • Latin America
  • Europe
  • Asia Pacific
  • Middle East and Africa (MEA)
Key Countries Profiled
  • USA
  • Canada
  • Brazil
  • Mexico
  • Germany
  • United Kingdom
  • France
  • Spain
  • Italy
  • China
  • Japan
  • South Korea
  • Malaysia
  • Singapore
  • Thailand
  • Australia
  • New Zealand
  • GCC Countries
  • South Africa
  • Israel
Key Companies Profiled
  • Digital Healthcare
  • Sermo
  • MomMD
  • Student Doctors Network
  • QuantiaMD
  • Doximity
  • Healthcare and Medical Software
  • Orthomind
  • WeMedUp
  • Medical Apps
  • DoctorsHangout
  • Nurse Zone
  • All Nurses
  • Medical Doctors
  • Ozmosis
Customization & Pricing Available upon Request

Key Segments Covered in the Pharma and Healthcare Social Media Marketing Industry Analysis

By Social Media Platform:

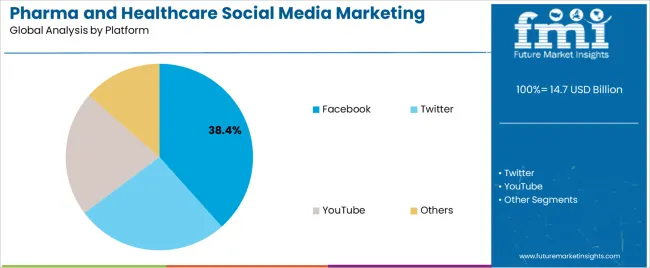
  • YouTube
  • Twitter
  • Instagram
  • Facebook

By End User:

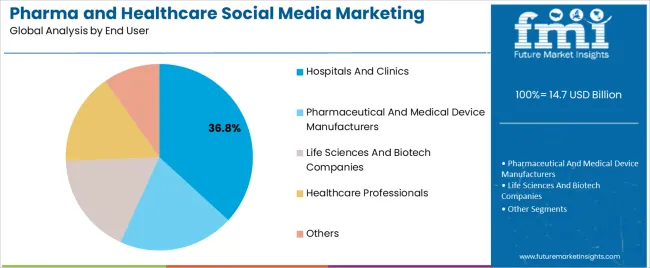
  • Healthcare Professionals
  • Hospitals
  • Biotechnology Companies
  • Patients/Consumers

By Region:

  • North America
  • Latin America
  • Europe
  • Asia Pacific
  • Middle East & Africa

Frequently Asked Questions

As of 2022, the Pharma and Healthcare Social Media Marketing market is slated to reach a valuation of US$ 11,060.0 Million

From 2022 to 2032, sales of Pharma and Healthcare Social Media Marketing are expected to grow at a 17.5% CAGR

By 2032, Future Market Insights expects the Pharma and Healthcare Social Media Marketing market to reach US$ 55,500.0 Million.

Table of Content

1. Executive Summary | Pharma and Healthcare Social Media Marketing Market

    1.1. Global Market Outlook

    1.2. Demand-side Trends

    1.3. Supply-side Trends

    1.4. Technology Roadmap Analysis

    1.5. Analysis and Recommendations

2. Market Overview

    2.1. Market Coverage / Taxonomy

    2.2. Market Definition / Scope / Limitations

3. Market Background

    3.1. Market Dynamics

        3.1.1. Drivers

        3.1.2. Restraints

        3.1.3. Opportunity

        3.1.4. Trends

    3.2. Scenario Forecast

        3.2.1. Demand in Optimistic Scenario

        3.2.2. Demand in Likely Scenario

        3.2.3. Demand in Conservative Scenario

    3.3. Opportunity Map Analysis

    3.4. Investment Feasibility Matrix

    3.5. PESTLE and Porter’s Analysis

    3.6. Regulatory Landscape

        3.6.1. By Key Regions

        3.6.2. By Key Countries

    3.7. Regional Parent Market Outlook

4. Global Market Analysis 2016 to 2021 and Forecast, 2022 to 2032

    4.1. Historical Market Size Value (US$ Million) Analysis, 2016 to 2021

    4.2. Current and Future Market Size Value (US$ Million) Projections, 2022 to 2032

        4.2.1. Y-o-Y Growth Trend Analysis

        4.2.2. Absolute $ Opportunity Analysis

5. Global Market Analysis 2016 to 2021 and Forecast 2022 to 2032, By Social Media Platform

    5.1. Introduction / Key Findings

    5.2. Historical Market Size Value (US$ Million) Analysis By Social Media Platform, 2016 to 2021

    5.3. Current and Future Market Size Value (US$ Million) Analysis and Forecast By Social Media Platform, 2022 to 2032

        5.3.1. YouTube

        5.3.2. Twitter

        5.3.3. Instagram

        5.3.4. Facebook

    5.4. Y-o-Y Growth Trend Analysis By Social Media Platform, 2016 to 2021

    5.5. Absolute $ Opportunity Analysis By Social Media Platform, 2022 to 2032

6. Global Market Analysis 2016 to 2021 and Forecast 2022 to 2032, By End User

    6.1. Introduction / Key Findings

    6.2. Historical Market Size Value (US$ Million) Analysis By End User, 2016 to 2021

    6.3. Current and Future Market Size Value (US$ Million) Analysis and Forecast By End User, 2022 to 2032

        6.3.1. Healthcare Professionals

        6.3.2. Hospitals

        6.3.3. Biotechnology Companies

        6.3.4. Patients/Consumers

    6.4. Y-o-Y Growth Trend Analysis By End User, 2016 to 2021

    6.5. Absolute $ Opportunity Analysis By End User, 2022 to 2032

7. Global Market Analysis 2016 to 2021 and Forecast 2022 to 2032, By Region

    7.1. Introduction

    7.2. Historical Market Size Value (US$ Million) Analysis By Region, 2016 to 2021

    7.3. Current Market Size Value (US$ Million) Analysis and Forecast By Region, 2022 to 2032

        7.3.1. North America

        7.3.2. Latin America

        7.3.3. Europe

        7.3.4. South Asia

        7.3.5. East Asia

        7.3.6. Oceania

        7.3.7. Middle East and Africa(MEA)

    7.4. Market Attractiveness Analysis By Region

8. North America Market Analysis 2016 to 2021 and Forecast 2022 to 2032, By Country

    8.1. Historical Market Size Value (US$ Million) Trend Analysis By Market Taxonomy, 2016 to 2021

    8.2. Market Size Value (US$ Million) Forecast By Market Taxonomy, 2022 to 2032

        8.2.1. By Country

            8.2.1.1. USA

            8.2.1.2. Canada

        8.2.2. By Social Media Platform

        8.2.3. By End User

    8.3. Market Attractiveness Analysis

        8.3.1. By Country

        8.3.2. By Social Media Platform

        8.3.3. By End User

    8.4. Key Takeaways

9. Latin America Market Analysis 2016 to 2021 and Forecast 2022 to 2032, By Country

    9.1. Historical Market Size Value (US$ Million) Trend Analysis By Market Taxonomy, 2016 to 2021

    9.2. Market Size Value (US$ Million) Forecast By Market Taxonomy, 2022 to 2032

        9.2.1. By Country

            9.2.1.1. Brazil

            9.2.1.2. Mexico

            9.2.1.3. Rest of Latin America

        9.2.2. By Social Media Platform

        9.2.3. By End User

    9.3. Market Attractiveness Analysis

        9.3.1. By Country

        9.3.2. By Social Media Platform

        9.3.3. By End User

    9.4. Key Takeaways

10. Europe Market Analysis 2016 to 2021 and Forecast 2022 to 2032, By Country

    10.1. Historical Market Size Value (US$ Million) Trend Analysis By Market Taxonomy, 2016 to 2021

    10.2. Market Size Value (US$ Million) Forecast By Market Taxonomy, 2022 to 2032

        10.2.1. By Country

            10.2.1.1. Germany

            10.2.1.2. United Kingdom

            10.2.1.3. France

            10.2.1.4. Spain

            10.2.1.5. Italy

            10.2.1.6. Rest of Europe

        10.2.2. By Social Media Platform

        10.2.3. By End User

    10.3. Market Attractiveness Analysis

        10.3.1. By Country

        10.3.2. By Social Media Platform

        10.3.3. By End User

    10.4. Key Takeaways

11. South Asia Market Analysis 2016 to 2021 and Forecast 2022 to 2032, By Country

    11.1. Historical Market Size Value (US$ Million) Trend Analysis By Market Taxonomy, 2016 to 2021

    11.2. Market Size Value (US$ Million) Forecast By Market Taxonomy, 2022 to 2032

        11.2.1. By Country

            11.2.1.1. India

            11.2.1.2. Malaysia

            11.2.1.3. Singapore

            11.2.1.4. Thailand

            11.2.1.5. Rest of South Asia

        11.2.2. By Social Media Platform

        11.2.3. By End User

    11.3. Market Attractiveness Analysis

        11.3.1. By Country

        11.3.2. By Social Media Platform

        11.3.3. By End User

    11.4. Key Takeaways

12. East Asia Market Analysis 2016 to 2021 and Forecast 2022 to 2032, By Country

    12.1. Historical Market Size Value (US$ Million) Trend Analysis By Market Taxonomy, 2016 to 2021

    12.2. Market Size Value (US$ Million) Forecast By Market Taxonomy, 2022 to 2032

        12.2.1. By Country

            12.2.1.1. China

            12.2.1.2. Japan

            12.2.1.3. South Korea

        12.2.2. By Social Media Platform

        12.2.3. By End User

    12.3. Market Attractiveness Analysis

        12.3.1. By Country

        12.3.2. By Social Media Platform

        12.3.3. By End User

    12.4. Key Takeaways

13. Oceania Market Analysis 2016 to 2021 and Forecast 2022 to 2032, By Country

    13.1. Historical Market Size Value (US$ Million) Trend Analysis By Market Taxonomy, 2016 to 2021

    13.2. Market Size Value (US$ Million) Forecast By Market Taxonomy, 2022 to 2032

        13.2.1. By Country

            13.2.1.1. Australia

            13.2.1.2. New Zealand

        13.2.2. By Social Media Platform

        13.2.3. By End User

    13.3. Market Attractiveness Analysis

        13.3.1. By Country

        13.3.2. By Social Media Platform

        13.3.3. By End User

    13.4. Key Takeaways

14. MEA Market Analysis 2016 to 2021 and Forecast 2022 to 2032, By Country

    14.1. Historical Market Size Value (US$ Million) Trend Analysis By Market Taxonomy, 2016 to 2021

    14.2. Market Size Value (US$ Million) Forecast By Market Taxonomy, 2022 to 2032

        14.2.1. By Country

            14.2.1.1. GCC Countries

            14.2.1.2. South Africa

            14.2.1.3. Israel

            14.2.1.4. Rest of Middle East and Africa(MEA)

        14.2.2. By Social Media Platform

        14.2.3. By End User

    14.3. Market Attractiveness Analysis

        14.3.1. By Country

        14.3.2. By Social Media Platform

        14.3.3. By End User

    14.4. Key Takeaways

15. Key Countries Market Analysis

    15.1. USA

        15.1.1. Pricing Analysis

        15.1.2. Market Share Analysis, 2021

            15.1.2.1. By Social Media Platform

            15.1.2.2. By End User

    15.2. Canada

        15.2.1. Pricing Analysis

        15.2.2. Market Share Analysis, 2021

            15.2.2.1. By Social Media Platform

            15.2.2.2. By End User

    15.3. Brazil

        15.3.1. Pricing Analysis

        15.3.2. Market Share Analysis, 2021

            15.3.2.1. By Social Media Platform

            15.3.2.2. By End User

    15.4. Mexico

        15.4.1. Pricing Analysis

        15.4.2. Market Share Analysis, 2021

            15.4.2.1. By Social Media Platform

            15.4.2.2. By End User

    15.5. Germany

        15.5.1. Pricing Analysis

        15.5.2. Market Share Analysis, 2021

            15.5.2.1. By Social Media Platform

            15.5.2.2. By End User

    15.6. United Kingdom

        15.6.1. Pricing Analysis

        15.6.2. Market Share Analysis, 2021

            15.6.2.1. By Social Media Platform

            15.6.2.2. By End User

    15.7. France

        15.7.1. Pricing Analysis

        15.7.2. Market Share Analysis, 2021

            15.7.2.1. By Social Media Platform

            15.7.2.2. By End User

    15.8. Spain

        15.8.1. Pricing Analysis

        15.8.2. Market Share Analysis, 2021

            15.8.2.1. By Social Media Platform

            15.8.2.2. By End User

    15.9. Italy

        15.9.1. Pricing Analysis

        15.9.2. Market Share Analysis, 2021

            15.9.2.1. By Social Media Platform

            15.9.2.2. By End User

    15.10. India

        15.10.1. Pricing Analysis

        15.10.2. Market Share Analysis, 2021

            15.10.2.1. By Social Media Platform

            15.10.2.2. By End User

    15.11. Malaysia

        15.11.1. Pricing Analysis

        15.11.2. Market Share Analysis, 2021

            15.11.2.1. By Social Media Platform

            15.11.2.2. By End User

    15.12. Singapore

        15.12.1. Pricing Analysis

        15.12.2. Market Share Analysis, 2021

            15.12.2.1. By Social Media Platform

            15.12.2.2. By End User

    15.13. Thailand

        15.13.1. Pricing Analysis

        15.13.2. Market Share Analysis, 2021

            15.13.2.1. By Social Media Platform

            15.13.2.2. By End User

    15.14. China

        15.14.1. Pricing Analysis

        15.14.2. Market Share Analysis, 2021

            15.14.2.1. By Social Media Platform

            15.14.2.2. By End User

    15.15. Japan

        15.15.1. Pricing Analysis

        15.15.2. Market Share Analysis, 2021

            15.15.2.1. By Social Media Platform

            15.15.2.2. By End User

    15.16. South Korea

        15.16.1. Pricing Analysis

        15.16.2. Market Share Analysis, 2021

            15.16.2.1. By Social Media Platform

            15.16.2.2. By End User

    15.17. Australia

        15.17.1. Pricing Analysis

        15.17.2. Market Share Analysis, 2021

            15.17.2.1. By Social Media Platform

            15.17.2.2. By End User

    15.18. New Zealand

        15.18.1. Pricing Analysis

        15.18.2. Market Share Analysis, 2021

            15.18.2.1. By Social Media Platform

            15.18.2.2. By End User

    15.19. GCC Countries

        15.19.1. Pricing Analysis

        15.19.2. Market Share Analysis, 2021

            15.19.2.1. By Social Media Platform

            15.19.2.2. By End User

    15.20. South Africa

        15.20.1. Pricing Analysis

        15.20.2. Market Share Analysis, 2021

            15.20.2.1. By Social Media Platform

            15.20.2.2. By End User

    15.21. Israel

        15.21.1. Pricing Analysis

        15.21.2. Market Share Analysis, 2021

            15.21.2.1. By Social Media Platform

            15.21.2.2. By End User

16. Market Structure Analysis

    16.1. Competition Dashboard

    16.2. Competition Benchmarking

    16.3. Market Share Analysis of Top Players

        16.3.1. By Regional

        16.3.2. By Social Media Platform

        16.3.3. By End User

17. Competition Analysis

    17.1. Competition Deep Dive

        17.1.1. Digital Healthcare

            17.1.1.1. Overview

            17.1.1.2. Product Portfolio

            17.1.1.3. Profitability by Market Segments

            17.1.1.4. Sales Footprint

            17.1.1.5. Strategy Overview

                17.1.1.5.1. Marketing Strategy

        17.1.2. Sermo

            17.1.2.1. Overview

            17.1.2.2. Product Portfolio

            17.1.2.3. Profitability by Market Segments

            17.1.2.4. Sales Footprint

            17.1.2.5. Strategy Overview

                17.1.2.5.1. Marketing Strategy

        17.1.3. MomMD

            17.1.3.1. Overview

            17.1.3.2. Product Portfolio

            17.1.3.3. Profitability by Market Segments

            17.1.3.4. Sales Footprint

            17.1.3.5. Strategy Overview

                17.1.3.5.1. Marketing Strategy

        17.1.4. Student Doctors Network

            17.1.4.1. Overview

            17.1.4.2. Product Portfolio

            17.1.4.3. Profitability by Market Segments

            17.1.4.4. Sales Footprint

            17.1.4.5. Strategy Overview

                17.1.4.5.1. Marketing Strategy

        17.1.5. QuantiaMD

            17.1.5.1. Overview

            17.1.5.2. Product Portfolio

            17.1.5.3. Profitability by Market Segments

            17.1.5.4. Sales Footprint

            17.1.5.5. Strategy Overview

                17.1.5.5.1. Marketing Strategy

        17.1.6. Doximity

            17.1.6.1. Overview

            17.1.6.2. Product Portfolio

            17.1.6.3. Profitability by Market Segments

            17.1.6.4. Sales Footprint

            17.1.6.5. Strategy Overview

                17.1.6.5.1. Marketing Strategy

        17.1.7. Healthcare and Medical Software

            17.1.7.1. Overview

            17.1.7.2. Product Portfolio

            17.1.7.3. Profitability by Market Segments

            17.1.7.4. Sales Footprint

            17.1.7.5. Strategy Overview

                17.1.7.5.1. Marketing Strategy

        17.1.8. Orthomind

            17.1.8.1. Overview

            17.1.8.2. Product Portfolio

            17.1.8.3. Profitability by Market Segments

            17.1.8.4. Sales Footprint

            17.1.8.5. Strategy Overview

                17.1.8.5.1. Marketing Strategy

        17.1.9. WeMedUp

            17.1.9.1. Overview

            17.1.9.2. Product Portfolio

            17.1.9.3. Profitability by Market Segments

            17.1.9.4. Sales Footprint

            17.1.9.5. Strategy Overview

                17.1.9.5.1. Marketing Strategy

        17.1.10. Medical Apps

            17.1.10.1. Overview

            17.1.10.2. Product Portfolio

            17.1.10.3. Profitability by Market Segments

            17.1.10.4. Sales Footprint

            17.1.10.5. Strategy Overview

                17.1.10.5.1. Marketing Strategy

        17.1.11. DoctorsHangout

            17.1.11.1. Overview

            17.1.11.2. Product Portfolio

            17.1.11.3. Profitability by Market Segments

            17.1.11.4. Sales Footprint

            17.1.11.5. Strategy Overview

                17.1.11.5.1. Marketing Strategy

        17.1.12. Nurse Zone

            17.1.12.1. Overview

            17.1.12.2. Product Portfolio

            17.1.12.3. Profitability by Market Segments

            17.1.12.4. Sales Footprint

            17.1.12.5. Strategy Overview

                17.1.12.5.1. Marketing Strategy

        17.1.13. All Nurses

            17.1.13.1. Overview

            17.1.13.2. Product Portfolio

            17.1.13.3. Profitability by Market Segments

            17.1.13.4. Sales Footprint

            17.1.13.5. Strategy Overview

                17.1.13.5.1. Marketing Strategy

        17.1.14. Medical Doctors

            17.1.14.1. Overview

            17.1.14.2. Product Portfolio

            17.1.14.3. Profitability by Market Segments

            17.1.14.4. Sales Footprint

            17.1.14.5. Strategy Overview

                17.1.14.5.1. Marketing Strategy

        17.1.15. Ozmosis

            17.1.15.1. Overview

            17.1.15.2. Product Portfolio

            17.1.15.3. Profitability by Market Segments

            17.1.15.4. Sales Footprint

            17.1.15.5. Strategy Overview

                17.1.15.5.1. Marketing Strategy

18. Assumptions & Acronyms Used

19. Research Methodology

Don't pay for what you don't need

Customize your report by selecting specific countries or regions and save 30%!

List of Tables

Table 1: Global Market Value (US$ Million) Forecast by Region, 2016 to 2032

Table 2: Global Market Value (US$ Million) Forecast by Social Media Platform, 2016 to 2032

Table 3: Global Market Value (US$ Million) Forecast by End User, 2016 to 2032

Table 4: North America Market Value (US$ Million) Forecast by Country, 2016 to 2032

Table 5: North America Market Value (US$ Million) Forecast by Social Media Platform, 2016 to 2032

Table 6: North America Market Value (US$ Million) Forecast by End User, 2016 to 2032

Table 7: Latin America Market Value (US$ Million) Forecast by Country, 2016 to 2032

Table 8: Latin America Market Value (US$ Million) Forecast by Social Media Platform, 2016 to 2032

Table 9: Latin America Market Value (US$ Million) Forecast by End User, 2016 to 2032

Table 10: Europe Market Value (US$ Million) Forecast by Country, 2016 to 2032

Table 11: Europe Market Value (US$ Million) Forecast by Social Media Platform, 2016 to 2032

Table 12: Europe Market Value (US$ Million) Forecast by End User, 2016 to 2032

Table 13: South Asia Market Value (US$ Million) Forecast by Country, 2016 to 2032

Table 14: South Asia Market Value (US$ Million) Forecast by Social Media Platform, 2016 to 2032

Table 15: South Asia Market Value (US$ Million) Forecast by End User, 2016 to 2032

Table 16: East Asia Market Value (US$ Million) Forecast by Country, 2016 to 2032

Table 17: East Asia Market Value (US$ Million) Forecast by Social Media Platform, 2016 to 2032

Table 18: East Asia Market Value (US$ Million) Forecast by End User, 2016 to 2032

Table 19: Oceania Market Value (US$ Million) Forecast by Country, 2016 to 2032

Table 20: Oceania Market Value (US$ Million) Forecast by Social Media Platform, 2016 to 2032

Table 21: Oceania Market Value (US$ Million) Forecast by End User, 2016 to 2032

Table 22: MEA Market Value (US$ Million) Forecast by Country, 2016 to 2032

Table 23: MEA Market Value (US$ Million) Forecast by Social Media Platform, 2016 to 2032

Table 24: MEA Market Value (US$ Million) Forecast by End User, 2016 to 2032
Sudip Saha
Sudip Saha

Principal Consultant

Talk to Analyst

Find your sweet spots for generating winning opportunities in this market.

List of Charts

Figure 1: Global Market Value (US$ Million) by Social Media Platform, 2022 to 2032

Figure 2: Global Market Value (US$ Million) by End User, 2022 to 2032

Figure 3: Global Market Value (US$ Million) by Region, 2022 to 2032

Figure 4: Global Market Value (US$ Million) Analysis by Region, 2016 to 2032

Figure 5: Global Market Value Share (%) and BPS Analysis by Region, 2022 to 2032

Figure 6: Global Market Y-o-Y Growth (%) Projections by Region, 2022 to 2032

Figure 7: Global Market Value (US$ Million) Analysis by Social Media Platform, 2016 to 2032

Figure 8: Global Market Value Share (%) and BPS Analysis by Social Media Platform, 2022 to 2032

Figure 9: Global Market Y-o-Y Growth (%) Projections by Social Media Platform, 2022 to 2032

Figure 10: Global Market Value (US$ Million) Analysis by End User, 2016 to 2032

Figure 11: Global Market Value Share (%) and BPS Analysis by End User, 2022 to 2032

Figure 12: Global Market Y-o-Y Growth (%) Projections by End User, 2022 to 2032

Figure 13: Global Market Attractiveness by Social Media Platform, 2022 to 2032

Figure 14: Global Market Attractiveness by End User, 2022 to 2032

Figure 15: Global Market Attractiveness by Region, 2022 to 2032

Figure 16: North America Market Value (US$ Million) by Social Media Platform, 2022 to 2032

Figure 17: North America Market Value (US$ Million) by End User, 2022 to 2032

Figure 18: North America Market Value (US$ Million) by Country, 2022 to 2032

Figure 19: North America Market Value (US$ Million) Analysis by Country, 2016 to 2032

Figure 20: North America Market Value Share (%) and BPS Analysis by Country, 2022 to 2032

Figure 21: North America Market Y-o-Y Growth (%) Projections by Country, 2022 to 2032

Figure 22: North America Market Value (US$ Million) Analysis by Social Media Platform, 2016 to 2032

Figure 23: North America Market Value Share (%) and BPS Analysis by Social Media Platform, 2022 to 2032

Figure 24: North America Market Y-o-Y Growth (%) Projections by Social Media Platform, 2022 to 2032

Figure 25: North America Market Value (US$ Million) Analysis by End User, 2016 to 2032

Figure 26: North America Market Value Share (%) and BPS Analysis by End User, 2022 to 2032

Figure 27: North America Market Y-o-Y Growth (%) Projections by End User, 2022 to 2032

Figure 28: North America Market Attractiveness by Social Media Platform, 2022 to 2032

Figure 29: North America Market Attractiveness by End User, 2022 to 2032

Figure 30: North America Market Attractiveness by Country, 2022 to 2032

Figure 31: Latin America Market Value (US$ Million) by Social Media Platform, 2022 to 2032

Figure 32: Latin America Market Value (US$ Million) by End User, 2022 to 2032

Figure 33: Latin America Market Value (US$ Million) by Country, 2022 to 2032

Figure 34: Latin America Market Value (US$ Million) Analysis by Country, 2016 to 2032

Figure 35: Latin America Market Value Share (%) and BPS Analysis by Country, 2022 to 2032

Figure 36: Latin America Market Y-o-Y Growth (%) Projections by Country, 2022 to 2032

Figure 37: Latin America Market Value (US$ Million) Analysis by Social Media Platform, 2016 to 2032

Figure 38: Latin America Market Value Share (%) and BPS Analysis by Social Media Platform, 2022 to 2032

Figure 39: Latin America Market Y-o-Y Growth (%) Projections by Social Media Platform, 2022 to 2032

Figure 40: Latin America Market Value (US$ Million) Analysis by End User, 2016 to 2032

Figure 41: Latin America Market Value Share (%) and BPS Analysis by End User, 2022 to 2032

Figure 42: Latin America Market Y-o-Y Growth (%) Projections by End User, 2022 to 2032

Figure 43: Latin America Market Attractiveness by Social Media Platform, 2022 to 2032

Figure 44: Latin America Market Attractiveness by End User, 2022 to 2032

Figure 45: Latin America Market Attractiveness by Country, 2022 to 2032

Figure 46: Europe Market Value (US$ Million) by Social Media Platform, 2022 to 2032

Figure 47: Europe Market Value (US$ Million) by End User, 2022 to 2032

Figure 48: Europe Market Value (US$ Million) by Country, 2022 to 2032

Figure 49: Europe Market Value (US$ Million) Analysis by Country, 2016 to 2032

Figure 50: Europe Market Value Share (%) and BPS Analysis by Country, 2022 to 2032

Figure 51: Europe Market Y-o-Y Growth (%) Projections by Country, 2022 to 2032

Figure 52: Europe Market Value (US$ Million) Analysis by Social Media Platform, 2016 to 2032

Figure 53: Europe Market Value Share (%) and BPS Analysis by Social Media Platform, 2022 to 2032

Figure 54: Europe Market Y-o-Y Growth (%) Projections by Social Media Platform, 2022 to 2032

Figure 55: Europe Market Value (US$ Million) Analysis by End User, 2016 to 2032

Figure 56: Europe Market Value Share (%) and BPS Analysis by End User, 2022 to 2032

Figure 57: Europe Market Y-o-Y Growth (%) Projections by End User, 2022 to 2032

Figure 58: Europe Market Attractiveness by Social Media Platform, 2022 to 2032

Figure 59: Europe Market Attractiveness by End User, 2022 to 2032

Figure 60: Europe Market Attractiveness by Country, 2022 to 2032

Figure 61: South Asia Market Value (US$ Million) by Social Media Platform, 2022 to 2032

Figure 62: South Asia Market Value (US$ Million) by End User, 2022 to 2032

Figure 63: South Asia Market Value (US$ Million) by Country, 2022 to 2032

Figure 64: South Asia Market Value (US$ Million) Analysis by Country, 2016 to 2032

Figure 65: South Asia Market Value Share (%) and BPS Analysis by Country, 2022 to 2032

Figure 66: South Asia Market Y-o-Y Growth (%) Projections by Country, 2022 to 2032

Figure 67: South Asia Market Value (US$ Million) Analysis by Social Media Platform, 2016 to 2032

Figure 68: South Asia Market Value Share (%) and BPS Analysis by Social Media Platform, 2022 to 2032

Figure 69: South Asia Market Y-o-Y Growth (%) Projections by Social Media Platform, 2022 to 2032

Figure 70: South Asia Market Value (US$ Million) Analysis by End User, 2016 to 2032

Figure 71: South Asia Market Value Share (%) and BPS Analysis by End User, 2022 to 2032

Figure 72: South Asia Market Y-o-Y Growth (%) Projections by End User, 2022 to 2032

Figure 73: South Asia Market Attractiveness by Social Media Platform, 2022 to 2032

Figure 74: South Asia Market Attractiveness by End User, 2022 to 2032

Figure 75: South Asia Market Attractiveness by Country, 2022 to 2032

Figure 76: East Asia Market Value (US$ Million) by Social Media Platform, 2022 to 2032

Figure 77: East Asia Market Value (US$ Million) by End User, 2022 to 2032

Figure 78: East Asia Market Value (US$ Million) by Country, 2022 to 2032

Figure 79: East Asia Market Value (US$ Million) Analysis by Country, 2016 to 2032

Figure 80: East Asia Market Value Share (%) and BPS Analysis by Country, 2022 to 2032

Figure 81: East Asia Market Y-o-Y Growth (%) Projections by Country, 2022 to 2032

Figure 82: East Asia Market Value (US$ Million) Analysis by Social Media Platform, 2016 to 2032

Figure 83: East Asia Market Value Share (%) and BPS Analysis by Social Media Platform, 2022 to 2032

Figure 84: East Asia Market Y-o-Y Growth (%) Projections by Social Media Platform, 2022 to 2032

Figure 85: East Asia Market Value (US$ Million) Analysis by End User, 2016 to 2032

Figure 86: East Asia Market Value Share (%) and BPS Analysis by End User, 2022 to 2032

Figure 87: East Asia Market Y-o-Y Growth (%) Projections by End User, 2022 to 2032

Figure 88: East Asia Market Attractiveness by Social Media Platform, 2022 to 2032

Figure 89: East Asia Market Attractiveness by End User, 2022 to 2032

Figure 90: East Asia Market Attractiveness by Country, 2022 to 2032

Figure 91: Oceania Market Value (US$ Million) by Social Media Platform, 2022 to 2032

Figure 92: Oceania Market Value (US$ Million) by End User, 2022 to 2032

Figure 93: Oceania Market Value (US$ Million) by Country, 2022 to 2032

Figure 94: Oceania Market Value (US$ Million) Analysis by Country, 2016 to 2032

Figure 95: Oceania Market Value Share (%) and BPS Analysis by Country, 2022 to 2032

Figure 96: Oceania Market Y-o-Y Growth (%) Projections by Country, 2022 to 2032

Figure 97: Oceania Market Value (US$ Million) Analysis by Social Media Platform, 2016 to 2032

Figure 98: Oceania Market Value Share (%) and BPS Analysis by Social Media Platform, 2022 to 2032

Figure 99: Oceania Market Y-o-Y Growth (%) Projections by Social Media Platform, 2022 to 2032

Figure 100: Oceania Market Value (US$ Million) Analysis by End User, 2016 to 2032

Figure 101: Oceania Market Value Share (%) and BPS Analysis by End User, 2022 to 2032

Figure 102: Oceania Market Y-o-Y Growth (%) Projections by End User, 2022 to 2032

Figure 103: Oceania Market Attractiveness by Social Media Platform, 2022 to 2032

Figure 104: Oceania Market Attractiveness by End User, 2022 to 2032

Figure 105: Oceania Market Attractiveness by Country, 2022 to 2032

Figure 106: MEA Market Value (US$ Million) by Social Media Platform, 2022 to 2032

Figure 107: MEA Market Value (US$ Million) by End User, 2022 to 2032

Figure 108: MEA Market Value (US$ Million) by Country, 2022 to 2032

Figure 109: MEA Market Value (US$ Million) Analysis by Country, 2016 to 2032

Figure 110: MEA Market Value Share (%) and BPS Analysis by Country, 2022 to 2032

Figure 111: MEA Market Y-o-Y Growth (%) Projections by Country, 2022 to 2032

Figure 112: MEA Market Value (US$ Million) Analysis by Social Media Platform, 2016 to 2032

Figure 113: MEA Market Value Share (%) and BPS Analysis by Social Media Platform, 2022 to 2032

Figure 114: MEA Market Y-o-Y Growth (%) Projections by Social Media Platform, 2022 to 2032

Figure 115: MEA Market Value (US$ Million) Analysis by End User, 2016 to 2032

Figure 116: MEA Market Value Share (%) and BPS Analysis by End User, 2022 to 2032

Figure 117: MEA Market Y-o-Y Growth (%) Projections by End User, 2022 to 2032

Figure 118: MEA Market Attractiveness by Social Media Platform, 2022 to 2032

Figure 119: MEA Market Attractiveness by End User, 2022 to 2032

Figure 120: MEA Market Attractiveness by Country, 2022 to 2032

Recommendations

Technology

Digital Marketing Software Market

Published : August 2023

Technology

Social Media Content Creation Market

Published : October 2022

Technology

Digital Marketing Analytics Market

Published : June 2022

Technology

Social Media Engagement Applications Market

Published : March 2018

Explore Technology Insights

View Reports