The industry valuation is expected to grow steadily, with an estimated value of USD 284.1 million in 2025, which is likely to reach around USD 398.8 million by 2035, with a CAGR of about 3.5%. This growth is driven by growing healthcare demands and increased pharmaceutical applications.One of the most important drivers of growth is the increasing global incidence of kidney disease.
Sodium bicarbonate is vital in dialysis procedures, where it is used to neutralize blood acidity among patients with compromised kidney function. With rising rates of chronic kidney disease (CKD) globally, demand for dialysis-quality bicarbonate is on the upsurge.
Another growth driver is its extensive application in antacid drugs, wherein sodium bicarbonate neutralizes gastric acid and delivers quick relief against indigestion, heartburn, and acid reflux. Over-the-counter gastrointestinal preparations with sodium bicarbonate continue to be among the most reliable medicines in developed and developing countries.
The substance is also a critical excipient in injectable drug presentations, for instance, certain antibiotics and chemotherapy medications. It promotes perfect pH control, stability, and solubility of active compounds. As parenteral drug development continues to rise globally, the use of pharmaceutical-grade sodium bicarbonate in such expert drug delivery systems is still on the rise.
While having varied applications, the industry faces several challenges. The manufacture of the substance involves strict purification and quality control, increasing manufacturing costs and complexity. Regulatory compliance following pharmacopeia standards (i.e., USP, EP, or JP) also varies across geographies, which makes it challenging for some players to enter the industry.
Geographically, Europe and North America lead with established healthcare systems, large dialysis patient bases, and robust pharmaceutical manufacturing bases. Nevertheless, Asia-Pacific is expected to grow the fastest with growing healthcare investments and increasing pharmaceutical export capabilities.
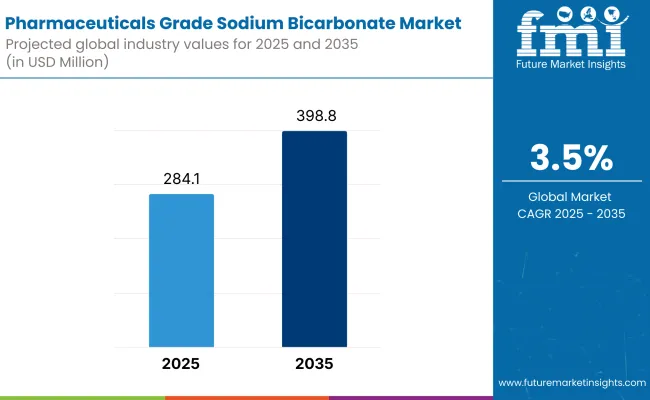
Market Metrics - Pharmaceutical Grade Sodium Bicarbonate Market
| Market Metrics | Value |
|---|---|
| Industry Size (2025E) | USD 284.1 million |
| Industry Value (2035F) | USD 398.8 million |
| CAGR (2025 to 2035) | 3.5% |
The industry holds an essential role in contemporary health care owing to its extensive utility in the formulations of drugs, intravenous and dialysis fluids, and the manufacture of antacids. Due to stricter requirements in pharmaceutical excipients across the globe, demands for ultra-pure sodium bicarbonate are accelerating at an incessant rate.
Pharmaceutical Firms appreciate economical and uniform sodium bicarbonate solutions that ensure optimal performance in applications that range from an active pharmaceutical ingredient (API) and excipient to therapies like hemodialysis. They desire materials that are very effective, environmentally compliant, and adjustable to unique operating specifications.Distributors want a stable supply chain to be able to provide pharmaceutical companies' needs. Distributors are worried about offering a wide variety of products to different applications, timely delivery, and competitive pricing.
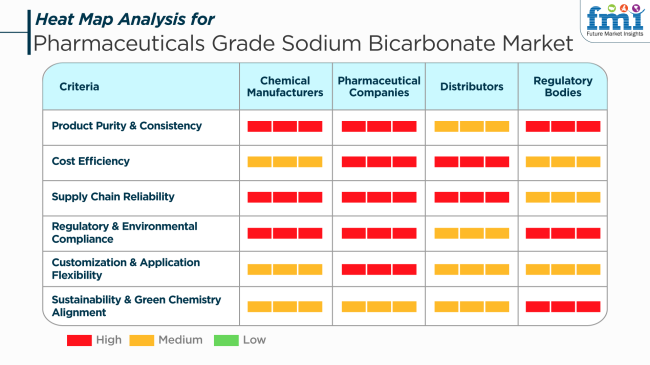
During the period from 2020 to 2024, the industrywitnessed continuous growth, benefiting from its critical application in various drugs. With the prevalence of chronic diseases such as kidney disorders and metabolic acidosis on the rise, there was greater demand for sodium bicarbonate in medicines such as hemodialysis.
Also, its wide use as an active pharmaceutical ingredient (API) in effervescent and antacid products further fueled the demand. However, factors such as strict regulatory requirements, environmental issues, and fluctuation in raw material prices were restraining factors for growth in this period.
In the next years, 2025 to 2035, the industry will significantly change based on technology growth, population trends, and changing industrial needs. More demand for greener and more sustainable operations will help drive demand for green solvents and promote innovation in formulating and manufacturing processes for solvents.
Also, increased utilization of biologics and personalized medicines will subsequently generate new solvent opportunities for the pharmaceutical industry because such drugs normally require special solvents in the formulation and administration. Increased pharma infrastructure across emerging industries is also expected to fuel sales expansion with greater availability to a large patient base and, thereby, demand for pharmaceutical products.
Comparative Market Shift Analysis 2020 to 2024 vs. 2025 to 2035
| 2020 to 2024 | 2025 to 2035 |
|---|---|
| Consistent growth spurred by rising demand for pharmaceutical products. | Sustained growth is driven by the expansion of drug delivery systems and targeted medicine. |
| Growing incidence of chronic diseases, expanding healthcare infrastructure and expanding pharmaceutical manufacturing. | Transition to sustainable practices, biologic adoption, and expanding healthcare access in emerging markets. |
| Growing emphasis on maximizing solvent efficiency and reducing environmental impact. | Green solvent development, formulation innovations, and drug delivery biologics innovation. |
| Emergence and growth of healthcare infrastructure in developing markets. | Accelerated expansion of developing economies with greater accessibility to pharmaceuticals and healthcare. |
| Increasing implementation of severe control on the consumption of solvents and their environmental influence. | Increased emphasis on green chemistry and sustainability during the manufacture and usage of solvents. |
| Higher-performance solvent introductions with lesser toxicity. | Development of premium solvents designed to target biologics and customized medicine applications. |
In 2024, compliance with pharmacopoeial standards, i.e., impurity levels or pH value, was a matter of regulatory and legal concern. Deviation from the standards could result in batch recall, late approval, and loss of reputation among pharmaceutical and healthcare customers.
Raw material price volatility continues to be a top risk factor. Pharmaceutical-quality sodium bicarbonate demands high-purity sodium carbonate or sodium hydroxide, and any supply chain volatility-especially in import-reliant regions-can lead to price volatility. There is an impact on margins for both drug manufacturers and downstream drug manufacturers.
Transportation bottlenecks, lack of labor, or geopolitical tension in supply chains can disrupt supply and delay timely delivery. In 2024, logistic complications in exporting premium-grade pharmaceutical excipients to growth markets resulted in drug manufacturing cycle delays, particularly in the critical care sector, such as in dialysis applications.
Few massive-scale producers account for most global supply, leaving it exposed if one plant is out of commission. Compliance audits or maintenance shutdowns briefly constrict supply, sending ripple effects through hospital and pharmaceutical networks.
In conclusion, the industry is challenged by devastating threats of regulatory compliance, supply stability, cost volatility, concentration of production, and quality control. Strategic buying, advanced document systems, and convergence of world regulations are essential to avoid these challenges and stay competitive.
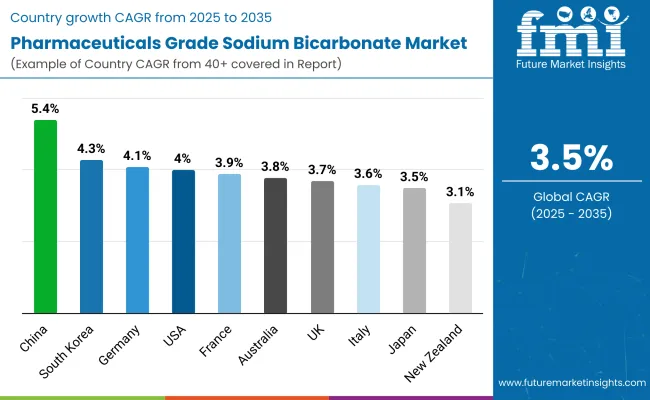
| Countries | CAGR (%) |
|---|---|
| USA | 4.0% |
| UK | 3.7% |
| France | 3.9% |
| Germany | 4.1% |
| Italy | 3.6% |
| South Korea | 4.3% |
| Japan | 3.5% |
| China | 5.4% |
| Australia | 3.8% |
| New Zealand | 3.1% |
The USA is expected to grow at a CAGR of 4.0% during 2025 to 2035. Growth is driven by increasing demand for antacids, dialysis therapy, and injectables. The compound is widely used as a buffer and pH stabilizer in numerous pharmaceutical formulations.
Large chemical manufacturers are developing high-purity production lines to meet stringent FDA and USP regulatory requirements. Improvements in filtration and crystallization technology are enhancing product purity and reproducibility. Population aging and chronic disease growth rates are driving sustained demand in pharma applications.
The UK is expected to record a CAGR of 3.7% from 2025 to 2035. Growth in the industry is fueled by growing demand for intravenous solutions, oral tablets, and effervescent dosage forms. Regulatory focus and procurement by hospitals form key drivers of growth.
Manufacturers are increasing production capability with GMP compliance and focusing on purity. Focusing on sustainable packaging and clean-label excipients transforms the products. Supply partnerships with pharmaceutical firms and healthcare organizations are helping with the stability of demand and quality control.
France is anticipated to expand with a CAGR of 3.9% through the forecast period. The market is backed by a resilient pharmaceutical sector and increasing demand for renal care medication. Tablet formulation and use of powder-based solutions continue to rise steadily.
French producers are focusing on producing ultra-pure sodium bicarbonate with controlled particle size for optimal performance in oral and injectable pharmaceuticals. Conformity to European Pharmacopeia standards for regulation guarantees the product's acceptability for export as well as domestic use. Growing use in emergency medicine and critical care formulations is also stimulating growth.
Germany will grow at a CAGR of 4.1% over the period from 2035. There is production-supported demand, specifically in injectable and dialysis applications. Regulatory compliance and quality control are significant drivers of process optimization and innovation.
Manufacturers are making investments in purification technologies that yield minimal residual contamination and enhanced solubility profiles. The application of sodium bicarbonate in formulation processes for antacids, effervescent tablets, and electrolyte rebalance agents is increasing. The application of environmentally friendly production and disposal methods is also becoming important for manufacturers.
Italy is anticipated to grow at a CAGR of 3.6% during the forecast period. Increasing applications in gastrointestinal drugs, hemodialysis treatments, and pediatrics formulations drive market dynamics. Domestic pharma industry demand for quality pharmaceutical excipients fuels continued market growth.
Italian chemical producers are concentrating on particle homogeneity and higher solubility in bicarbonate products. Compliance with EMA and pharmacopoeial standards assures uniformity in the final drug product. Diversification of products in the event of powder sachets and suspension bases is being researched to meet consumer requirements for convenience and effectiveness.
South Korea is forecast to register a CAGR of 4.3% during the forecast period 2025 to 2035. Industry growth is propelled by growing pharmaceutical manufacturing capacity and rising usage in dialysis units and hospital emergency departments. Demand is also increasing for applications in combination therapy and oral drug delivery.
Producers are seeking to achieve ultra-low heavy metal content and stringent quality inspection. Encouraging government policies towards pharmaceutical innovation and investment in manufacturing facilities are increasing supply reliability. Export strategies also position South Korea as a competitive, high-quality bicarbonate supplier to local regions.
Japan is expected to grow at a CAGR of 3.5% over the period 2025 to 2035. Demand is strongly localized in injectable drugs, dialysis therapy, and pediatric treatment applications. The aging population and focus on non-surgical treatments in the nation contribute to stable consumption patterns.
Japanese chemical corporations are emphasizing pharmaceutical-grade formulation processes and stringent quality control systems. Packing standards, sterility standards, and excellence standards of compatibility formulation are formulating competitive distinction. Oral electrolyte balance and rehydration therapy application areas are also becoming consistent demand segments.
China is expected to dominate the industry with a CAGR of 5.4% over the forecast period. Industrialization of the pharmaceutical industry and increased chronic disease prevalence are key drivers for growth. The substance finds extensive application in antacids, dialysis solutions, and injectable medication.
Chinese manufacturers are expanding capacity and refurbishing production lines to international GMP and pharmacopeial levels. The shift towards export-quality materials is stimulating investment in high-purity bicarbonate and improved quality control. Healthcare reforms in China, as well as increased access to medical therapy, are also fueling demand.
Australia is expected to post growth at a CAGR of 3.8% over 2025 to 2035. Use in emergency medicine, dialysis units, and over-the-counter medicines sustains the market. Focus on healthcare compliance and safety is fueling demand for pharmaceutical-grade inputs.
Australian suppliers are introducing more advanced technology purification methods and regulatory alignment with global standards. Import dependence is balanced by in-country quality assurance and certification. Effervescent drug delivery products and oral antacid blends are set to sustain strong demand, supporting market resilience.
New Zealand is expected to grow at a CAGR of 3.1% during the forecast period. The demand confluences around use in hospital grade, clinical laboratories, and retail-based antacid lines. The industry remains small in size but consistent in consumption patterns.
Distribution is primarily local, with compliance and product quality given attention. Suppliers are going out of their way to achieve stringent pharmacopoeial standards and ensure product safety. Clean-label excipients and streamlined formulation processes are picking up pace.
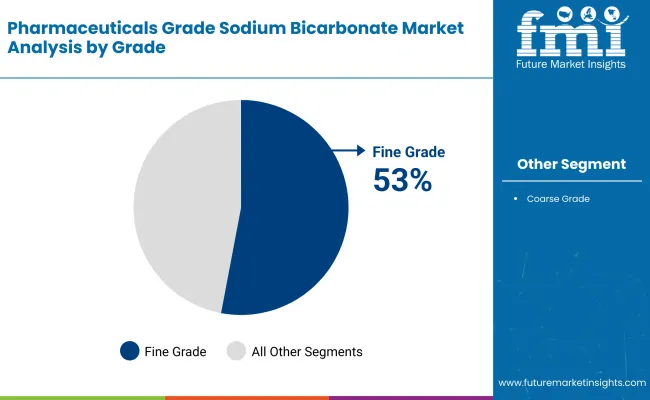
In 2025, the segment Fine Grade is likely to dominate the industry, with a revenue share of 53%, followed by Coarse Grade, to hold a share of 47%.
The fine-grade segment is led by high purity and fine particle size, which are vital for pharmaceutical applications. Fine-grade sodium bicarbonate is widely used in the manufacturing of effervescent tablets and antacid formulations and as a buffering agent in diverse pharmaceutical products. The demand for fine-grade sodium bicarbonate is also driven eastward by the demand for global healthcare solutions, especially for digestive health treatments.
For example, major pharmaceutical companies such as Pfizer, GlaxoSmithKline, and Johnson & Johnson use fine-grade sodium bicarbonate in their formulations to ensure consistent quality and therapeutic efficacy. The growing population suffering from acid reflux, heartburn, and gastrointestinal troubles furthers the demand for fine-grade sodium bicarbonate in OTC medicines and prescription formulations. The effervescent forms of drugs have gained increasing popularity in recent times, which in turn has given an additional impetus to the demand for fine-grade sodium bicarbonate.
Thecoarse grade category occupies a considerable revenueshare of 47%. Coarse sodium bicarbonate has common applications in industrial usage, such as food processing, water treatment, and cleaning. Though it is considered a lesser application in pharmaceuticals, it is a much-wanted material in the larger-scale production process.
Solvay, Tata Chemicals, and Hindustan Zinc manufacture coarse sodium bicarbonate for these industries. The increased demand for eco-friendly solutions for water treatment and their use as food additives further elevates the demand for coarse-grade sodium bicarbonate.
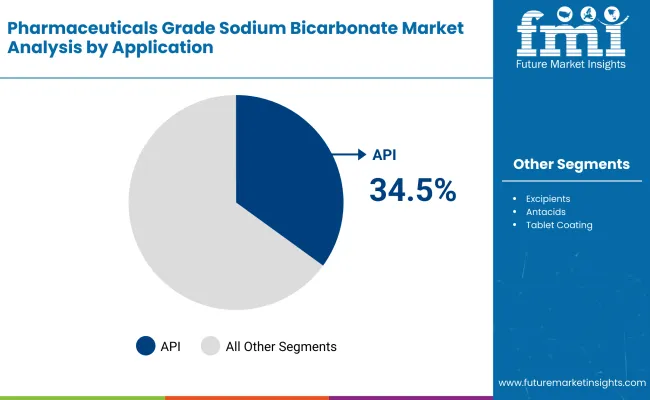
The API (Active Pharmaceutical Ingredients) segment is envisaged to hold the largest chunk of revenue in 2025, accounting for nearly 34.5%, followed by the Excipients segment with a share of 21.8%.
The essential role of sodium benzoate in the manufacture and stabilization of an active pharmaceutical ingredient is the reason for the API dominance. Sodium bicarbonate is used as a buffering agent, pH regulator, and stabilizer during the production of APIs. The increasing requirement for complex and biologically active compounds used in the treatment of various chronic diseases and cancer propels that segment of the industry.
While Novartis, Bayer, and Merck are important pharma names in the segment, what most people's knowledge or perception may not include is that sodium bicarbonate plays a significant role in API production. On top of that is the current trend of developing more advanced and novel biologics and biosimilars, which pushes the concerns towards more reliable and effective excipients, such as sodium bicarbonate used in the manufacture of APIs.
The excipients segment holds a share of 21.8%. Excipients are inactive substances that are used to carry the active ingredients in a formulation. Sodium bicarbonate is widely used in effervescent tablets, antacids, and oral dosage forms. Increasingly common oral solid dosage forms, especially effervescent formulations, have created a boom in the industry.
Major excipient suppliers are BASF, Dow Chemical, and Evonik, which are in the pharmaceutical industry, with sodium bicarbonate being one of the preferred choices due to its safety profile and effects. Further, the demand for over-the-counter antacid products is fueling the growth of this segment.
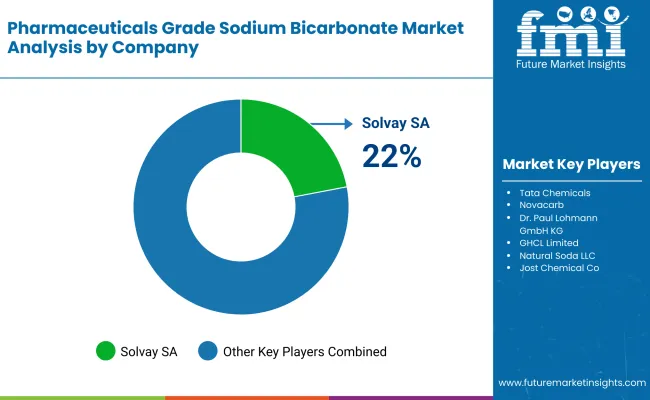
The industry is highly competitive, and companies focus on high-purity formulations, regulatory compliance, and sustainable manufacturing practices. The pharmaceutical companies dominating the industry include Solvay SA, Tata Chemicals, and Novacarb (Novacap Group).
The competitive environment favors these players because of their advanced production capabilities and expansive global distribution networks that are compliant with Good Manufacturing Practices (GMP). Such players concentrate on low-contaminant and high-solubility sodium bicarbonate formulations with very critical pharmaceutical applications such as antacids, dialysis treatments and effervescent tablets.
Dr. Paul Lohmann GmbH KG and GHCL Limited add to the expanding portfolios of specialty sodium bicarbonate products targeting fine particle size and more highly purified grades for injectable and high-definition medical applications. These companies are working with pharmaceutical contract manufacturers (CMOs) and research institutions to ensure active pharmaceutical ingredient (API) compatibility.
CIECH S.A. and Natural Soda LLC have remained solid by focusing on cost-effective, high-quality solutions of sodium bicarbonate for pharmaceutical excipients and food-grade medicinal applications. Their capability for bulk supply contracts and sustainable mining operations enables them to maintain an absolutely competitive positioning.
Increased investments have also been going towards funding eco-friendly production technologies, such as in the case of Jost Chemical Co. and Tornox Alkali Corporation, which would certainly seek to reduce carbon emissions while optimizing resource use.
Market Share Analysis by Company
| Company Name | Market Share (%) |
|---|---|
| Solvay SA | 22-27% |
| Tata Chemicals | 18-22% |
| Novacarb (Novacap Group) | 12-16% |
| Dr. Paul Lohmann GmbH KG | 8-12% |
| GHCL Limited | 5-9% |
| Others (combined) | 30-40% |
| Company Name | Key Offerings and Activities |
|---|---|
| Solvay SA | Produces high-purity sodium bicarbonate for pharmaceutical formulations, dialysis treatments, and antacids, with a focus on sustainability. |
| Tata Chemicals | Supplies pharma-grade sodium bicarbonate with low impurity levels for API compatibility and effervescent formulations. |
| Novacarb (Novacap Group) | Specializes in ultra-pure sodium bicarbonate for injectable and hemodialysis applications. |
| Dr. Paul Lohmann GmbH KG | Develops specialty sodium bicarbonate solutions with fine particle control and advanced purity levels. |
| GHCL Limited | Focuses on cost-effective pharmaceutical excipients and bulk supply for global pharma manufacturers. |
Key Company Insights
Solvay SA (22-27%)
Solvay leads with advanced purification technology and sustainable sodium bicarbonate production for pharmaceutical applications.
Tata Chemicals (18-22%)
Tata Chemicals enhances its presence through high-purity API-compliant sodium bicarbonate formulations that serve both the pharmaceutical and healthcare industries.
Novacarb (Novacap Group) (12-16%)
Novacarb strengthens its industry position by offering injectable-grade sodium bicarbonate with GMP-certified manufacturing facilities.
Dr. Paul Lohmann GmbH KG (8-12%)
Dr. Paul Lohmann focuses on customized excipients and high-precision sodium bicarbonate formulations for critical medical applications.
GHCL Limited (5-9%)
GHCL competes by providing cost-efficient, bulk pharmaceutical-grade sodium bicarbonate to international drug manufacturers.
Other Key Players
The segmentation isinto fine and coarse.
The segmentation is into API, excipients, antacids, hemodialysis, tablet coating, toothpaste, and others.
The report covers North America, Latin America, Eastern Europe, Western Europe, Southeast East Asia and Pacific, China, India, Japan, and the Middle East and Africa.
The market is expected to reach USD 284.1 million by 2025.
Sales are projected to grow to USD 398.8 million by 2035, supported by its growing role in pharmaceutical formulations and renal care treatments.
China is expected to grow at a notable CAGR, reflecting rising pharmaceutical manufacturing and increasing demand for high-purity sodium bicarbonate.
The fine-grade segment leads the industry, given its essential use in pharmaceutical applications requiring high chemical purity.
Key players include Solvay SA, Tata Chemicals, Novacarb (Novacap Group), Dr. Paul Lohmann GmbH KG, GHCL Limited, CIECH S.A., Natural Soda LLC, Jost Chemical Co., and Tornox Alkali Corporation.
Table 01: Global Market Value (US$ Million) and Volume (Tons) by Grade, 2018 to 2033
Table 02: Global Market Value (US$ Million) and Volume (Tons) by Application, 2018 to 2033
Table 03: Global Market Value (US$ Million) and Volume (Tons) by Region, 2018 to 2033
Table 04: North America Market Value (US$ Million) and Volume (Tons) by Country, 2018 to 2033
Table 05: North America Market Value (US$ Million) and Volume (Tons) by Grade, 2018 to 2033
Table 06: North America Market Value (US$ Million) and Volume (Tons) by Application, 2018 to 2033
Table 07: Latin America Market Value (US$ Million) and Volume (Tons) by Country, 2018 to 2033
Table 08: Latin America Market Value (US$ Million) and Volume (Tons) by Grade, 2018 to 2033
Table 09: Latin America Market Value (US$ Million) and Volume (Tons) by Application, 2018 to 2033
Table 10: Western Europe Market Value (US$ Million) and Volume (Tons) by Country, 2018 to 2033
Table 11: Western Europe Market Value (US$ Million) and Volume (Tons) by Grade, 2018 to 2033
Table 12: Western Europe Market Value (US$ Million) and Volume (Tons) by Application, 2018 to 2033
Table 13: Eastern Europe Market Value (US$ Million) and Volume (Tons) by Country, 2018 to 2033
Table 14: Eastern Europe Market Value (US$ Million) and Volume (Tons) by Grade, 2018 to 2033
Table 15: Eastern Europe Market Value (US$ Million) and Volume (Tons) by Application, 2018 to 2033
Table 16: South East Asia and Pacific Market Value (US$ Million) and Volume (Tons) by Country, 2018 to 2033
Table 17: South East Asia and Pacific Market Value (US$ Million) and Volume (Tons) by Grade, 2018 to 2033
Table 18: South East Asia and Pacific Market Value (US$ Million) and Volume (Tons) by Application, 2018 to 2033
Table 19: India Market Value (US$ Million) and Volume (Tons) by Grade, 2018 to 2033
Table 20: India Market Value (US$ Million) and Volume (Tons) by Application, 2018 to 2033
Table 21: Japan Market Value (US$ Million) and Volume (Tons) by Grade, 2018 to 2033
Table 22: Japan Market Value (US$ Million) and Volume (Tons) by Application, 2018 to 2033
Table 23: China Market Value (US$ Million) and Volume (Tons) by Grade, 2018 to 2033
Table 24: China Market Value (US$ Million) and Volume (Tons) by Application, 2018 to 2033
Table 25: Middle East and Africa Market Value (US$ Million) and Volume (Tons) by Country, 2018 to 2033
Table 26: Middle East and Africa Market Value (US$ Million) and Volume (Tons) by Grade, 2018 to 2033
Table 27: Middle East and Africa Market Value (US$ Million) and Volume (Tons) by Application, 2018 to 2033
Figure 01: Global Historical Market Size (US$ Million) and Volume (Tons) Analysis, 2018 to 2022
Figure 02: Global Current and Future Market Size (US$ Million) and Volume (Tons) Analysis, 2023 to 2033
Figure 03: Global Market Historical Value (US$ Million), 2018 to 2022
Figure 04: Global Market Value (US$ Million) and Y-o-Y Growth Forecast, 2018 to 2033
Figure 05: Global Market Absolute $ Opportunity, 2018 to 2033
Figure 06: Global Market Share and BPS Analysis by Grade– 2023 and 2033
Figure 07: Global Market Y-o-Y (%) Growth Projections by Type, 2018 to 2033
Figure 08: Global Market Absolute $ Opportunity (US$ Million), 2018 to 2033, by Grade
Figure 09: Global Market Attractiveness Analysis by Grade, 2023 to 2033
Figure 10: Global Market Share and BPS Analysis by Application– 2023 and 2033
Figure 11: Global Market Y-o-Y (%) Growth Projections by Application, 2018 to 2033
Figure 12: Global Market Absolute $ Opportunity (US$ Million), 2018 to 2033, by Application
Figure 13: Global Market Attractiveness Analysis by Application, 2023 to 2033
Figure 14: Global Market Share and BPS Analysis by Region – 2023 and 2033
Figure 15: Global Market Y-o-Y (%) Growth Projections by Region, 2018 to 2033
Figure 16: Global Market Absolute $ Opportunity (US$ Million), 2018 to 2033 by Region
Figure 17: Global Market Attractiveness Analysis by Region, 2018 to 2033
Figure 18: North America Market Share and BPS Analysis by Country – 2023 and 2033
Figure 19: North America Market Y-o-Y (%) Growth Projections by Country, 2018 to 2033
Figure 20: North America Market Absolute $ Opportunity (US$ Million), 2018 to 2033 by Country
Figure 21: North America Market Share and BPS Analysis by Grade – 2023 and 2033
Figure 22: North America Market Y-o-Y (%) Growth Projections by Grade, 2018 to 2033
Figure 23: North America Market Share and BPS Analysis by Application – 2023 and 2033
Figure 24: North America Market Y-o-Y (%) Growth Projections by Application, 2018 to 2033
Figure 25: North America Market Attractiveness Analysis by Grade, 2018 to 2033
Figure 26: North America Market Attractiveness Analysis by Application, 2018 to 2033
Figure 27: North America Market Attractiveness Analysis by Country, 2018 to 2033
Figure 28: Latin America Market Share and BPS Analysis by Country – 2023 and 2033
Figure 29: Latin America Market Y-o-Y (%) Growth Projections by Country, 2018 to 2033
Figure 30: Latin America Market Absolute $ Opportunity (US$ Million), 2018 to 2033 by Country
Figure 31: Latin America Market Share and BPS Analysis by Grade – 2023 and 2033
Figure 32: Latin America Market Y-o-Y (%) Growth Projections by Grade, 2018 to 2033
Figure 33: Latin America Market Share and BPS Analysis by Application – 2023 and 2033
Figure 34: Latin America Market Y-o-Y (%) Growth Projections by Application, 2018 to 2033
Figure 35: Latin America Market Attractiveness Analysis by Grade, 2018 to 2033
Figure 36: Latin America Market Attractiveness Analysis by Application, 2018 to 2033
Figure 37: Latin America Market Attractiveness Analysis by Country, 2018 to 2033
Figure 38: Western Europe Market Share and BPS Analysis by Country – 2023 and 2033
Figure 39: Western Europe Market Y-o-Y (%) Growth Projections by Country, 2018 to 2033
Figure 40: Western Europe Market Absolute $ Opportunity (US$ Million), 2018 to 2033 by Country
Figure 41: Western Europe Market Share and BPS Analysis by Grade – 2023 and 2033
Figure 42: Western Europe Market Y-o-Y (%) Growth Projections by Grade, 2018 to 2033
Figure 43: Western Europe Market Share and BPS Analysis by Application – 2023 and 2033
Figure 44: Western Europe Market Y-o-Y (%) Growth Projections by Application, 2018 to 2033
Figure 45: Western Europe Market Absolute $ Opportunity (US$ Million), 2018 to 2033 by Application
Figure 46: Western Europe Market Attractiveness Analysis by Country, 2018 to 2033
Figure 47: Western Europe Market Attractiveness Analysis by Application, 2018 to 2033
Figure 48: Western Europe Market Attractiveness Analysis by Grade, 2018 to 2033
Figure 49: Eastern Europe Market Share and BPS Analysis by Country – 2023 and 2033
Figure 50: Eastern Europe Market Y-o-Y (%) Growth Projections by Country, 2018 to 2033
Figure 51: Eastern Europe Market Absolute $ Opportunity (US$ Million), 2018 to 2033 by Country
Figure 52: Eastern Europe Market Share and BPS Analysis by Grade – 2023 and 2033
Figure 53: Eastern Europe Market Y-o-Y (%) Growth Projections by Grade, 2018 to 2033
Figure 54: Eastern Europe Market Share and BPS Analysis by Application – 2023 and 2033
Figure 55: Eastern Europe Market Y-o-Y (%) Growth Projections by Application, 2018 to 2033
Figure 56: Eastern Europe Market Attractiveness Analysis by Grade, 2018 to 2033
Figure 57: Eastern Europe Market Attractiveness Analysis by Application, 2018 to 2033
Figure 58: Eastern Europe Market Attractiveness Analysis by Country, 2018 to 2033
Figure 59: South East Asia and Pacific Market Share and BPS Analysis by Country – 2023 and 2033
Figure 60: South East Asia and Pacific Market Y-o-Y (%) Growth Projections by Country, 2018 to 2033
Figure 61: South East Asia and Pacific Market Absolute $ Opportunity (US$ Million), 2018 to 2033 by Country
Figure 62: South East Asia and Pacific Market Share and BPS Analysis by Grade – 2023 and 2033
Figure 63: South East Asia and Pacific Market Y-o-Y (%) Growth Projections by Grade, 2018 to 2033
Figure 64: South East Asia and Pacific Market Share and BPS Analysis by Application – 2023 and 2033
Figure 65: South East Asia and Pacific Market Y-o-Y (%) Growth Projections by Application, 2018 to 2033
Figure 66: South East Asia and Pacific Market Attractiveness Analysis by Grade, 2018 to 2033
Figure 67: South East Asia and Pacific Market Attractiveness Analysis by Application, 2018 to 2033
Figure 68: South East Asia and Pacific Market Attractiveness Analysis by Country, 2018 to 2033
Figure 69: India Market Share and BPS Analysis by Grade – 2023 and 2033
Figure 70: India Market Y-o-Y (%) Growth Projections by Grade, 2018 to 2033
Figure 71: India Market Share and BPS Analysis by Application – 2023 and 2033
Figure 72: India Market Y-o-Y (%) Growth Projections by Application, 2018 to 2033
Figure 73: India Market Attractiveness Analysis by Grade, 2018 to 2033
Figure 74: India Market Attractiveness Analysis by Application, 2018 to 2033
Figure 75: Japan Market Share and BPS Analysis by Grade – 2023 and 2033
Figure 76: Japan Market Y-o-Y (%) Growth Projections by Grade, 2018 to 2033
Figure 77: Japan Market Share and BPS Analysis by Application – 2023 and 2033
Figure 78: Japan Market Y-o-Y (%) Growth Projections by Application, 2018 to 2033
Figure 79: Japan Market Attractiveness Analysis by Grade, 2018 to 2033
Figure 80: Japan Market Attractiveness Analysis by Application, 2018 to 2033
Figure 81: China Market Share and BPS Analysis by Grade – 2023 and 2033
Figure 82: China Market Y-o-Y (%) Growth Projections by Grade, 2018 to 2033
Figure 83: China Market Share and BPS Analysis by Application – 2023 and 2033
Figure 84: China Market Y-o-Y (%) Growth Projections by Application, 2018 to 2033
Figure 85: China Market Attractiveness Analysis by Grade, 2018 to 2033
Figure 86: China Market Attractiveness Analysis by Application, 2018 to 2033
Figure 87: Middle East and Africa Market Share and BPS Analysis by Country – 2023 and 2033
Figure 88: Middle East and Africa Market Y-o-Y (%) Growth Projections by Country, 2018 to 2033
Figure 89: Middle East and Africa Market Absolute $ Opportunity (US$ Million), 2018 to 2033 by Country
Figure 90: Middle East and Africa Market Share and BPS Analysis by Grade – 2023 and 2033
Figure 91: Middle East and Africa Market Y-o-Y (%) Growth Projections by Grade, 2018 to 2033
Figure 92: Middle East and Africa Market Share and BPS Analysis by Application –2023 and 2033
Figure 93: Middle East and Africa Market Y-o-Y (%) Growth Projections by Application, 2018 to 2033
Figure 94: Middle East and Africa Market Attractiveness Analysis by Grade, 2018 to 2033
Figure 95: Middle East and Africa Market Attractiveness Analysis by Application, 2018 to 2033
Figure 96: Middle East and Africa Market Attractiveness Analysis by Country, 2018 to 2033


Our Research Products

The "Full Research Suite" delivers actionable market intel, deep dives on markets or technologies, so clients act faster, cut risk, and unlock growth.

The Leaderboard benchmarks and ranks top vendors, classifying them as Established Leaders, Leading Challengers, or Disruptors & Challengers.

Locates where complements amplify value and substitutes erode it, forecasting net impact by horizon

We deliver granular, decision-grade intel: market sizing, 5-year forecasts, pricing, adoption, usage, revenue, and operational KPIs—plus competitor tracking, regulation, and value chains—across 60 countries broadly.

Spot the shifts before they hit your P&L. We track inflection points, adoption curves, pricing moves, and ecosystem plays to show where demand is heading, why it is changing, and what to do next across high-growth markets and disruptive tech

Real-time reads of user behavior. We track shifting priorities, perceptions of today’s and next-gen services, and provider experience, then pace how fast tech moves from trial to adoption, blending buyer, consumer, and channel inputs with social signals (#WhySwitch, #UX).

Partner with our analyst team to build a custom report designed around your business priorities. From analysing market trends to assessing competitors or crafting bespoke datasets, we tailor insights to your needs.
Supplier Intelligence
Discovery & Profiling
Capacity & Footprint
Performance & Risk
Compliance & Governance
Commercial Readiness
Who Supplies Whom
Scorecards & Shortlists
Playbooks & Docs
Category Intelligence
Definition & Scope
Demand & Use Cases
Cost Drivers
Market Structure
Supply Chain Map
Trade & Policy
Operating Norms
Deliverables
Buyer Intelligence
Account Basics
Spend & Scope
Procurement Model
Vendor Requirements
Terms & Policies
Entry Strategy
Pain Points & Triggers
Outputs
Pricing Analysis
Benchmarks
Trends
Should-Cost
Indexation
Landed Cost
Commercial Terms
Deliverables
Brand Analysis
Positioning & Value Prop
Share & Presence
Customer Evidence
Go-to-Market
Digital & Reputation
Compliance & Trust
KPIs & Gaps
Outputs
Full Research Suite comprises of:
Market outlook & trends analysis
Interviews & case studies
Strategic recommendations
Vendor profiles & capabilities analysis
5-year forecasts
8 regions and 60+ country-level data splits
Market segment data splits
12 months of continuous data updates
DELIVERED AS:
PDF EXCEL ONLINE
Pharma Grade Sodium Bicarbonate Market 2024-2034
Sodium Bicarbonate Market Report - Demand, Growth & Industry Outlook 2025 to 2035
Food Grade Sodium Hypochlorite Market Growth -Industry Trends 2025 to 2035
Food Grade Sodium Hydroxide Market
Food Grade Sodium Citrate Market
Food Grade Sodium Carbonate Market
Food Grade Ammonium Bicarbonate Market
Industrial Grade Sodium Bifluoride Market Forecast and Outlook 2025 to 2035
Encapsulated Sodium Bicarbonate Market Trends - Growth & Industry Forecast 2025 to 2035
Pharmaceutical Grade Sodium Carbonate Market Forecast and Outlook 2025 to 2035
Pharmaceutical Grade Sodium Chloride Market Size and Share Forecast Outlook 2025 to 2035
Sodium 3-Nitrobenzenesulfonate Market Size and Share Forecast Outlook 2025 to 2035
Sodium Difluorophosphate (NaDFP) Market Size and Share Forecast Outlook 2025 to 2035
Sodium Bisulfite Market Size and Share Forecast Outlook 2025 to 2035
Sodium Formate Market Size and Share Forecast Outlook 2025 to 2035
Sodium Borohydride Market Size and Share Forecast Outlook 2025 to 2035
Sodium Chloride Market Size and Share Forecast Outlook 2025 to 2035
Pharmaceuticals Pouch Market Size and Share Forecast Outlook 2025 to 2035
Sodium Lactate Market Size and Share Forecast Outlook 2025 to 2035
Sodium Caprylate Market Size and Share Forecast Outlook 2025 to 2035

Thank you!
You will receive an email from our Business Development Manager. Please be sure to check your SPAM/JUNK folder too.
Chat With
MaRIA