Food Grade Gas Market Size and Share Forecast Outlook 2025 to 2035

The global food grade gas market is projected to grow from USD 7.7 billion in 2025 to USD 15.1 billion by 2035, registering a CAGR of 7%. The market expansion is driven by the rising demand for safe, preservative-free food products and continued innovation in packaging technologies such as modified atmosphere packaging and cryogenic freezing.
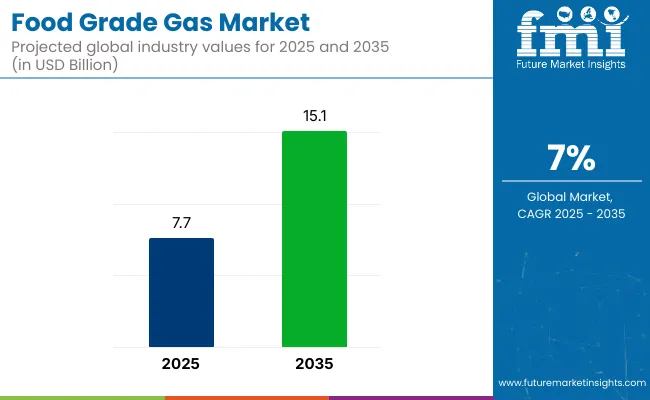
Quick Stats for Food Grade Gas Market

  • Market Value (2025): USD 7.7 billion
  • Forecast Value (2035): USD 15.1 billion
  • Forecast CAGR: 7%
  • Leading Product Type in 2025: Nitrogen (34% market share)
  • Top End-use Segment:Meat (32% share)
  • Key Growth Region:East Asia (Japan is the fastest-growing market with 6.8% CAGR)

Food Grade Gas Market

Metric Value
Market Value (2025) USD 7.7 billion
Forecast Value (2035) USD 15.1 billion
Forecast CAGR 7%

Adoption of food grade gases is increasing for applications including carbonation, chilling, preservation, and packaging across beverage, dairy, meat, bakery, and convenience food sectors, as the global food supply chain prioritizes hygiene and shelf life extension.

The market holds an approximately 21% of the food-grade packaging gas segment, highlighting its central role in ensuring freshness and product stability. The food grade gas category contributes around 1.5%. It also makes up close to 4% of the cryogenic gas equipment sector, mainly due to high usage of nitrogen and carbon dioxide in cold chain logistics. However, in the overall global industrial gas industry, its share remains limited at under 0.3%.

Government regulations impacting the market focus on ensuring safety, purity, and compliance with food processing standards.International standards, such as the US FDA CFR Title 21, the EU Regulation EC No 1333-2008, and the Codex Alimentarius, guide the quality, purity, and traceability requirements for gases used in food applications.

In regional markets, national codes such as BIS IS 307-1966 in India and China GB 10621-2006, support the development of consistent manufacturing practices. These regulatory frameworks are encouraging the adoption of highly purified food-grade gases along with safe storage and dispensing systems, leading to improved quality assurance and consumer confidence across the value chain.

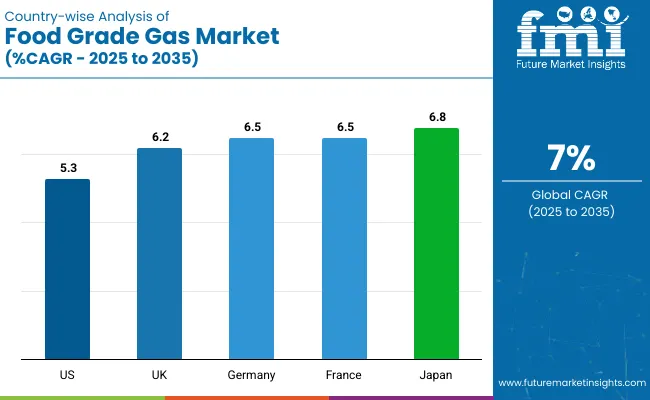
Japan is projected to be the fastest-growing market, expanding at a CAGR of 6.8% from 2025 to 2035. Nitrogen will lead the product type segment with a 34% market share, while packaging applications will dominate the application segment with a 21% share. The USA and Germany markets are also expected to grow steadily at CAGRs of 5.3% and 6.5%, respectively.

Food Grade Gas Market Analysis by Top Investment Segments

The food grade gas market is segmented by product type, application, end-use, and region. By product type, the market is divided into carbon dioxide, nitrogen, oxygen, sulfur dioxide, and others (argon, helium, hydrogen, and nitrous oxide). In terms of application, the market is segmented into packaging, carbonation, freezing & chilling, and others (modified atmosphere packaging, pasteurization, baking, and brewing).

Based on end-use, the market includes meat, dairy & frozen products, fish & seafood, beverages, bakery & confectionery, fruit & vegetables, and others (sauces & dressings, snacks, ready meals, and dairy alternatives). Regionally, the market is classified into North America, Latin America, Western Europe, Eastern Europe, East Asia, South Asia and Pacific, and the Middle East and Africa.

Nitrogen to Lead the Product Type Segment with 34% Market Share

Nitrogen are projected to lead the product segment, accounting for 34% of the global market share by 2025. These are widely used in packaging and chilling applications.
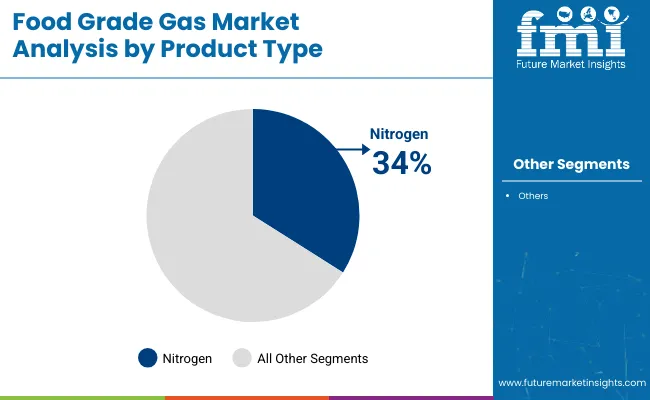
  • Nitrogen is preferred for its inert nature and ability to preserve freshness by displacing oxygen.
  • Increasing use in modified atmosphere packaging is growing across meat, dairy, and snack food segments.

Food Grade Gas Market Product Type

Packaging to Lead the Application Segment with 21% Market Share

The packaging is expected to lead the application segment, accounting for 21% of the global market share in 2025.Food grade gases are widely used in modified atmosphere packaging (MAP) to extend the shelf life of perishable products such as meat, dairy, bakery items, fruits, and ready-to-eat meals.
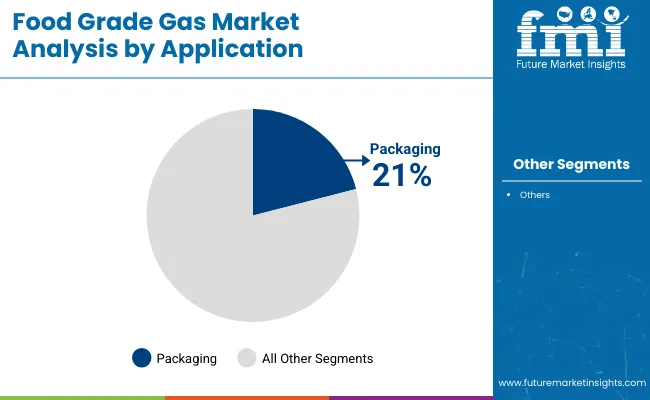
  • Rising demand for extended shelf life in packaged foods is driving adoption of food grade gases.
  • Carbon dioxide and nitrogen are widely used in sealing and preserving products without chemical additives.

Food Grade Gas Market By Application

Meat to Leadthe End Use Segment with 32% Market Share

Meat is expected to capture 32% of the market share in 2025. The meat processing industry is a leading consumer of food grade gases due to the critical need for freshness, microbial control, and safety during packaging and storage.

  • Modified atmosphere packaging with CO₂-rich blends is common in meat product lines.
  • The growth in protein consumption and cold chain expansion will support this trend globally.

The global food grade gas market is experiencing steady growth as the food and beverage industry focuses on safety, freshness, and longer shelf life. Food processors and packaging companies are adopting gases like nitrogen, carbon dioxide, and oxygen to meet consumer expectations and regulatory standards.
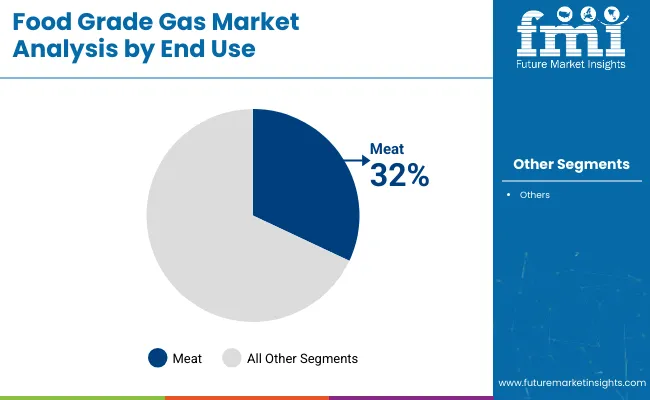
Food Grade Gas Market By End Use

Top Food Grade Gas Market Dynamics

Recent Trends in the Food Grade Gas Market

  • Growth in plant-based and clean-label products is increasing the need for chemical-free preservation using food grade gases.
  • Technological advancements in gas dosing systems and packaging automation are enhancing safety and accuracy in application.

Challenges in the Food Grade Gas Market
  • Stringent purity standards for gases used in direct food contact applications increase production and certification costs.
  • Supply chain complexity and the need for specialized storage and handling solutions add to logistical challenges in emerging markets.

Analyzing Top Countries Manufacturing and Supplying Food Grade Gas Market

Food Grade Gas Market Country Wise

Japan leads the food grade gas market driven by its strict food safety regulations, growing demand for ready-to-eat and convenience foods, and widespread adoption of modified atmosphere packaging (MAP) to extend shelf life. While the USA food grade gas market is growing at 5.3% CAGR, Germany at 6.5%, France at 6.5%, and the UK at 6.2%.

The USA leads in CO₂-based carbonation and nitrogen-sealed meat packaging, driven by FDA regulations and supermarket-led retail chains. Germany and France emphasize sustainability and export-focused MAP systems, encouraged by EU food safety policies. The Japan food grade gas market shows strong integration with chilled food logistics and compact nitrogen systems suited to small-format retail. The United Kingdom continues to prioritize workplace safety and food labeling standards while expanding MAP adoption across bakery and meal kits.

This report covers in-depth analysisof 40+ countries; five top-performing OECD countries are highlighted below.

Growth Outlook of the Food Grade Gas Market in the USA

The USA food grade gas revenue is growing at a CAGR of 5.3% from 2025 to 2035. Growth is driven by widespread use of CO₂ in beverages and nitrogen in processed meats, snacks, and dairy.

  • CO₂ is widely used in carbonation and cold preservation
  • Nitrogen applications dominate meat and snack packaging

Expansion Trends for Food Grade Gas Market in the UK

The UK food grade gas market is projected to expand at a CAGR of 6.2% over the forecast period. The demand is driven by clean-label food regulations and post-Brexit updates to food safety and import standards.

  • Steady growth in bakery and ready-meal packaging
  • Increased use of MAP in health-conscious and subscription food models

Growth for Food Grade Gas in Germany

The sales of food grade gas in Germany are projected to grow at a CAGR of 6.5% from 2025 to 2035. Growth is driven by meat exports, dairy processing, and baked goods, where nitrogen and CO₂ are essential for maintaining freshness and hygiene.

  • High demand in meat, dairy, and bakery exports
  • MAP and gas-sealing systems integrated into smart processing lines

Steady Expansion of Food Grade Gas in France

The French food grade gas market is forecasted to grow at a CAGR of 6.5% from 2025 to 2035. Growth is supported by increasing need for decarbonization and reduction of food waste are encouraging use of nitrogen and CO₂ across seafood, dairy, and pastry segments.

  • MAP adoption increasing in seafood, cheese, and pastries
  • Focus on decarbonization and shelf life enhancement

Japan Food Grade Gas Market Analysis

The demand for food grade gas in Japan is projected to grow at a CAGR of 6.8% during the forecast period. Growth is driven by increasing focus on compact, high-efficiency nitrogen systems used in convenience store meals, ready-to-eat bento boxes, and chilled desserts.

  • Strong demand in chilled and pre-packaged food categories
  • High-tech integration in nitrogen-based MAP systems

Leading Food Grade Gas Suppliers

The food grade gas market is moderately consolidated, with prominent players such as Linde Group, Air Liquide, Air Products and Chemicals, Inc., Messer Group GmbH, Wesfarmers Ltd SOL Group, Gulf Cryo, Air Water, Inc., Massy Group, PT Aneka Industri, National Gases Limited, and Taiyo Nippon Sanso. These companies provide high-purity gases and integrated gas solutions catering to food and beverage processing, packaging, chilling, and carbonation applications.

Key players continue to invest in purity validation, gas distribution innovation, and automation to meet global regulatory standards such as FDA CFR Title 21 and EU Regulation EC 1333/2008.

Recent Food Grade Gas Industry News

  • In May 2025, Air Liquide expanded its presence in Germany by acquiring intensivLeben GmbH and AP-Sachsen GmbH. This acquisition strengthens its healthcare sector, supporting over 220,000 patients in Germany and 2.1 million globally with chronic diseases.
  • In April 2024, Linde increased production capacity at its Mims, Florida facility by 50% to meet rising demand for oxygen, nitrogen, and argon. The expansion supports sectors including healthcare, manufacturing, food processing, water treatment, and aerospace.

Report Scope Table

Report Attributes Details
Market Size (2025) USD 7.7 billion
Projected Market Size (2035) USD 15.1 billion
CAGR (2025 to 2035) 7%
Base Year for Estimation 2024
Historical Period 2020 to 2024
Projections Period 2025 to 2035
Report Parameter USD billion for value /volume in tons
Product Types Analyzed Carbon Dioxide, Nitrogen, Oxygen, Sulfur Dioxide, and Others ( Argon, Helium, Hydrogen, and Nitrous Oxide)
Applications Analyzed Packaging, Freezing and Chilling, Carbonation, Others ( Modified Atmosphere Packaging, Pasteurization, Baking, and Brewing)
End - Use Analyzed Meat, Dairy and Frozen Products, Beverages, Bakery and Confectionery, Fish and Seafood, Fruits and Vegetables, Others ( Sauces & Dressings, Snacks, Ready Meals, and Dairy Alternatives)
Regions Covered North America, Latin America, Western Europe, Eastern Europe, South Asia and Pacific, East Asia, Middle East and Africa
Countries Covered United States, Canada, United Kingdom, Germany, France, China, Japan, South Korea, Brazil, Australia
Key Players Influencing the Market Linde Group, Air Liquide, Air Products and Chemicals, Inc., Messer Group GmbH, Wesfarmers Ltd SOL Group , Gulf Cryo ,, Air Water, Inc. , Massy Group , PT Aneka Industri , National Gases Limited , and Taiyo Nippon Sanso
Additional Attributes Market share analysis by source and grade, country-wise CAGR analysis, and brand positioning insights

Key Segments

By Product Type:

  • Carbon Di Oxide
  • Nitrogen
  • Oxygen
  • Sulfur dioxide
  • Other Product Types

By Application:

  • Freezing & Chilling
  • Packaging
  • Carbonation
  • Other Applications

By End Use Verticals:

  • Dairy & Frozen Products
  • Fish & Sea Food
  • Meat
  • Beverages
  • Fruit & Vegetables
  • Bakery & Confectionery
  • Other Verticals

By Region:

  • North America
  • Latin America
  • Europe
  • East Asia
  • South Asia and Pacific
  • The Middle East and Africa (MEA)

Table of Content

  1. Executive Summary
    • Global Market Outlook
    • Demand-side Trends
    • Supply-side Trends
    • Technology Roadmap Analysis
    • Analysis and Recommendations
  2. Market Overview
    • Market Coverage / Taxonomy
    • Market Definition / Scope / Limitations
  3. Market Background
    • Market Dynamics
      • Drivers
      • Restraints
      • Opportunity
      • Trends
    • Scenario Forecast
      • Demand in Optimistic Scenario
      • Demand in Likely Scenario
      • Demand in Conservative Scenario
    • Opportunity Map Analysis
    • Product Life Cycle Analysis
    • Supply Chain Analysis
      • Supply Side Participants and their Roles
        • Producers
        • Mid-Level Participants (Traders/ Agents/ Brokers)
        • Wholesalers and Distributors
      • Value Added and Value Created at Node in the Supply Chain
      • List of Raw Material Suppliers
      • List of Existing and Potential Buyer’s
    • Investment Feasibility Matrix
    • Value Chain Analysis
      • Profit Margin Analysis
      • Wholesalers and Distributors
      • Retailers
    • PESTLE and Porter’s Analysis
    • Regulatory Landscape
      • By Key Regions
      • By Key Countries
    • Regional Parent Market Outlook
    • Production and Consumption Statistics
    • Import and Export Statistics
  4. Global Market Analysis 2020-2024 and Forecast, 2025-2035
    • Historical Market Size Value (USD Billion) & Volume (Tons) Analysis, 2020-2024
    • Current and Future Market Size Value (USD Billion) & Volume (Tons) Projections, 2025-2035
      • Y-o-Y Growth Trend Analysis
      • Absolute $ Opportunity Analysis
  5. Global Market Pricing Analysis 2020-2024 and Forecast 2025-2035
  6. Global Market Analysis 2020-2024 and Forecast 2025-2035, By Product Type
    • Introduction / Key Findings
    • Historical Market Size Value (USD Billion) & Volume (Tons) Analysis By Product Type, 2020-2024
    • Current and Future Market Size Value (USD Billion) & Volume (Tons) Analysis and Forecast By Product Type, 2025-2035
      • Carbon Dioxide
      • Nitrogen
      • Oxygen
      • Sulfur dioxide
      • Others
        • Argon
        • Helium
        • Hydrogen
        • Nitrous Oxide
    • Y-o-Y Growth Trend Analysis By Product Type, 2020-2024
    • Absolute $ Opportunity Analysis By Product Type, 2025-2035
  7. Global Market Analysis 2020-2024 and Forecast 2025-2035, By Application
    • Introduction / Key Findings
    • Historical Market Size Value (USD Billion) & Volume (Tons) Analysis By Application, 2020-2024
    • Current and Future Market Size Value (USD Billion) & Volume (Tons) Analysis and Forecast By Application, 2025-2035
      • Freezing & Chilling
      • Packaging
      • Carbonation
      • Others
        • Modified Atmosphere Packaging
        • Pasteurization
        • Baking
        • Brewing
    • Y-o-Y Growth Trend Analysis By Application, 2020-2024
    • Absolute $ Opportunity Analysis By Application, 2025-2035
  8. Global Market Analysis 2020-2024 and Forecast 2025-2035, By End-Use
    • Introduction / Key Findings
    • Historical Market Size Value (USD Billion) & Volume (Tons) Analysis By End-Use, 2020-2024
    • Current and Future Market Size Value (USD Billion) & Volume (Tons) Analysis and Forecast By End-Use, 2025-2035
      • Dairy & Frozen Products
  9. " 8.3.2. Fish & Seafood
        • Meat
        • Beverages
        • Fruit & Vegetables
        • Bakery & Confectionery
        • Others
    • 8.3.7.1. Sauces & Dressings
    • 8.3.7.2. Snacks
    • 8.3.7.3. Ready Meals
    • 8.3.7.4. Dairy Alternatives
      • Y-o-Y Growth Trend Analysis By End-Use, 2020-2024
      • Absolute $ Opportunity Analysis By End-Use, 2025-2035
    • Global Market Analysis 2020-2024 and Forecast 2025-2035, By Region
      • Introduction
      • Historical Market Size Value (USD Billion) & Volume (Tons) Analysis By Region, 2020-2024
      • Current Market Size Value (USD Billion) & Volume (Tons) Analysis and Forecast By Region, 2025-2035
        • North America
        • Latin America
        • Western Europe
        • Eastern Europe
        • East Asia
        • South Asia & Pacific
        • Middle East and Africa
      • Market Attractiveness Analysis By Region
    • North America Market Analysis 2020-2024 and Forecast 2025-2035, By Country
      • Historical Market Size Value (USD Billion) & Volume (Tons) Trend Analysis By Market Taxonomy, 2020-2024
      • Market Size Value (USD Billion) & Volume (Tons) Forecast By Market Taxonomy, 2025-2035
        • By Country
          • USA
          • Canada
          • Mexico
        • By Product Type
        • By Application
        • By End-Use
      • Market Attractiveness Analysis
        • By Country
        • By Product Type
        • By Application
        • By End-Use
      • Key Takeaways
    • Latin America Market Analysis 2020-2024 and Forecast 2025-2035, By Country
      • Historical Market Size Value (USD Billion) & Volume (Tons) Trend Analysis By Market Taxonomy, 2020-2024
      • Market Size Value (USD Billion) & Volume (Tons) Forecast By Market Taxonomy, 2025-2035
        • By Country
          • Brazil
          • Argentina
          • Rest of LATAM
        • By Product Type
        • By Application
        • By End-Use
      • Market Attractiveness Analysis
        • By Country
        • By Product Type
        • By Application
        • By End-Use
      • Key Takeaways
    • Western Europe Market Analysis 2020-2024 and Forecast 2025-2035, By Country
      • Historical Market Size Value (USD Billion) & Volume (Tons) Trend Analysis By Market Taxonomy, 2020-2024
      • Market Size Value (USD Billion) & Volume (Tons) Forecast By Market Taxonomy, 2025-2035
        • By Country
          • Germany
          • Italy
          • France
          • UK
          • Spain
          • BENELUX
          • Nordic
          • Rest of W.Europe
        • By Product Type
        • By Application
        • By End-Use
      • Market Attractiveness Analysis
        • By Country
        • By Product Type
        • By Application
        • By End-Use
      • Key Takeaways
    • Eastern Europe Market Analysis 2020-2024 and Forecast 2025-2035, By Country
      • Historical Market Size Value (USD Billion) & Volume (Tons) Trend Analysis By Market Taxonomy, 2020-2024
      • Market Size Value (USD Billion) & Volume (Tons) Forecast By Market Taxonomy, 2025-2035
        • By Country
          • Russia
          • Hungary
          • Poland
          • Balkan & Baltics
          • Rest of E. Europe
        • By Product Type
        • By Application
        • By End-Use
      • Market Attractiveness Analysis
        • By Country
        • By Product Type
        • By Application
        • By End-Use
      • Key Takeaways
    • East Asia Market Analysis 2020-2024 and Forecast 2025-2035, By Country
      • Historical Market Size Value (USD Billion) & Volume (Tons) Trend Analysis By Market Taxonomy, 2020-2024
      • Market Size Value (USD Billion) & Volume (Tons) Forecast By Market Taxonomy, 2025-2035
        • By Country
          • China
          • Japan
          • South Korea
        • By Product Type
        • By Application
        • By End-Use
      • Market Attractiveness Analysis
        • By Country
        • By Product Type
        • By Application
        • By End-Use
      • Key Takeaways
    • South Asia & Pacific Market Analysis 2020-2024 and Forecast 2025-2035, By Country
      • Historical Market Size Value (USD Billion) & Volume (Tons) Trend Analysis By Market Taxonomy, 2020-2024
      • Market Size Value (USD Billion) & Volume (Tons) Forecast By Market Taxonomy, 2025-2035
        • By Country
          • India
          • Australia & New Zealand
          • ASEAN
          • Rest of SAP
        • By Product Type
        • By Application
        • By End-Use
      • Market Attractiveness Analysis
        • By Country
        • By Product Type
        • By Application
        • By End-Use
      • Key Takeaways
    • Middle East and Africa Market Analysis 2020-2024 and Forecast 2025-2035, By Country
      • Historical Market Size Value (USD Billion) & Volume (Tons) Trend Analysis By Market Taxonomy, 2020-2024
      • Market Size Value (USD Billion) & Volume (Tons) Forecast By Market Taxonomy, 2025-2035
        • By Country
          • GCC Countries
          • Northern Africa
          • South Africa
          • Turkiye
          • Rest of MEA
        • By Product Type
        • By Application
        • By End-Use
      • Market Attractiveness Analysis
        • By Country
        • By Product Type
        • By Application
        • By End-Use
      • Key Takeaways
    • Key Countries Market Analysis
      • USA
        • Pricing Analysis
        • Market Share Analysis, 2024
          • By Product Type
          • By Application
          • By End-Use
      • Canada
        • Pricing Analysis
        • Market Share Analysis, 2024
          • By Product Type
          • By Application
          • By End-Use
      • Brazil
        • Pricing Analysis
        • Market Share Analysis, 2024
          • By Product Type
          • By Application
          • By End-Use
      • Mexico
        • Pricing Analysis
        • Market Share Analysis, 2024
          • By Product Type
          • By Application
          • By End-Use
      • Argentina
        • Pricing Analysis
        • Market Share Analysis, 2024
          • By Product Type
          • By Application
          • By End-Use
    • Market Structure Analysis
      • Competition Dashboard
      • Competition Benchmarking
      • Market Share Analysis of Top Players
        • By Regional
        • By Product Type
        • By Application
        • By End-Use
    • Competition Analysis
      • Competition Deep Dive
        • Linde Group & Praxair, Inc.
          • Overview
          • Product Portfolio
          • Profitability by Market Segments (Product/Age /Sales Channel/Region)
          • Sales Footprint
          • Strategy Overview
            • Marketing Strategy
            • Product Strategy
            • Channel Strategy
        • Air Products & Chemicals, Inc.
          • Overview
          • Product Portfolio
          • Profitability by Market Segments (Product/Age /Sales Channel/Region)
          • Sales Footprint
          • Strategy Overview
            • Marketing Strategy
            • Product Strategy
            • Channel Strategy
        • Air Liquide
          • Overview
          • Product Portfolio
          • Profitability by Market Segments (Product/Age /Sales Channel/Region)
          • Sales Footprint
          • Strategy Overview
            • Marketing Strategy
            • Product Strategy
            • Channel Strategy
        • The Messer Group GmbH
          • Overview
          • Product Portfolio
          • Profitability by Market Segments (Product/Age /Sales Channel/Region)
          • Sales Footprint
          • Strategy Overview
            • Marketing Strategy
            • Product Strategy
            • Channel Strategy
        • Taiyo Nippon Sanso
          • Overview
          • Product Portfolio
          • Profitability by Market Segments (Product/Age /Sales Channel/Region)
          • Sales Footprint
          • Strategy Overview
            • Marketing Strategy
            • Product Strategy
            • Channel Strategy
        • Wesfarmers Ltd SOL Group
          • Overview
          • Product Portfolio
          • Profitability by Market Segments (Product/Age /Sales Channel/Region)
          • Sales Footprint
          • Strategy Overview
            • Marketing Strategy
            • Product Strategy
            • Channel Strategy
        • Gulf Cryo
          • Overview
          • Product Portfolio
          • Profitability by Market Segments (Product/Age /Sales Channel/Region)
          • Sales Footprint
          • Strategy Overview
            • Marketing Strategy
            • Product Strategy
            • Channel Strategy
        • Air Water, Inc.
          • Overview
          • Product Portfolio
          • Profitability by Market Segments (Product/Age /Sales Channel/Region)
          • Sales Footprint
          • Strategy Overview
            • Marketing Strategy
            • Product Strategy
            • Channel Strategy
        • Massy Group
          • Overview
          • Product Portfolio
          • Profitability by Market Segments (Product/Age /Sales Channel/Region)
          • Sales Footprint
          • Strategy Overview
            • Marketing Strategy
            • Product Strategy
            • Channel Strategy
        • PT Aneka Industri
          • Overview
          • Product Portfolio
          • Profitability by Market Segments (Product/Age /Sales Channel/Region)
          • Sales Footprint
          • Strategy Overview
            • Marketing Strategy
            • Product Strategy
            • Channel Strategy
        • National Gases Limited
          • Overview
          • Product Portfolio
          • Profitability by Market Segments (Product/Age /Sales Channel/Region)
          • Sales Footprint
          • Strategy Overview
            • Marketing Strategy
            • Product Strategy
            • Channel Strategy
    • Assumptions & Acronyms Used
    • Research Methodology

List of Tables

  • Table 1: Global Market Value (USD Billion) Forecast by Region, 2020-2035
  • Table 2: Global Market Volume (Tons) Forecast by Region, 2020-2035
  • Table 3: Global Market Value (USD Billion) Forecast by Product Type, 2020-2035
  • Table 4: Global Market Volume (Tons) Forecast by Product Type, 2020-2035
  • Table 5: Global Market Value (USD Billion) Forecast by Application, 2020-2035
  • Table 6: Global Market Volume (Tons) Forecast by Application, 2020-2035
  • Table 7: Global Market Value (USD Billion) Forecast by End-Use, 2020-2035
  • Table 8: Global Market Volume (Tons) Forecast by End-Use, 2020-2035
  • Table 9: North America Market Value (USD Billion) Forecast by Country, 2020-2035
  • Table 10: North America Market Volume (Tons) Forecast by Country, 2020-2035
  • Table 11: North America Market Value (USD Billion) Forecast by Product Type, 2020-2035
  • Table 12: North America Market Volume (Tons) Forecast by Product Type, 2020-2035
  • Table 13: North America Market Value (USD Billion) Forecast by Application, 2020-2035
  • Table 14: North America Market Volume (Tons) Forecast by Application, 2020-2035
  • Table 15: North America Market Value (USD Billion) Forecast by End-Use, 2020-2035
  • Table 16: North America Market Volume (Tons) Forecast by End-Use, 2020-2035
  • Table 17: Latin America Market Value (USD Billion) Forecast by Country, 2020-2035
  • Table 18: Latin America Market Volume (Tons) Forecast by Country, 2020-2035
  • Table 19: Latin America Market Value (USD Billion) Forecast by Product Type, 2020-2035
  • Table 20: Latin America Market Volume (Tons) Forecast by Product Type, 2020-2035
  • Table 21: Latin America Market Value (USD Billion) Forecast by Application, 2020-2035
  • Table 22: Latin America Market Volume (Tons) Forecast by Application, 2020-2035
  • Table 23: Latin America Market Value (USD Billion) Forecast by End-Use, 2020-2035
  • Table 24: Latin America Market Volume (Tons) Forecast by End-Use, 2020-2035
  • Table 25: Western Europe Market Value (USD Billion) Forecast by Country, 2020-2035
  • Table 26: Western Europe Market Volume (Tons) Forecast by Country, 2020-2035
  • Table 27: Western Europe Market Value (USD Billion) Forecast by Product Type, 2020-2035
  • Table 28: Western Europe Market Volume (Tons) Forecast by Product Type, 2020-2035
  • Table 29: Western Europe Market Value (USD Billion) Forecast by Application, 2020-2035
  • Table 30: Western Europe Market Volume (Tons) Forecast by Application, 2020-2035
  • Table 31: Western Europe Market Value (USD Billion) Forecast by End-Use, 2020-2035
  • Table 32: Western Europe Market Volume (Tons) Forecast by End-Use, 2020-2035
  • Table 33: Eastern Europe Market Value (USD Billion) Forecast by Country, 2020-2035
  • Table 34: Eastern Europe Market Volume (Tons) Forecast by Country, 2020-2035
  • Table 35: Eastern Europe Market Value (USD Billion) Forecast by Product Type, 2020-2035
  • Table 36: Eastern Europe Market Volume (Tons) Forecast by Product Type, 2020-2035
  • Table 37: Eastern Europe Market Value (USD Billion) Forecast by Application, 2020-2035
  • Table 38: Eastern Europe Market Volume (Tons) Forecast by Application, 2020-2035
  • Table 39: Eastern Europe Market Value (USD Billion) Forecast by End-Use, 2020-2035
  • Table 40: Eastern Europe Market Volume (Tons) Forecast by End-Use, 2020-2035
  • Table 41: East Asia Market Value (USD Billion) Forecast by Country, 2020-2035
  • Table 42: East Asia Market Volume (Tons) Forecast by Country, 2020-2035
  • Table 43: East Asia Market Value (USD Billion) Forecast by Product Type, 2020-2035
  • Table 44: East Asia Market Volume (Tons) Forecast by Product Type, 2020-2035
  • Table 45: East Asia Market Value (USD Billion) Forecast by Application, 2020-2035
  • Table 46: East Asia Market Volume (Tons) Forecast by Application, 2020-2035
  • Table 47: East Asia Market Value (USD Billion) Forecast by End-Use, 2020-2035
  • Table 48: East Asia Market Volume (Tons) Forecast by End-Use, 2020-2035
  • Table 49: South Asia & Pacific Market Value (USD Billion) Forecast by Country, 2020-2035
  • Table 50: South Asia & Pacific Market Volume (Tons) Forecast by Country, 2020-2035
  • Table 51: South Asia & Pacific Market Value (USD Billion) Forecast by Product Type, 2020-2035
  • Table 52: South Asia & Pacific Market Volume (Tons) Forecast by Product Type, 2020-2035
  • Table 53: South Asia & Pacific Market Value (USD Billion) Forecast by Application, 2020-2035
  • Table 54: South Asia & Pacific Market Volume (Tons) Forecast by Application, 2020-2035
  • Table 55: South Asia & Pacific Market Value (USD Billion) Forecast by End-Use, 2020-2035
  • Table 56: South Asia & Pacific Market Volume (Tons) Forecast by End-Use, 2020-2035
  • Table 57: Middle East and Africa Market Value (USD Billion) Forecast by Country, 2020-2035
  • Table 58: Middle East and Africa Market Volume (Tons) Forecast by Country, 2020-2035
  • Table 59: Middle East and Africa Market Value (USD Billion) Forecast by Product Type, 2020-2035
  • Table 60: Middle East and Africa Market Volume (Tons) Forecast by Product Type, 2020-2035
  • Table 61: Middle East and Africa Market Value (USD Billion) Forecast by Application, 2020-2035
  • Table 62: Middle East and Africa Market Volume (Tons) Forecast by Application, 2020-2035
  • Table 63: Middle East and Africa Market Value (USD Billion) Forecast by End-Use, 2020-2035
  • Table 64: Middle East and Africa Market Volume (Tons) Forecast by End-Use, 2020-2035

List of Figures

  • Figure 1: Global Market Volume (Tons) Forecast 2020-2035
  • Figure 2: Global Market Pricing Analysis
  • Figure 3: Global Market Value (USD Billion) Forecast 2020-2035
  • Figure 4: Global Market Value Share and BPS Analysis by Product Type, 2025 and 2035
  • Figure 5: Global Market Y-o-Y Growth Comparison by Product Type, 2025-2035
  • Figure 6: Global Market Attractiveness Analysis by Product Type
  • Figure 7: Global Market Value Share and BPS Analysis by Application, 2025 and 2035
  • Figure 8: Global Market Y-o-Y Growth Comparison by Application, 2025-2035
  • Figure 9: Global Market Attractiveness Analysis by Application
  • Figure 10: Global Market Value Share and BPS Analysis by End-Use, 2025 and 2035
  • Figure 11: Global Market Y-o-Y Growth Comparison by End-Use, 2025-2035
  • Figure 12: Global Market Attractiveness Analysis by End-Use
  • Figure 13: Global Market Value (USD Billion) Share and BPS Analysis by Region, 2025 and 2035
  • Figure 14: Global Market Y-o-Y Growth Comparison by Region, 2025-2035
  • Figure 15: Global Market Attractiveness Analysis by Region
  • Figure 16: North America Market Incremental $ Opportunity, 2025-2035
  • Figure 17: Latin America Market Incremental $ Opportunity, 2025-2035
  • Figure 18: Western Europe Market Incremental $ Opportunity, 2025-2035
  • Figure 19: Eastern Europe Market Incremental $ Opportunity, 2025-2035
  • Figure 20: East Asia Market Incremental $ Opportunity, 2025-2035
  • Figure 21: South Asia & Pacific Market Incremental $ Opportunity, 2025-2035
  • Figure 22: Middle East and Africa Market Incremental $ Opportunity, 2025-2035
  • Figure 23: North America Market Value Share and BPS Analysis by Country, 2025 and 2035
  • Figure 24: North America Market Value Share and BPS Analysis by Product Type, 2025 and 2035
  • Figure 25: North America Market Y-o-Y Growth Comparison by Product Type, 2025-2035
  • Figure 26: North America Market Attractiveness Analysis by Product Type
  • Figure 27: North America Market Value Share and BPS Analysis by Application, 2025 and 2035
  • Figure 28: North America Market Y-o-Y Growth Comparison by Application, 2025-2035
  • Figure 29: North America Market Attractiveness Analysis by Application
  • Figure 30: North America Market Value Share and BPS Analysis by End-Use, 2025 and 2035
  • Figure 31: North America Market Y-o-Y Growth Comparison by End-Use, 2025-2035
  • Figure 32: North America Market Attractiveness Analysis by End-Use
  • Figure 33: Latin America Market Value Share and BPS Analysis by Country, 2025 and 2035
  • Figure 34: Latin America Market Value Share and BPS Analysis by Product Type, 2025 and 2035
  • Figure 35: Latin America Market Y-o-Y Growth Comparison by Product Type, 2025-2035
  • Figure 36: Latin America Market Attractiveness Analysis by Product Type
  • Figure 37: Latin America Market Value Share and BPS Analysis by Application, 2025 and 2035
  • Figure 38: Latin America Market Y-o-Y Growth Comparison by Application, 2025-2035
  • Figure 39: Latin America Market Attractiveness Analysis by Application
  • Figure 40: Latin America Market Value Share and BPS Analysis by End-Use, 2025 and 2035
  • Figure 41: Latin America Market Y-o-Y Growth Comparison by End-Use, 2025-2035
  • Figure 42: Latin America Market Attractiveness Analysis by End-Use
  • Figure 43: Western Europe Market Value Share and BPS Analysis by Country, 2025 and 2035
  • Figure 44: Western Europe Market Value Share and BPS Analysis by Product Type, 2025 and 2035
  • Figure 45: Western Europe Market Y-o-Y Growth Comparison by Product Type, 2025-2035
  • Figure 46: Western Europe Market Attractiveness Analysis by Product Type
  • Figure 47: Western Europe Market Value Share and BPS Analysis by Application, 2025 and 2035
  • Figure 48: Western Europe Market Y-o-Y Growth Comparison by Application, 2025-2035
  • Figure 49: Western Europe Market Attractiveness Analysis by Application
  • Figure 50: Western Europe Market Value Share and BPS Analysis by End-Use, 2025 and 2035
  • Figure 51: Western Europe Market Y-o-Y Growth Comparison by End-Use, 2025-2035
  • Figure 52: Western Europe Market Attractiveness Analysis by End-Use
  • Figure 53: Eastern Europe Market Value Share and BPS Analysis by Country, 2025 and 2035
  • Figure 54: Eastern Europe Market Value Share and BPS Analysis by Product Type, 2025 and 2035
  • Figure 55: Eastern Europe Market Y-o-Y Growth Comparison by Product Type, 2025-2035
  • Figure 56: Eastern Europe Market Attractiveness Analysis by Product Type
  • Figure 57: Eastern Europe Market Value Share and BPS Analysis by Application, 2025 and 2035
  • Figure 58: Eastern Europe Market Y-o-Y Growth Comparison by Application, 2025-2035
  • Figure 59: Eastern Europe Market Attractiveness Analysis by Application
  • Figure 60: Eastern Europe Market Value Share and BPS Analysis by End-Use, 2025 and 2035
  • Figure 61: Eastern Europe Market Y-o-Y Growth Comparison by End-Use, 2025-2035
  • Figure 62: Eastern Europe Market Attractiveness Analysis by End-Use
  • Figure 63: East Asia Market Value Share and BPS Analysis by Country, 2025 and 2035
  • Figure 64: East Asia Market Value Share and BPS Analysis by Product Type, 2025 and 2035
  • Figure 65: East Asia Market Y-o-Y Growth Comparison by Product Type, 2025-2035
  • Figure 66: East Asia Market Attractiveness Analysis by Product Type
  • Figure 67: East Asia Market Value Share and BPS Analysis by Application, 2025 and 2035
  • Figure 68: East Asia Market Y-o-Y Growth Comparison by Application, 2025-2035
  • Figure 69: East Asia Market Attractiveness Analysis by Application
  • Figure 70: East Asia Market Value Share and BPS Analysis by End-Use, 2025 and 2035
  • Figure 71: East Asia Market Y-o-Y Growth Comparison by End-Use, 2025-2035
  • Figure 72: East Asia Market Attractiveness Analysis by End-Use
  • Figure 73: South Asia & Pacific Market Value Share and BPS Analysis by Country, 2025 and 2035
  • Figure 74: South Asia & Pacific Market Value Share and BPS Analysis by Product Type, 2025 and 2035
  • Figure 75: South Asia & Pacific Market Y-o-Y Growth Comparison by Product Type, 2025-2035
  • Figure 76: South Asia & Pacific Market Attractiveness Analysis by Product Type
  • Figure 77: South Asia & Pacific Market Value Share and BPS Analysis by Application, 2025 and 2035
  • Figure 78: South Asia & Pacific Market Y-o-Y Growth Comparison by Application, 2025-2035
  • Figure 79: South Asia & Pacific Market Attractiveness Analysis by Application
  • Figure 80: South Asia & Pacific Market Value Share and BPS Analysis by End-Use, 2025 and 2035
  • Figure 81: South Asia & Pacific Market Y-o-Y Growth Comparison by End-Use, 2025-2035
  • Figure 82: South Asia & Pacific Market Attractiveness Analysis by End-Use
  • Figure 83: Middle East and Africa Market Value Share and BPS Analysis by Country, 2025 and 2035
  • Figure 84: Middle East and Africa Market Value Share and BPS Analysis by Product Type, 2025 and 2035
  • Figure 85: Middle East and Africa Market Y-o-Y Growth Comparison by Product Type, 2025-2035
  • Figure 86: Middle East and Africa Market Attractiveness Analysis by Product Type
  • Figure 87: Middle East and Africa Market Value Share and BPS Analysis by Application, 2025 and 2035
  • Figure 88: Middle East and Africa Market Y-o-Y Growth Comparison by Application, 2025-2035
  • Figure 89: Middle East and Africa Market Attractiveness Analysis by Application
  • Figure 90: Middle East and Africa Market Value Share and BPS Analysis by End-Use, 2025 and 2035
  • Figure 91: Middle East and Africa Market Y-o-Y Growth Comparison by End-Use, 2025-2035
  • Figure 92: Middle East and Africa Market Attractiveness Analysis by End-Use
  • Figure 93: Global Market - Tier Structure Analysis
  • Figure 94: Global Market - Company Share Analysis

Frequently Asked Questions

What is the projected size of the food grade gas market in 2025?

The market is valued at USD 7.7 billion in 2025.

What is the outlook on food grade gas demand by 2035?

The market is forecasted to reach USD 15.1 billion by 2035.

Which segment leads the food grade gas market by product type in 2025?

Nitrogen will lead the product type segment with a 34% market share in 2025.

What is the top application sector for the food grade gas market in 2025?

The packaging segment is expected to hold approximately 21% share in 2025.

Which country is projected to have the fastest-growing food grade gas market?

Japan is anticipated to be the fastest-growing market, with a CAGR of 6.8% from 2025 to 2035.

Explore Similar Insights

Future Market Insights

Food Grade Gas Market