Reports

- Global Locations -

Headquarters

Future Market Insights, Inc.

Christiana Corporate, 200
Continental Drive, Suite 401,
Newark, Delaware - 19713,
United States

T: +1-845-579-5705

Americas

Future Market Insights, Inc.

616 Corporate Way, Suite 2-9018,
Valley Cottage, NY 10989, United States

T: +1-347-918-3531

MEA

Future Market Insights

1602-6 Jumeirah Bay X2 Tower, Plot No: JLT-PH2-X2A,
Jumeirah Lakes Towers, Dubai,
United Arab Emirates

Europe

Future Market Insights

3rd Floor, 207 Regent Street,
W1B 3HH London
United Kingdom

T: + 44 (0) 20 8123 9659
D: +44 (0) 20 3287 4268

Asia Pacific

Future Market Insights

IndiaLand Global Tech Park, Unit UG-1, Behind Grand HighStreet, Phase 1, Hinjawadi, MH, Pune – 411057, India

Food Holding Equipment Market Outlook (2023 to 2033)

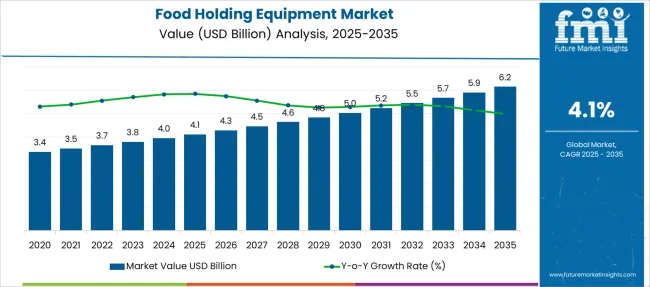
During the projected period (2023-2033), the global food holding equipment market is expected to grow at a CAGR of 4.1%. The food holding equipment market is projected to reach a valuation of US$ 5,679.2 million by the end of 2033 from US$ 3,800 million in 2023.

A commercial kitchen's performance is based on a large number of variables, but keeping advanced food equipment is paramount. Commercial holding equipment is used in full-service and quick-service restaurants to keep food at the ideal serving temperature and preserve its freshness. Over the past two decades, the restaurant industry has continually grown, thereby creating new opportunities for leading players in the commercial food holding equipment market.

Expanding restaurant industry and the rising number of supermarkets & delis around the world are projected to boost the global food holding equipment market in the next ten years. Digital innovations are expected to be a significant revenue and consumer retention driver in the assessment period.

Moreover, customer loyalty programs launched by restaurants would allow them to enhance and personalize their interactions with customers. They can easily gain access to the information by utilizing point-of-sale orders, as well as online and mobile ordering. Integration of this crucial data would further help cafes & restaurants to generate customized rewards based on their ordering habits in addition to promotions and discounts.

The rising number of independent quick-service restaurants in both developed and developing countries is also expected to push the global food holding equipment market during the assessment period. The growing trend of delivering sophisticated facilities, dining out, and less spending of time by consumers on cooking at home are anticipated to augur well for the global market.

In December 2021, for instance, FMCG major CavinKare announced its entry into the quick service restaurant (QSR) segment as part of its innovative retail expansion plans. The company introduced Jango’z, its new brand at Perambur in Chennai.

It is aiming to set up more than 100 outlets across various strategic locations in India by 2026. Thus, similar restaurant launches by key companies in various parts of the globe are anticipated to bode well for the global food holding equipment market in the next ten years.

Attributes Key Insights
Global Food Holding Equipment Market Estimated Size (2023E) US$ 3,800 Million
Projected Market Valuation (2033F) US$ 5,679.2 Million
Value-based CAGR (2023 to 2033) 4.1%

Don't pay for what you don't need

Customize your report by selecting specific countries or regions and save 30%!

2018 to 2022 Global Food Holding Equipment Market Outlook Compared to 2023 to 2033 Demand Forecast

During the historical period from 2018 to 2022, the global food holding equipment market witnessed steady growth at a CAGR of 3.2%. Numerous end users of commercial food warming & holding equipment are consistently focusing on enhancing the safety of large quantities of cooked food items.

Warming equipment has emerged as one of the most effective tools to ensure protection from harmful bacteria and pathogens. Pathogens are set to multiply in numbers between 5 ºC and 63 ºC and therefore, demand for warming equipment is poised to grow at a rapid pace during the forecast period.

The Food Safety Regulations 1995 and similar other regulations have been implemented by government agencies to ensure the safety of consumers. Foodservice participants are also continually putting efforts to ensure that the cooked food is free from harmful bacteria and remains at the desired temperature level, which is set to push the use of food holding and warming equipment. Owing to the aforementioned factors, the global food holding equipment market is anticipated to exhibit a CAGR of 4.1% from 2023 to 2033.

Market-o-Nomics - Highlighting the Key Trends

A number of influential factors have been identified to play a significant role in the food-holding equipment market. Analysts at FMI have also analyzed the restraining factors, lucrative opportunities, and upcoming threats that can pose a challenge to the progression of the food-holding equipment market.

The drivers, restraints, opportunities, and threats (DROTs) identified are as follows:

DRIVERS

  • Growth of the e-commerce sector, availability of easy & quick delivery facilities, and rising popularity of several cuisines are projected to drive the market.
  • Rising public & private sector investments, high demand for convenience food, and growing dining out trend are expected to push the market.

RESTRAINTS

  • Several quick-service restaurants utilize frozen foods that are often prepared off-site to surge the speed of order delivery, which may degrade food quality.
  • Fast foods are mainly developed in a way that addictive elements are part of the experience, which can elevate the risk of obesity and diabetes.

OPPORTUNITIES

  • As families nowadays spend about two hours in the evening managing their afterschool activities, quick-service restaurants can help manage the schedules of consumers.
  • Fast food restaurants can help in reducing hunger problems in various communities with the availability of cost-effective food items.

THREATS

  • Certain ingredients in processed food such as phthalates can have a negative impact on adult fertility.
  • Sugar and carbohydrates in fast food items can surge the number of acids in one’s mouth, thereby causing the tooth enamel to break down and paving the way for bacteria to come in and create cavities.
Nandini Roy Choudhury

Principal Consultant

Talk to Analyst

Find your sweet spots for generating winning opportunities in this market.

Country-wise Insights

How are US-based Food Holding Equipment Companies Faring?

“Fast Food Outlets in the US to Look for Advanced Food Preparation Equipment”

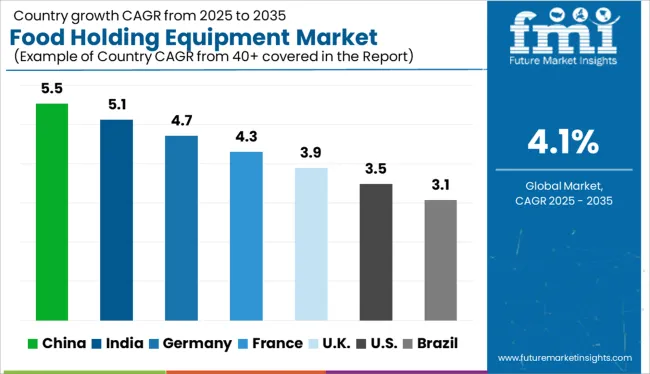
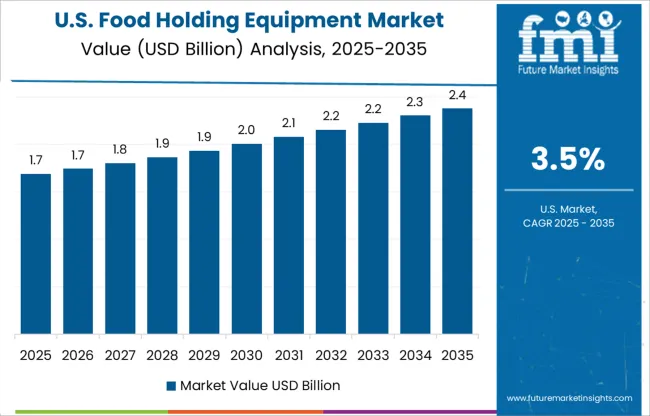
As per FMI, the food holding equipment market in the United States is estimated to be worth about US$ 681.0 million by 2032 and account for nearly 56% of the North American market during the evaluation period. An increasing number of fast food chains and restaurants across the US is set to push the food industry in the country.

Also, the rising supermarket culture in the US would help fuel sales of food-holding equipment in the next ten years. The ability of food-holding equipment to extend the shelf life of food and maintain its optimum temperature is another crucial factor that is projected to aid growth.

Why is the UK Witnessing High Demand for Food Holding Equipment?

“UK-based Companies to Look for Food Equipment to Maintain Overall Temperature”

In the next ten years, it is expected that the UK will experience rapid growth. The food-holding equipment market in the country is anticipated to grow as more people are becoming aware of the advantages of holding food products. They are striving to maintain the overall temperature to preserve numerous food items.

Furthermore, advancements in the food holding sector such as merging all process equipment into one to save human labor and increase sanitation standards, are projected to propel the UK food holding equipment market. The UK is expected to be valued at nearly US$ 491.0 million and accounts for 34% of the Europe food holding equipment market share in the forecast period.

How Will Food Holding Equipment Firms Target the Emerging Nation of China?

“Rising Demand for Poultry Products in China to Spur Sales of Food Warming Tables”

According to FMI, China is set to be worth over US$ 313,5 million and account for 33% of the Asia Pacific food holding equipment market share in the assessment period. Growth is attributed to the ever-increasing population with a wide range of socioeconomic and cultural characteristics. Furthermore, as Western countries have increased their investments in China to develop their food industry, demand for food holding equipment has increased, production levels have advanced, and processing times have decreased.

In addition, market expansion has been aided by population growth and rising awareness about the benefits of consuming high-quality food products. The strong presence of various producers, particularly in China is another crucial factor that would drive the market. Due to the rising consumption of poultry products in urban areas and the urgent need for processed food products, demand for food holding equipment is surging across China.

Category-wise Insights

Who is the Leading End User of Food Holding Equipment?

“Quick Service Restaurants to Demand Kitchen Holding Equipment by the End of 2033”

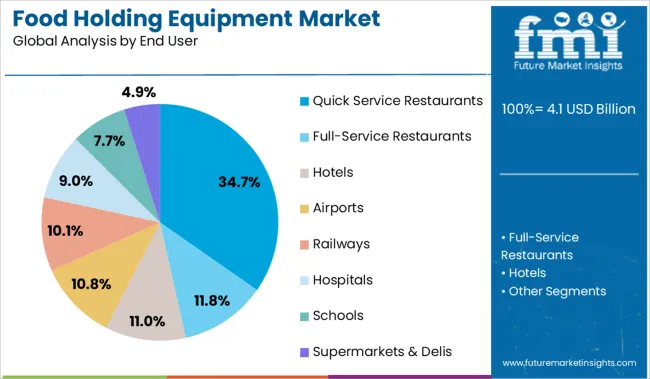
By end user, the quick service restaurants segment is expected to remain at the forefront in the global food holding equipment market in the next ten years. Changing lifestyle of millennials and the rising shift towards convenience food are two of the major factors pushing the segment. Besides, the rising penetration of e-commerce channels, as well as the emergence of various smartphone applications providing home delivery and other quick assistance to enhance user experience to suit the ongoing modernization would bode well for the segment in the global food holding equipment market.
Get the data you need at a Fraction of the cost

Personalize your report by choosing insights you need
and save 40%!

Competitive Landscape

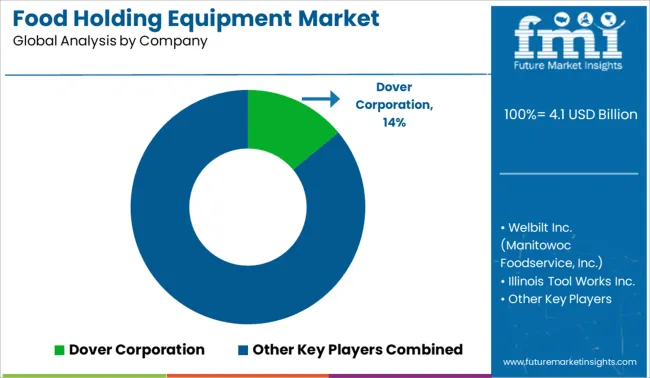
The global food holding equipment market is estimated to be highly fragmented with the presence of a large number of small- and large-scale companies. They are mainly focusing on new product launches to expand their portfolios and cater to a wide range of end-use industries. A few other key players are engaging in mergers and acquisitions, as well as partnerships with leading companies to co-develop novel products.

For instance,

  • Hatco Corporation debuted its heated glass shelves with a foundation for warming food in December 2021.
  • For the distribution of hot-holding platforms in the UK market, Duke Manufacturing Co. Inc. partnered up with Victor Manufacturing Ltd. in September 2021.
  • Bühler and the German research institute DIL Deutsches Institut für Lebensmitteltechnik E.V. joined hands in June 2021 to create innovative manufacturing techniques for wholesome and environmentally friendly food products.
  • In July 2021, Bonduelle USA, Inc., which is a French family-run business that processes and sells canned and frozen veggies in the United States, announced its plans to invest at least US$ 5 Million to increase operations for canned and frozen vegetables at its facility in Lebanon, Pennsylvania.

Scope of the Food Holding Equipment Market Report

Attribute Details
Estimated Market Size (2023) US$ 3,800 Million
Projected Market Valuation (2033) US$ 5,679.2 Million
Value-based CAGR (2023 to 2033) 4.1%
Forecast Period 2023 to 2033
Historical Data Available for 2018 to 2022
Market Analysis Value (US$ Million)
Key Regions Covered
  • North America
  • Latin America
  • Europe
  • Asia Pacific
  • Oceania
  • Middle East & Africa (MEA)
Key Countries Covered
  • The USA
  • Canada
  • Mexico
  • Germany
  • The UK
  • France
  • Italy
  • Spain
  • China
  • Japan
  • India
  • South Korea
  • Australia
  • Brazil
  • Argentina
  • South Africa
  • UAE
Key Segments Covered
  • Product TypeType
  • End User
  • Region
Key Companies Profiled
  • Dover Corporation
  • Welbilt Inc. (Manitowoc Foodservice, Inc.)
  • Illinois Tool Works Inc.
  • Hatco Corporation
  • Ali Group S.r.l.
  • MKN Maschinenfabrik Kurt Neubauer GmbH & Co KG
  • Al-Halabi Refrigeration & Steel LLC
  • Fujimak Corporation
  • Duke Manufacturing
  • Conagra Brands
  • Greencore Group
  • Nestlé S.AOlam International
  • The Kraft Heinz Company
  • PepsiCo Inc.
  • AGRANA Group
  • Bonduelle
  • Dole Food
  • SVZ International B.V.
  • Sahyadri Farms
  • Diana Group S.A.S.
  • RAJE AGRO FOODS PRIVET LIMITED
Report Coverage Market Forecast, Company Share Analysis, Competitive Landscape, DROT Analysis, Market Dynamics and Challenges, and Strategic Growth Initiatives

Food Holding Equipment Market Outlook by Category

By Product Type:

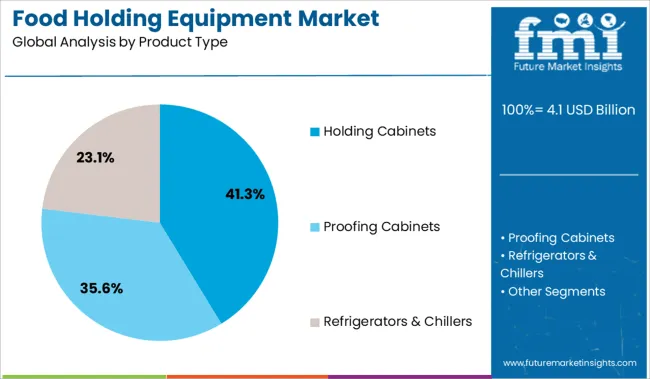
  • Holding Cabinets
  • Proofing Cabinets
  • Refrigerators & Chillers

By End User:

  • Full-Service Restaurants
  • Quick Service Restaurants
  • Hotels
  • Airports
  • Railways
  • Hospitals
  • Schools
  • Supermarkets & Delis

By Region:

  • North America
  • Latin America
  • Europe
  • East Asia
  • South Asia
  • Oceania
  • Middle East & Africa (MEA)

Frequently Asked Questions

How big is the food holding equipment market?

The global food holding equipment market size is expected to be US$ 3,800 Million by the end of 2023.

At what rate is the food holding equipment market expected to rise?

The food holding equipment market is expected to rise at a CAGR of 4.1% in the forecast period.

Which are the major countries driving demand in the food holding equipment market?

The US, China, the UK, Germany, and Mexico are the major countries driving demand in the food holding equipment market.

Who are the top 5 players operating in the food holding equipment market?

Dover Corporation, Welbilt Inc. (Manitowoc Foodservice, Inc.), Illinois Tool Works Inc., and Hatco Corporation Victor Manufacturing Ltd. are expected to be the top players driving the food-holding equipment market.

What is the demand outlook forecast for the food holding equipment market?

The global food holding equipment market is estimated to surpass US$ 5,679.2 Million by the end of 2033.

Table of Content

1. Executive Summary | Food Holding Equipment Market

    1.1. Global Market Outlook

    1.2. Demand-side Trends

    1.3. Supply-side Trends

    1.4. Technology Roadmap Analysis

    1.5. Analysis and Recommendations

2. Market Overview

    2.1. Market Coverage / Taxonomy

    2.2. Market Definition / Scope / Limitations

3. Market Background

    3.1. Market Dynamics

        3.1.1. Drivers

        3.1.2. Restraints

        3.1.3. Opportunity

        3.1.4. Trends

    3.2. Scenario Forecast

        3.2.1. Demand in Optimistic Scenario

        3.2.2. Demand in Likely Scenario

        3.2.3. Demand in Conservative Scenario

    3.3. Product launches & Recent Developments

    3.4. Product Life Cycle Analysis

    3.5. Value Chain Analysis

        3.5.1. Supply Side Participants and their Roles

            3.5.1.1. Producers

            3.5.1.2. Mid-Level Participants (Traders / Agents / Brokers)

            3.5.1.3. Wholesalers and Distributors

        3.5.2. % of Operating Margin Analysis

        3.5.3. List of Raw Material Suppliers

        3.5.4. List of Existing and Potential Buyers

    3.6. Global Food holding Equipment Market - Pricing Analysis

        3.6.1. Price Point Assessment by Region

        3.6.2. Price Point Assessment by Product Type

        3.6.3. Price Forecast till 2033

        3.6.4. Factors affecting Pricing

    3.7. Forecast Factors - Relevance & Impact

    3.8. Regulatory Landscape

        3.8.1. Packaging & Labelling Regulations

        3.8.2. Certifications and Certifying Agency Overview

        3.8.3. Import/Export Policies

    3.9. Regional Parent Market Outlook

    3.10. Consumers Survey Analysis

    3.11. Macro-Economic Factors

    3.12. Product Claims & Nutritional Information scanned by Buyers

4. Global Market Analysis 2018 to 2022 and Forecast, 2023 to 2033

    4.1. Historical Market Size Value (US$ Million) & Volume (MT) Analysis, 2018 to 2022

    4.2. Current and Future Market Size Value (US$ Million) & Volume (MT) Projections, 2023 to 2033

        4.2.1. Y-o-Y Growth Trend Analysis

        4.2.2. Absolute $ Opportunity Analysis

5. Global Market Analysis 2018 to 2022 and Forecast 2023 to 2033, By Product Type

    5.1. Introduction / Key Findings

    5.2. Historical Market Size Value (US$ Million) & Volume (MT) Analysis By Product Type, 2018 to 2022

    5.3. Current and Future Market Size Value (US$ Million) & Volume (MT) Analysis and Forecast By Product Type, 2023 to 2033

        5.3.1. Holding Cabinets

        5.3.2. Proofing Cabinets

        5.3.3. Refrigerators and Chillers

    5.4. Y-o-Y Growth Trend Analysis By Product Type, 2018 to 2022

    5.5. Absolute $ Opportunity Analysis By Product Type, 2023 to 2033

6. Global Market Analysis 2018 to 2022 and Forecast 2023 to 2033, By End User Type

    6.1. Introduction / Key Findings

    6.2. Historical Market Size Value (US$ Million) & Volume (MT) Analysis By End User Type, 2018 to 2022

    6.3. Current and Future Market Size Value (US$ Million) & Volume (MT) Analysis and Forecast By End User Type, 2023 to 2033

        6.3.1. Full-Service Restaurants

        6.3.2. Quick Service Restaurants

        6.3.3. Hotels

        6.3.4. Airports

        6.3.5. Railways

        6.3.6. Hospitals

        6.3.7. Schools

        6.3.8. Supermarkets

        6.3.9. Delis

    6.4. Y-o-Y Growth Trend Analysis By End User Type, 2018 to 2022

    6.5. Absolute $ Opportunity Analysis By End User Type, 2023 to 2033

7. Global Market Analysis 2018 to 2022 and Forecast 2023 to 2033, By Region

    7.1. Introduction

    7.2. Historical Market Size Value (US$ Million) & Volume (MT) Analysis By Region, 2018 to 2022

    7.3. Current Market Size Value (US$ Million) & Volume (MT) Analysis and Forecast By Region, 2023 to 2033

        7.3.1. North America

        7.3.2. Latin America

        7.3.3. Europe

        7.3.4. East Asia

        7.3.5. South Asia

        7.3.6. Oceania

        7.3.7. Middle East & Africa (MEA)

    7.4. Market Attractiveness Analysis By Region

8. North America Market Analysis 2018 to 2022 and Forecast 2023 to 2033, By Country

    8.1. Historical Market Size Value (US$ Million) & Volume (MT) Trend Analysis By Market Taxonomy, 2018 to 2022

    8.2. Market Size Value (US$ Million) & Volume (MT) Forecast By Market Taxonomy, 2023 to 2033

        8.2.1. By Country

            8.2.1.1. The US

            8.2.1.2. Canada

        8.2.2. By Product Type

        8.2.3. By End User Type

    8.3. Market Attractiveness Analysis

        8.3.1. By Country

        8.3.2. By Product Type

        8.3.3. By End User Type

    8.4. Key Takeaways

9. Latin America Market Analysis 2018 to 2022 and Forecast 2023 to 2033, By Country

    9.1. Historical Market Size Value (US$ Million) & Volume (MT) Trend Analysis By Market Taxonomy, 2018 to 2022

    9.2. Market Size Value (US$ Million) & Volume (MT) Forecast By Market Taxonomy, 2023 to 2033

        9.2.1. By Country

            9.2.1.1. Brazil

            9.2.1.2. Mexico

            9.2.1.3. Argentina

            9.2.1.4. Chile

            9.2.1.5. Peru

            9.2.1.6. Rest of Latin America

        9.2.2. By Product Type

        9.2.3. By End User Type

    9.3. Market Attractiveness Analysis

        9.3.1. By Country

        9.3.2. By Product Type

        9.3.3. By End User Type

    9.4. Key Takeaways

10. Europe Market Analysis 2018 to 2022 and Forecast 2023 to 2033, By Country

    10.1. Historical Market Size Value (US$ Million) & Volume (MT) Trend Analysis By Market Taxonomy, 2018 to 2022

    10.2. Market Size Value (US$ Million) & Volume (MT) Forecast By Market Taxonomy, 2023 to 2033

        10.2.1. By Country

            10.2.1.1. Germany

            10.2.1.2. Italy

            10.2.1.3. France

            10.2.1.4. The UK

            10.2.1.5. Spain

            10.2.1.6. Russia

            10.2.1.7. BENELUX

            10.2.1.8. Poland

            10.2.1.9. Nordic Countries

            10.2.1.10. Rest of Europe

        10.2.2. By Product Type

        10.2.3. By End User Type

    10.3. Market Attractiveness Analysis

        10.3.1. By Country

        10.3.2. By Product Type

        10.3.3. By End User Type

    10.4. Key Takeaways

11. East Asia Market Analysis 2018 to 2022 and Forecast 2023 to 2033, By Country

    11.1. Historical Market Size Value (US$ Million) & Volume (MT) Trend Analysis By Market Taxonomy, 2018 to 2022

    11.2. Market Size Value (US$ Million) & Volume (MT) Forecast By Market Taxonomy, 2023 to 2033

        11.2.1. By Country

            11.2.1.1. China

            11.2.1.2. Japan

            11.2.1.3. South Korea

        11.2.2. By Product Type

        11.2.3. By End User Type

    11.3. Market Attractiveness Analysis

        11.3.1. By Country

        11.3.2. By Product Type

        11.3.3. By End User Type

    11.4. Key Takeaways

12. South Asia Market Analysis 2018 to 2022 and Forecast 2023 to 2033, By Country

    12.1. Historical Market Size Value (US$ Million) & Volume (MT) Trend Analysis By Market Taxonomy, 2018 to 2022

    12.2. Market Size Value (US$ Million) & Volume (MT) Forecast By Market Taxonomy, 2023 to 2033

        12.2.1. By Country

            12.2.1.1. India

            12.2.1.2. Thailand

            12.2.1.3. Malaysia

            12.2.1.4. Indonesia

            12.2.1.5. Rest of South Asia

        12.2.2. By Product Type

        12.2.3. By End User Type

    12.3. Market Attractiveness Analysis

        12.3.1. By Country

        12.3.2. By Product Type

        12.3.3. By End User Type

    12.4. Key Takeaways

13. Oceania Market Analysis 2018 to 2022 and Forecast 2023 to 2033, By Country

    13.1. Historical Market Size Value (US$ Million) & Volume (MT) Trend Analysis By Market Taxonomy, 2018 to 2022

    13.2. Market Size Value (US$ Million) & Volume (MT) Forecast By Market Taxonomy, 2023 to 2033

        13.2.1. By Country

            13.2.1.1. Australia

            13.2.1.2. New Zealand

        13.2.2. By Product Type

        13.2.3. By End User Type

    13.3. Market Attractiveness Analysis

        13.3.1. By Country

        13.3.2. By Product Type

        13.3.3. By End User Type

    13.4. Key Takeaways

14. MEA Market Analysis 2018 to 2022 and Forecast 2023 to 2033, By Country

    14.1. Historical Market Size Value (US$ Million) & Volume (MT) Trend Analysis By Market Taxonomy, 2018 to 2022

    14.2. Market Size Value (US$ Million) & Volume (MT) Forecast By Market Taxonomy, 2023 to 2033

        14.2.1. By Country

            14.2.1.1. GCC Countries

            14.2.1.2. South Africa

            14.2.1.3. Central Africa

            14.2.1.4. North Africa

        14.2.2. By Product Type

        14.2.3. By End User Type

    14.3. Market Attractiveness Analysis

        14.3.1. By Country

        14.3.2. By Product Type

        14.3.3. By End User Type

    14.4. Key Takeaways

15. Key Countries Market Analysis

    15.1. The US

        15.1.1. Pricing Analysis

        15.1.2. Market Share Analysis, 2022

            15.1.2.1. By Product Type

            15.1.2.2. By End User Type

    15.2. Canada

        15.2.1. Pricing Analysis

        15.2.2. Market Share Analysis, 2022

            15.2.2.1. By Product Type

            15.2.2.2. By End User Type

    15.3. Brazil

        15.3.1. Pricing Analysis

        15.3.2. Market Share Analysis, 2022

            15.3.2.1. By Product Type

            15.3.2.2. By End User Type

    15.4. Mexico

        15.4.1. Pricing Analysis

        15.4.2. Market Share Analysis, 2022

            15.4.2.1. By Product Type

            15.4.2.2. By End User Type

    15.5. Argentina

        15.5.1. Pricing Analysis

        15.5.2. Market Share Analysis, 2022

            15.5.2.1. By Product Type

            15.5.2.2. By End User Type

    15.6. Chile

        15.6.1. Pricing Analysis

        15.6.2. Market Share Analysis, 2022

            15.6.2.1. By Product Type

            15.6.2.2. By End User Type

    15.7. Peru

        15.7.1. Pricing Analysis

        15.7.2. Market Share Analysis, 2022

            15.7.2.1. By Product Type

            15.7.2.2. By End User Type

    15.8. Germany

        15.8.1. Pricing Analysis

        15.8.2. Market Share Analysis, 2022

            15.8.2.1. By Product Type

            15.8.2.2. By End User Type

    15.9. Italy

        15.9.1. Pricing Analysis

        15.9.2. Market Share Analysis, 2022

            15.9.2.1. By Product Type

            15.9.2.2. By End User Type

    15.10. France

        15.10.1. Pricing Analysis

        15.10.2. Market Share Analysis, 2022

            15.10.2.1. By Product Type

            15.10.2.2. By End User Type

    15.11. Spain

        15.11.1. Pricing Analysis

        15.11.2. Market Share Analysis, 2022

            15.11.2.1. By Product Type

            15.11.2.2. By End User Type

    15.12. The UK

        15.12.1. Pricing Analysis

        15.12.2. Market Share Analysis, 2022

            15.12.2.1. By Product Type

            15.12.2.2. By End User Type

    15.13. Russia

        15.13.1. Pricing Analysis

        15.13.2. Market Share Analysis, 2022

            15.13.2.1. By Product Type

            15.13.2.2. By End User Type

    15.14. Poland

        15.14.1. Pricing Analysis

        15.14.2. Market Share Analysis, 2022

            15.14.2.1. By Product Type

            15.14.2.2. By End User Type

    15.15. BENELUX

        15.15.1. Pricing Analysis

        15.15.2. Market Share Analysis, 2022

            15.15.2.1. By Product Type

            15.15.2.2. By End User Type

    15.16. Nordic Countries

        15.16.1. Pricing Analysis

        15.16.2. Market Share Analysis, 2022

            15.16.2.1. By Product Type

            15.16.2.2. By End User Type

    15.17. China

        15.17.1. Pricing Analysis

        15.17.2. Market Share Analysis, 2022

            15.17.2.1. By Product Type

            15.17.2.2. By End User Type

    15.18. Japan

        15.18.1. Pricing Analysis

        15.18.2. Market Share Analysis, 2022

            15.18.2.1. By Product Type

            15.18.2.2. By End User Type

    15.19. South Korea

        15.19.1. Pricing Analysis

        15.19.2. Market Share Analysis, 2022

            15.19.2.1. By Product Type

            15.19.2.2. By End User Type

    15.20. India

        15.20.1. Pricing Analysis

        15.20.2. Market Share Analysis, 2022

            15.20.2.1. By Product Type

            15.20.2.2. By End User Type

    15.21. Thailand

        15.21.1. Pricing Analysis

        15.21.2. Market Share Analysis, 2022

            15.21.2.1. By Product Type

            15.21.2.2. By End User Type

    15.22. Indonesia

        15.22.1. Pricing Analysis

        15.22.2. Market Share Analysis, 2022

            15.22.2.1. By Product Type

            15.22.2.2. By End User Type

    15.23. Malaysia

        15.23.1. Pricing Analysis

        15.23.2. Market Share Analysis, 2022

            15.23.2.1. By Product Type

            15.23.2.2. By End User Type

    15.24. Singapore

        15.24.1. Pricing Analysis

        15.24.2. Market Share Analysis, 2022

            15.24.2.1. By Product Type

            15.24.2.2. By End User Type

    15.25. GCC Countries

        15.25.1. Pricing Analysis

        15.25.2. Market Share Analysis, 2022

            15.25.2.1. By Product Type

            15.25.2.2. By End User Type

    15.26. South Africa

        15.26.1. Pricing Analysis

        15.26.2. Market Share Analysis, 2022

            15.26.2.1. By Product Type

            15.26.2.2. By End User Type

    15.27. Central Africa

        15.27.1. Pricing Analysis

        15.27.2. Market Share Analysis, 2022

            15.27.2.1. By Product Type

            15.27.2.2. By End User Type

    15.28. North Africa

        15.28.1. Pricing Analysis

        15.28.2. Market Share Analysis, 2022

            15.28.2.1. By Product Type

            15.28.2.2. By End User Type

16. Market Structure Analysis

    16.1. Competition Dashboard

    16.2. Competition Benchmarking

    16.3. Market Share Analysis of Top Players

        16.3.1. By Regional

        16.3.2. By Product Type

        16.3.3. By End User Type

17. Competition Analysis

    17.1. Competition Deep Dive

        17.1.1. Dover Corporation

            17.1.1.1. Overview

            17.1.1.2. Product Portfolio

            17.1.1.3. Profitability by Market Segments

            17.1.1.4. Sales Footprint

            17.1.1.5. Strategy Overview

                17.1.1.5.1. Marketing Strategy

                17.1.1.5.2. Product Strategy

                17.1.1.5.3. Channel Strategy

        17.1.2. Welbilt Inc.( Manitowoc Foodservice, Inc.)

            17.1.2.1. Overview

            17.1.2.2. Product Portfolio

            17.1.2.3. Profitability by Market Segments

            17.1.2.4. Sales Footprint

            17.1.2.5. Strategy Overview

                17.1.2.5.1. Marketing Strategy

                17.1.2.5.2. Product Strategy

                17.1.2.5.3. Channel Strategy

        17.1.3. Illinois Tool Works Inc.

            17.1.3.1. Overview

            17.1.3.2. Product Portfolio

            17.1.3.3. Profitability by Market Segments

            17.1.3.4. Sales Footprint

            17.1.3.5. Strategy Overview

                17.1.3.5.1. Marketing Strategy

                17.1.3.5.2. Product Strategy

                17.1.3.5.3. Channel Strategy

        17.1.4. Hatco Corporation

            17.1.4.1. Overview

            17.1.4.2. Product Portfolio

            17.1.4.3. Profitability by Market Segments

            17.1.4.4. Sales Footprint

            17.1.4.5. Strategy Overview

                17.1.4.5.1. Marketing Strategy

                17.1.4.5.2. Product Strategy

                17.1.4.5.3. Channel Strategy

        17.1.5. Victor Manufacturing Ltd.

            17.1.5.1. Overview

            17.1.5.2. Product Portfolio

            17.1.5.3. Profitability by Market Segments

            17.1.5.4. Sales Footprint

            17.1.5.5. Strategy Overview

                17.1.5.5.1. Marketing Strategy

                17.1.5.5.2. Product Strategy

                17.1.5.5.3. Channel Strategy

        17.1.6. Ali Group S.r.l.

            17.1.6.1. Overview

            17.1.6.2. Product Portfolio

            17.1.6.3. Profitability by Market Segments

            17.1.6.4. Sales Footprint

            17.1.6.5. Strategy Overview

                17.1.6.5.1. Marketing Strategy

                17.1.6.5.2. Product Strategy

                17.1.6.5.3. Channel Strategy

        17.1.7. MKN Maschinenfabrik Kurt Neubauer GmbH & Co KG

            17.1.7.1. Overview

            17.1.7.2. Product Portfolio

            17.1.7.3. Profitability by Market Segments

            17.1.7.4. Sales Footprint

            17.1.7.5. Strategy Overview

                17.1.7.5.1. Marketing Strategy

                17.1.7.5.2. Product Strategy

                17.1.7.5.3. Channel Strategy

        17.1.8. Al-Halabi Refrigeration & Steel LLC

            17.1.8.1. Overview

            17.1.8.2. Product Portfolio

            17.1.8.3. Profitability by Market Segments

            17.1.8.4. Sales Footprint

            17.1.8.5. Strategy Overview

                17.1.8.5.1. Marketing Strategy

                17.1.8.5.2. Product Strategy

                17.1.8.5.3. Channel Strategy

        17.1.9. Fujimak Corporation

            17.1.9.1. Overview

            17.1.9.2. Product Portfolio

            17.1.9.3. Profitability by Market Segments

            17.1.9.4. Sales Footprint

            17.1.9.5. Strategy Overview

                17.1.9.5.1. Marketing Strategy

                17.1.9.5.2. Product Strategy

                17.1.9.5.3. Channel Strategy

        17.1.10. Duke Manufacturing

            17.1.10.1. Overview

            17.1.10.2. Product Portfolio

            17.1.10.3. Profitability by Market Segments

            17.1.10.4. Sales Footprint

            17.1.10.5. Strategy Overview

                17.1.10.5.1. Marketing Strategy

                17.1.10.5.2. Product Strategy

                17.1.10.5.3. Channel Strategy

        17.1.11. Conagra Brands

            17.1.11.1. Overview

            17.1.11.2. Product Portfolio

            17.1.11.3. Profitability by Market Segments

            17.1.11.4. Sales Footprint

            17.1.11.5. Strategy Overview

                17.1.11.5.1. Marketing Strategy

                17.1.11.5.2. Product Strategy

                17.1.11.5.3. Channel Strategy

        17.1.12. Greencore Group

            17.1.12.1. Overview

            17.1.12.2. Product Portfolio

            17.1.12.3. Profitability by Market Segments

            17.1.12.4. Sales Footprint

            17.1.12.5. Strategy Overview

                17.1.12.5.1. Marketing Strategy

                17.1.12.5.2. Product Strategy

                17.1.12.5.3. Channel Strategy

        17.1.13. Nestlé S.A

            17.1.13.1. Overview

            17.1.13.2. Product Portfolio

            17.1.13.3. Profitability by Market Segments

            17.1.13.4. Sales Footprint

            17.1.13.5. Strategy Overview

                17.1.13.5.1. Marketing Strategy

                17.1.13.5.2. Product Strategy

                17.1.13.5.3. Channel Strategy

        17.1.14. Others( on demand)

            17.1.14.1. Overview

            17.1.14.2. Product Portfolio

            17.1.14.3. Profitability by Market Segments

            17.1.14.4. Sales Footprint

            17.1.14.5. Strategy Overview

                17.1.14.5.1. Marketing Strategy

                17.1.14.5.2. Product Strategy

                17.1.14.5.3. Channel Strategy

18. Assumptions & Acronyms Used

19. Research Methodology

List of Tables

Table 1: Global Market Value (US$ Million) Forecast by Region, 2018 to 2033

Table 2: Global Market Volume (MT) Forecast by Region, 2018 to 2033

Table 3: Global Market Value (US$ Million) Forecast by Product Type, 2018 to 2033

Table 4: Global Market Volume (MT) Forecast by Product Type, 2018 to 2033

Table 5: Global Market Value (US$ Million) Forecast by End User Type, 2018 to 2033

Table 6: Global Market Volume (MT) Forecast by End User Type, 2018 to 2033

Table 7: North America Market Value (US$ Million) Forecast by Country, 2018 to 2033

Table 8: North America Market Volume (MT) Forecast by Country, 2018 to 2033

Table 9: North America Market Value (US$ Million) Forecast by Product Type, 2018 to 2033

Table 10: North America Market Volume (MT) Forecast by Product Type, 2018 to 2033

Table 11: North America Market Value (US$ Million) Forecast by End User Type, 2018 to 2033

Table 12: North America Market Volume (MT) Forecast by End User Type, 2018 to 2033

Table 13: Latin America Market Value (US$ Million) Forecast by Country, 2018 to 2033

Table 14: Latin America Market Volume (MT) Forecast by Country, 2018 to 2033

Table 15: Latin America Market Value (US$ Million) Forecast by Product Type, 2018 to 2033

Table 16: Latin America Market Volume (MT) Forecast by Product Type, 2018 to 2033

Table 17: Latin America Market Value (US$ Million) Forecast by End User Type, 2018 to 2033

Table 18: Latin America Market Volume (MT) Forecast by End User Type, 2018 to 2033

Table 19: Europe Market Value (US$ Million) Forecast by Country, 2018 to 2033

Table 20: Europe Market Volume (MT) Forecast by Country, 2018 to 2033

Table 21: Europe Market Value (US$ Million) Forecast by Product Type, 2018 to 2033

Table 22: Europe Market Volume (MT) Forecast by Product Type, 2018 to 2033

Table 23: Europe Market Value (US$ Million) Forecast by End User Type, 2018 to 2033

Table 24: Europe Market Volume (MT) Forecast by End User Type, 2018 to 2033

Table 25: East Asia Market Value (US$ Million) Forecast by Country, 2018 to 2033

Table 26: East Asia Market Volume (MT) Forecast by Country, 2018 to 2033

Table 27: East Asia Market Value (US$ Million) Forecast by Product Type, 2018 to 2033

Table 28: East Asia Market Volume (MT) Forecast by Product Type, 2018 to 2033

Table 29: East Asia Market Value (US$ Million) Forecast by End User Type, 2018 to 2033

Table 30: East Asia Market Volume (MT) Forecast by End User Type, 2018 to 2033

Table 31: South Asia Market Value (US$ Million) Forecast by Country, 2018 to 2033

Table 32: South Asia Market Volume (MT) Forecast by Country, 2018 to 2033

Table 33: South Asia Market Value (US$ Million) Forecast by Product Type, 2018 to 2033

Table 34: South Asia Market Volume (MT) Forecast by Product Type, 2018 to 2033

Table 35: South Asia Market Value (US$ Million) Forecast by End User Type, 2018 to 2033

Table 36: South Asia Market Volume (MT) Forecast by End User Type, 2018 to 2033

Table 37: Oceania Market Value (US$ Million) Forecast by Country, 2018 to 2033

Table 38: Oceania Market Volume (MT) Forecast by Country, 2018 to 2033

Table 39: Oceania Market Value (US$ Million) Forecast by Product Type, 2018 to 2033

Table 40: Oceania Market Volume (MT) Forecast by Product Type, 2018 to 2033

Table 41: Oceania Market Value (US$ Million) Forecast by End User Type, 2018 to 2033

Table 42: Oceania Market Volume (MT) Forecast by End User Type, 2018 to 2033

Table 43: MEA Market Value (US$ Million) Forecast by Country, 2018 to 2033

Table 44: MEA Market Volume (MT) Forecast by Country, 2018 to 2033

Table 45: MEA Market Value (US$ Million) Forecast by Product Type, 2018 to 2033

Table 46: MEA Market Volume (MT) Forecast by Product Type, 2018 to 2033

Table 47: MEA Market Value (US$ Million) Forecast by End User Type, 2018 to 2033

Table 48: MEA Market Volume (MT) Forecast by End User Type, 2018 to 2033

List of Charts

Figure 1: Global Market Value (US$ Million) by Product Type, 2023 to 2033

Figure 2: Global Market Value (US$ Million) by End User Type, 2023 to 2033

Figure 3: Global Market Value (US$ Million) by Region, 2023 to 2033

Figure 4: Global Market Value (US$ Million) Analysis by Region, 2018 to 2033

Figure 5: Global Market Volume (MT) Analysis by Region, 2018 to 2033

Figure 6: Global Market Value Share (%) and BPS Analysis by Region, 2023 to 2033

Figure 7: Global Market Y-o-Y Growth (%) Projections by Region, 2023 to 2033

Figure 8: Global Market Value (US$ Million) Analysis by Product Type, 2018 to 2033

Figure 9: Global Market Volume (MT) Analysis by Product Type, 2018 to 2033

Figure 10: Global Market Value Share (%) and BPS Analysis by Product Type, 2023 to 2033

Figure 11: Global Market Y-o-Y Growth (%) Projections by Product Type, 2023 to 2033

Figure 12: Global Market Value (US$ Million) Analysis by End User Type, 2018 to 2033

Figure 13: Global Market Volume (MT) Analysis by End User Type, 2018 to 2033

Figure 14: Global Market Value Share (%) and BPS Analysis by End User Type, 2023 to 2033

Figure 15: Global Market Y-o-Y Growth (%) Projections by End User Type, 2023 to 2033

Figure 16: Global Market Attractiveness by Product Type, 2023 to 2033

Figure 17: Global Market Attractiveness by End User Type, 2023 to 2033

Figure 18: Global Market Attractiveness by Region, 2023 to 2033

Figure 19: North America Market Value (US$ Million) by Product Type, 2023 to 2033

Figure 20: North America Market Value (US$ Million) by End User Type, 2023 to 2033

Figure 21: North America Market Value (US$ Million) by Country, 2023 to 2033

Figure 22: North America Market Value (US$ Million) Analysis by Country, 2018 to 2033

Figure 23: North America Market Volume (MT) Analysis by Country, 2018 to 2033

Figure 24: North America Market Value Share (%) and BPS Analysis by Country, 2023 to 2033

Figure 25: North America Market Y-o-Y Growth (%) Projections by Country, 2023 to 2033

Figure 26: North America Market Value (US$ Million) Analysis by Product Type, 2018 to 2033

Figure 27: North America Market Volume (MT) Analysis by Product Type, 2018 to 2033

Figure 28: North America Market Value Share (%) and BPS Analysis by Product Type, 2023 to 2033

Figure 29: North America Market Y-o-Y Growth (%) Projections by Product Type, 2023 to 2033

Figure 30: North America Market Value (US$ Million) Analysis by End User Type, 2018 to 2033

Figure 31: North America Market Volume (MT) Analysis by End User Type, 2018 to 2033

Figure 32: North America Market Value Share (%) and BPS Analysis by End User Type, 2023 to 2033

Figure 33: North America Market Y-o-Y Growth (%) Projections by End User Type, 2023 to 2033

Figure 34: North America Market Attractiveness by Product Type, 2023 to 2033

Figure 35: North America Market Attractiveness by End User Type, 2023 to 2033

Figure 36: North America Market Attractiveness by Country, 2023 to 2033

Figure 37: Latin America Market Value (US$ Million) by Product Type, 2023 to 2033

Figure 38: Latin America Market Value (US$ Million) by End User Type, 2023 to 2033

Figure 39: Latin America Market Value (US$ Million) by Country, 2023 to 2033

Figure 40: Latin America Market Value (US$ Million) Analysis by Country, 2018 to 2033

Figure 41: Latin America Market Volume (MT) Analysis by Country, 2018 to 2033

Figure 42: Latin America Market Value Share (%) and BPS Analysis by Country, 2023 to 2033

Figure 43: Latin America Market Y-o-Y Growth (%) Projections by Country, 2023 to 2033

Figure 44: Latin America Market Value (US$ Million) Analysis by Product Type, 2018 to 2033

Figure 45: Latin America Market Volume (MT) Analysis by Product Type, 2018 to 2033

Figure 46: Latin America Market Value Share (%) and BPS Analysis by Product Type, 2023 to 2033

Figure 47: Latin America Market Y-o-Y Growth (%) Projections by Product Type, 2023 to 2033

Figure 48: Latin America Market Value (US$ Million) Analysis by End User Type, 2018 to 2033

Figure 49: Latin America Market Volume (MT) Analysis by End User Type, 2018 to 2033

Figure 50: Latin America Market Value Share (%) and BPS Analysis by End User Type, 2023 to 2033

Figure 51: Latin America Market Y-o-Y Growth (%) Projections by End User Type, 2023 to 2033

Figure 52: Latin America Market Attractiveness by Product Type, 2023 to 2033

Figure 53: Latin America Market Attractiveness by End User Type, 2023 to 2033

Figure 54: Latin America Market Attractiveness by Country, 2023 to 2033

Figure 55: Europe Market Value (US$ Million) by Product Type, 2023 to 2033

Figure 56: Europe Market Value (US$ Million) by End User Type, 2023 to 2033

Figure 57: Europe Market Value (US$ Million) by Country, 2023 to 2033

Figure 58: Europe Market Value (US$ Million) Analysis by Country, 2018 to 2033

Figure 59: Europe Market Volume (MT) Analysis by Country, 2018 to 2033

Figure 60: Europe Market Value Share (%) and BPS Analysis by Country, 2023 to 2033

Figure 61: Europe Market Y-o-Y Growth (%) Projections by Country, 2023 to 2033

Figure 62: Europe Market Value (US$ Million) Analysis by Product Type, 2018 to 2033

Figure 63: Europe Market Volume (MT) Analysis by Product Type, 2018 to 2033

Figure 64: Europe Market Value Share (%) and BPS Analysis by Product Type, 2023 to 2033

Figure 65: Europe Market Y-o-Y Growth (%) Projections by Product Type, 2023 to 2033

Figure 66: Europe Market Value (US$ Million) Analysis by End User Type, 2018 to 2033

Figure 67: Europe Market Volume (MT) Analysis by End User Type, 2018 to 2033

Figure 68: Europe Market Value Share (%) and BPS Analysis by End User Type, 2023 to 2033

Figure 69: Europe Market Y-o-Y Growth (%) Projections by End User Type, 2023 to 2033

Figure 70: Europe Market Attractiveness by Product Type, 2023 to 2033

Figure 71: Europe Market Attractiveness by End User Type, 2023 to 2033

Figure 72: Europe Market Attractiveness by Country, 2023 to 2033

Figure 73: East Asia Market Value (US$ Million) by Product Type, 2023 to 2033

Figure 74: East Asia Market Value (US$ Million) by End User Type, 2023 to 2033

Figure 75: East Asia Market Value (US$ Million) by Country, 2023 to 2033

Figure 76: East Asia Market Value (US$ Million) Analysis by Country, 2018 to 2033

Figure 77: East Asia Market Volume (MT) Analysis by Country, 2018 to 2033

Figure 78: East Asia Market Value Share (%) and BPS Analysis by Country, 2023 to 2033

Figure 79: East Asia Market Y-o-Y Growth (%) Projections by Country, 2023 to 2033

Figure 80: East Asia Market Value (US$ Million) Analysis by Product Type, 2018 to 2033

Figure 81: East Asia Market Volume (MT) Analysis by Product Type, 2018 to 2033

Figure 82: East Asia Market Value Share (%) and BPS Analysis by Product Type, 2023 to 2033

Figure 83: East Asia Market Y-o-Y Growth (%) Projections by Product Type, 2023 to 2033

Figure 84: East Asia Market Value (US$ Million) Analysis by End User Type, 2018 to 2033

Figure 85: East Asia Market Volume (MT) Analysis by End User Type, 2018 to 2033

Figure 86: East Asia Market Value Share (%) and BPS Analysis by End User Type, 2023 to 2033

Figure 87: East Asia Market Y-o-Y Growth (%) Projections by End User Type, 2023 to 2033

Figure 88: East Asia Market Attractiveness by Product Type, 2023 to 2033

Figure 89: East Asia Market Attractiveness by End User Type, 2023 to 2033

Figure 90: East Asia Market Attractiveness by Country, 2023 to 2033

Figure 91: South Asia Market Value (US$ Million) by Product Type, 2023 to 2033

Figure 92: South Asia Market Value (US$ Million) by End User Type, 2023 to 2033

Figure 93: South Asia Market Value (US$ Million) by Country, 2023 to 2033

Figure 94: South Asia Market Value (US$ Million) Analysis by Country, 2018 to 2033

Figure 95: South Asia Market Volume (MT) Analysis by Country, 2018 to 2033

Figure 96: South Asia Market Value Share (%) and BPS Analysis by Country, 2023 to 2033

Figure 97: South Asia Market Y-o-Y Growth (%) Projections by Country, 2023 to 2033

Figure 98: South Asia Market Value (US$ Million) Analysis by Product Type, 2018 to 2033

Figure 99: South Asia Market Volume (MT) Analysis by Product Type, 2018 to 2033

Figure 100: South Asia Market Value Share (%) and BPS Analysis by Product Type, 2023 to 2033

Figure 101: South Asia Market Y-o-Y Growth (%) Projections by Product Type, 2023 to 2033

Figure 102: South Asia Market Value (US$ Million) Analysis by End User Type, 2018 to 2033

Figure 103: South Asia Market Volume (MT) Analysis by End User Type, 2018 to 2033

Figure 104: South Asia Market Value Share (%) and BPS Analysis by End User Type, 2023 to 2033

Figure 105: South Asia Market Y-o-Y Growth (%) Projections by End User Type, 2023 to 2033

Figure 106: South Asia Market Attractiveness by Product Type, 2023 to 2033

Figure 107: South Asia Market Attractiveness by End User Type, 2023 to 2033

Figure 108: South Asia Market Attractiveness by Country, 2023 to 2033

Figure 109: Oceania Market Value (US$ Million) by Product Type, 2023 to 2033

Figure 110: Oceania Market Value (US$ Million) by End User Type, 2023 to 2033

Figure 111: Oceania Market Value (US$ Million) by Country, 2023 to 2033

Figure 112: Oceania Market Value (US$ Million) Analysis by Country, 2018 to 2033

Figure 113: Oceania Market Volume (MT) Analysis by Country, 2018 to 2033

Figure 114: Oceania Market Value Share (%) and BPS Analysis by Country, 2023 to 2033

Figure 115: Oceania Market Y-o-Y Growth (%) Projections by Country, 2023 to 2033

Figure 116: Oceania Market Value (US$ Million) Analysis by Product Type, 2018 to 2033

Figure 117: Oceania Market Volume (MT) Analysis by Product Type, 2018 to 2033

Figure 118: Oceania Market Value Share (%) and BPS Analysis by Product Type, 2023 to 2033

Figure 119: Oceania Market Y-o-Y Growth (%) Projections by Product Type, 2023 to 2033

Figure 120: Oceania Market Value (US$ Million) Analysis by End User Type, 2018 to 2033

Figure 121: Oceania Market Volume (MT) Analysis by End User Type, 2018 to 2033

Figure 122: Oceania Market Value Share (%) and BPS Analysis by End User Type, 2023 to 2033

Figure 123: Oceania Market Y-o-Y Growth (%) Projections by End User Type, 2023 to 2033

Figure 124: Oceania Market Attractiveness by Product Type, 2023 to 2033

Figure 125: Oceania Market Attractiveness by End User Type, 2023 to 2033

Figure 126: Oceania Market Attractiveness by Country, 2023 to 2033

Figure 127: MEA Market Value (US$ Million) by Product Type, 2023 to 2033

Figure 128: MEA Market Value (US$ Million) by End User Type, 2023 to 2033

Figure 129: MEA Market Value (US$ Million) by Country, 2023 to 2033

Figure 130: MEA Market Value (US$ Million) Analysis by Country, 2018 to 2033

Figure 131: MEA Market Volume (MT) Analysis by Country, 2018 to 2033

Figure 132: MEA Market Value Share (%) and BPS Analysis by Country, 2023 to 2033

Figure 133: MEA Market Y-o-Y Growth (%) Projections by Country, 2023 to 2033

Figure 134: MEA Market Value (US$ Million) Analysis by Product Type, 2018 to 2033

Figure 135: MEA Market Volume (MT) Analysis by Product Type, 2018 to 2033

Figure 136: MEA Market Value Share (%) and BPS Analysis by Product Type, 2023 to 2033

Figure 137: MEA Market Y-o-Y Growth (%) Projections by Product Type, 2023 to 2033

Figure 138: MEA Market Value (US$ Million) Analysis by End User Type, 2018 to 2033

Figure 139: MEA Market Volume (MT) Analysis by End User Type, 2018 to 2033

Figure 140: MEA Market Value Share (%) and BPS Analysis by End User Type, 2023 to 2033

Figure 141: MEA Market Y-o-Y Growth (%) Projections by End User Type, 2023 to 2033

Figure 142: MEA Market Attractiveness by Product Type, 2023 to 2033

Figure 143: MEA Market Attractiveness by End User Type, 2023 to 2033

Figure 144: MEA Market Attractiveness by Country, 2023 to 2033

Explore Process Automation Insights

View Reports

Food Holding Equipment Market