Food Flavor Enhancer Market Size and Share Forecast Outlook 2025 to 2035

The global food flavor enhancer market is projected to grow from USD 9.8 billion in 2025 to USD 17.6 billion by 2035, registering a CAGR of 6%. The market expansion is being driven by increasing consumer demand for clean-label, plant-based, and natural food ingredients.
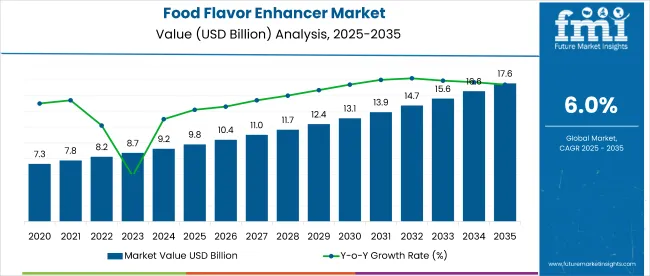
Quick Stats for Food Flavor Enhancer Market

  • Value (2025): USD 9.8 billion
  • Projected Value (2035): USD 17.6 billion
  • Forecast CAGR (2025 to 2035): 6%
  • Leading Segment (2025): Glutamates (38% Market Share)
  • Leading Segment (2035): Plant-Based (44% Share)
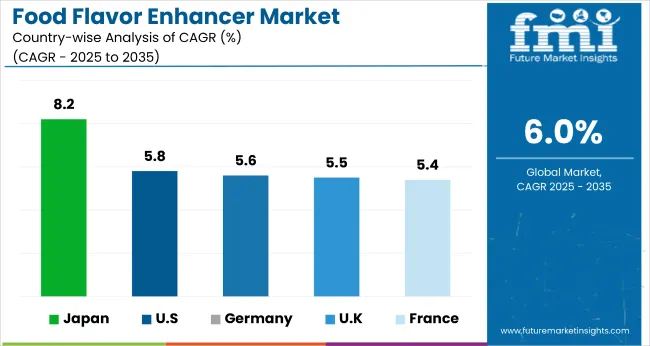
  • Fastest Growing Country(2025): Japan (8.2% CAGR)
  • Top Key Players: Koninklijke DSM N.V., B&G Foods Inc., Sensient Technologies Corporation, Cargill Inc., Givaudan S.A., Ajinomoto Group

Food Flavor Enhancer Market

Metric Value
Industry Size (2025E) USD 9.8 billion
Industry Value (2035F) USD 17.6 billion
CAGR (2025 to 2035) 6%

As awareness about synthetic additives and artificial flavors grows, manufacturers are shifting toward botanical and plant-derived flavor enhancers to meet evolving health-conscious consumer preferences. The market holds 11% share in the flavoring agents market and around 8% in the natural ingredients market, driven by growing demand for clean-label and plant-based solutions.

Within the food additives market, it accounts for nearly 6%, reflecting its integral role in enhancing taste across processed and packaged foods. In the functional food ingredients market, flavor enhancers hold a 4% share, while their contribution to the broader food ingredients market is around 2.5%. As consumer preference shifts toward natural flavors, the market's share in these parent categories is expected to grow steadily through 2035.

Global regulatory frameworks focused on food safety and ingredient transparency play a key role in shaping market trends. Regulatory bodies such as the USA Food and Drug Administration (FDA) and the European Food Safety Authority (EFSA) have emphasized the need for clean-label declarations and stricter oversight of artificial flavor use.

In Asia, countries like Japan and China have promoted standards encouraging the adoption of naturally derived additives. For instance, Japan’s FOSHU (Food for Specified Health Use) regulations support the use of natural and functional food ingredients, while India’s FSSAI mandates clearer labeling and restriction of synthetic additives in packaged food products. These regulations are accelerating the shift toward natural and vegan flavor enhancers.

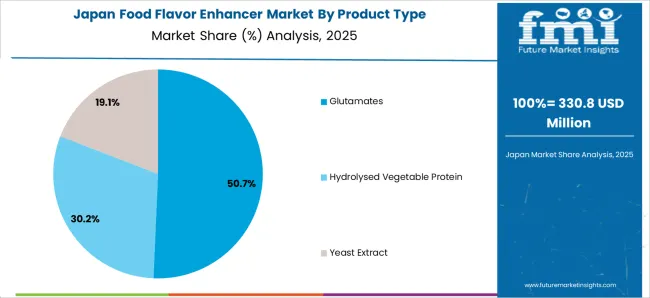
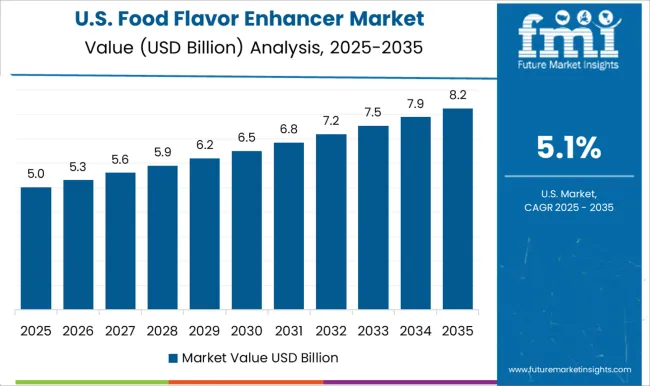
Japan is projected to be the fastest-growing market, expected to expand at a CAGR of 8.2% from 2025 to 2035. Glutamates will lead the product type segment with a 38% market share in 2025, while plant-based flavor enhancers will dominate the source segment with a 44% market share. The USA and UK markets are also expected to grow steadily at CAGRs of 5.8% and 5.5%, respectively. Germany and France will expand at CAGRs of 5.6% and 5.4%, respectively.

Food Flavor Enhancer Market Analysis by Top Investment Segments

The global market is segmented by product type, source, application, and region. By product type, the market is divided into glutamates, hydrolyzed vegetable protein, yeast extract, and others (nucleotide-based enhancers, organic acids, spices, and flavor peptides). In terms of source, the market is categorized into plant-based, yeast, and seaweed.

Based on application, the market is segmented into bakery & confectionery, soups & sauces, meat & seafood, ready meals, dairy products, and beverages. Regionally, the market is divided into North America, Latin America, Europe, Asia Pacific, and the Middle East & Africa.
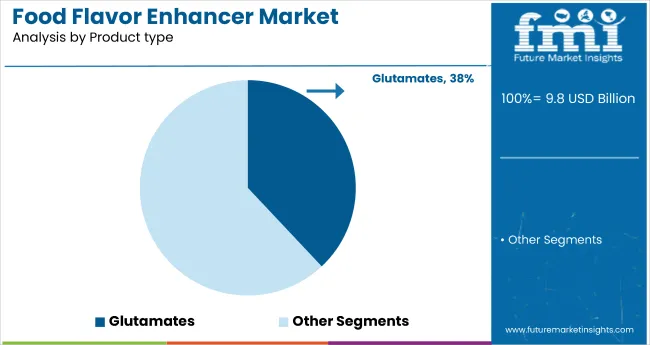
Glutamates to Lead the Product Type Segment with 38% Market Share

Food Flavor Enhancer Market Analysis By Product Type

Glutamates are expected to dominate the product type segment with a 38% market share by 2025. Known for enhancing umami flavor, they are widely used in savory processed foods such as soups, sauces, and ready meals, making them a popular choice among manufacturers for taste enhancement and cost efficiency.
  • Glutamates, particularly monosodium glutamate (MSG), remain highly popular across Asia and processed food manufacturing.
  • Their versatility and cost-effectiveness make them a preferred choice for ready meals and meat-based products.

Plant-Based to Dominate the Source Segment with 44% Market Share in 2025

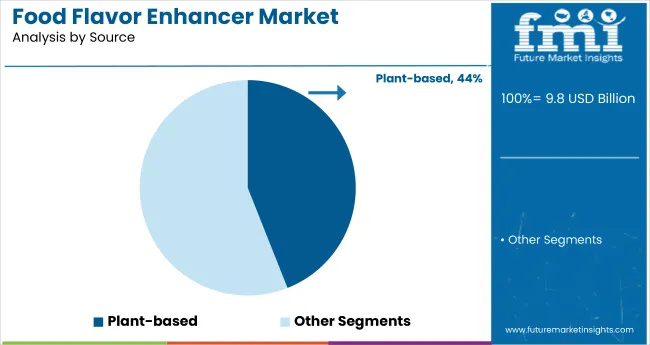
Food Flavor Enhancer Market Analysis By Source

Plant-based flavor enhancers are projected to lead the source segment with a 44% market share in 2025. Growing consumer demand for vegan, natural, and clean-label products is driving this trend. Derived from herbs, vegetables, and plant extracts, these enhancers are increasingly replacing synthetic alternatives in processed and functional food applications.
  • The rising demand for vegan and clean-label foods fuels the use of plant-derived enhancers.
  • Extracts from herbs, vegetables, and fermented plants are increasingly replacing synthetic additives in processed foods.

Soup & Sauces to Lead the Application Segment with 27% Market Share

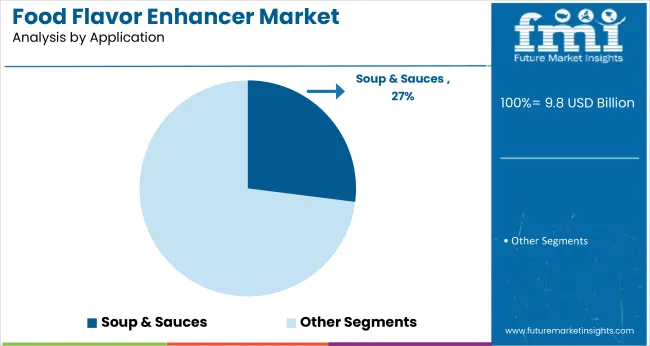
Food Flavor Enhancer Market Analysis By Application

Soups and sauces are expected to dominate the application segment, capturing 27% of the global market share by 2025. The rising demand for convenient meal solutions and enhanced taste profiles is driving the use of flavor enhancers in instant soups, gravies, cooking bases, and ready-to-eat sauce products across regions.

  • The growing popularity of instant soups, gravies, and cooking sauces is driving consistent demand for flavor enhancers.
  • Consumers seek depth of flavor and consistency, leading to greater adoption of enhancers in this category.

Top Food Flavor Enhancer Market Dynamics

The global market is experiencing steady growth, driven by the increasing demand for clean-label, natural, and plant-based ingredients. Flavor enhancers play a vital role in improving taste, especially in reduced-fat, low-sodium, and vegan food products, aligning with evolving consumer health and dietary preferences.

Recent Trends in the Food Flavor Enhancer Market

  • Rising preference for plant-based and vegan flavor enhancers is reshaping product innovation, catering to flexitarian and health-conscious consumer segments.
  • Botanical and fusion flavors, including combinations of herbs, spices, and fruits, are gaining popularity in soups, snacks, and ready meals.

Challenges in the Food Flavor Enhancer Market
  • Health concerns over synthetic additives, such as MSG and disodium inosinate, limit adoption among clean-label focused consumers.
  • Regulatory complexity and global compliance for natural ingredient labeling create barriers for manufacturers expanding into multiple regional markets.

Top Countries Manufacturing, Regulating, and Generating Demand for Food Flavor Enhancers

Country Wise Analysis Of Food Flavor Enhancer Market

Japan momentum in the global market is driven by its traditional emphasis on umami-rich ingredients and advanced food processing technologies. Germany and France continue to show consistent demand, backed by stringent EU food labeling laws and support for natural ingredient development. In contrast, developed economies such as the USA (5.8% CAGR), UK (5.5% CAGR), and Japan (8.2% CAGR) are expected to growsteadily at 0.91-1.37x of the global growth rate.

Japan is the fastest-growing market in the market, supported by strong demand for umami-rich, clean-label ingredients and fermented flavor bases. The USA follows, driven by rising consumption of processed, low-sodium, and plant-based foods. Germany and France show steady growth, backed by regulatory support for natural additives and functional formulations.

The UK records the slowest expansion, with momentum sustained by health-oriented reformulation in ready meals and strong demand from private-label brands. While all five countries are embracing plant-based and yeast-derived enhancers, Japan’s innovation-led growth contrasts with Europe’s regulation-driven market evolution and the United States’ focus on convenience and sodium reduction.

The report covers in-depth analysis of 40+ countries; five top-performing OECD countries are highlighted below.
In-depth Analysis of Food Flavor Enhancer Demand in Japan

The Japan food flavor enhancer market is growing at a CAGR of 8.2% from 2025 to 2035. Growth is fueled by strong domestic demand for umami-rich ingredients and ongoing reformulation in the processed food industry. Japan’s focus on FOSHU-compliant clean-label ingredients and high demand for fermented flavor bases supports expansion. Natural extracts from seaweed, soy, and yeast remain in high demand across instant soups and bento products.
  • Strong demand in soups, noodles, and seafood-based dishes.
  • Innovation in clean-label, fermented flavor formulations.

Growth Outlook for Food Flavor Enhancers in Germany

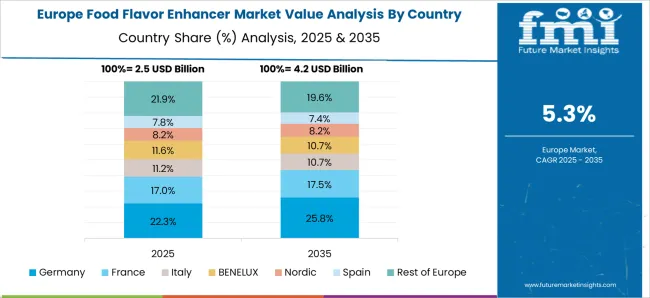
The sales of food flavor enhancers in Germany are expected to expandat 5.6% CAGR during the forecast period. The growth is driven by EU regulatory compliance for natural additives and the shift away from synthetic flavor enhancers. Key applications include dairy, processed meat, and plant-based foods. German manufacturers emphasize ingredient transparency and functional nutrition.

  • Strong preference for plant-based and yeast-derived enhancers.
  • High adoption in vegan and free-from food segments.

Food Flavor Enhancer Demand in France

The French food flavor enhancer market is projected to grow at a 5.4% CAGR during the forecast period. Growth is led by national clean-label and food safety initiatives, with widespread demand in bakery, culinary sauces, and ready meals. Local companies are focusing on natural, organic-certified flavor enhancers.
  • High penetration in artisan and premium bakery segments.
  • Demand driven by government-led sodium reduction programs.

Demand Trajectory for Food Flavor Enhancers in the USA

The USA food flavor enhancer market is projected to grow at 5.8% CAGR from 2025 to 2035, reflecting 0.97x the global pace. Demand is driven by rising consumption of processed and ready-to-eat foods, alongside consumer shift toward low-sodium and fortified food options. Plant-based and yeast-derived flavor enhancers are gaining momentum in soups, sauces, snacks, and convenience meals.

  • Strong growth in plant-based and low-sodium formulations.
  • Focus on MSG alternatives and functional food applications.

Food Flavor Enhancer Trends in the UK

The UK food flavor enhancer revenue is projected to grow at a CAGR of 5.5% from 2025 to 2035, the slowest among the top OECD nations at 0.91 times the global pace. Growth is sustained by Public Health England’s salt reduction targets and demand in meal kits and private-label packaged foods. Clean-label claims and plant-sourced flavor enhancers are increasingly prioritized by major retailers and foodservice providers.
  • Emphasis on health-oriented reformulation in ready meals.
  • Growth in private-label and supermarket-driven flavor innovation.

Leading Food Flavor Enhancer Market Suppliers and Manufacturers

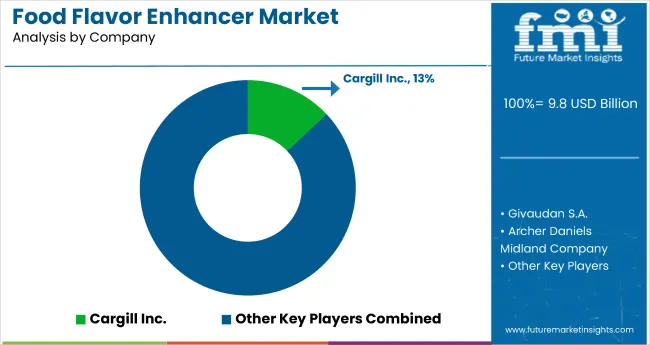
Food Flavor Enhancer Market Analysis By Company

The global market is moderately consolidated, with key players such as Koninklijke DSM N.V., Cargill Inc., Ajinomoto Group, Givaudan S.A., and Kerry Group holding significant market shares. These companies offer a wide portfolio of flavor enhancer solutions tailored to the processed food, beverage, and foodservice industries.

Koninklijke DSM N.V. focuses on natural and plant-based flavor systems, while Cargill Inc. emphasizes sustainability and clean-label ingredients. Ajinomoto Group remains a global leader in glutamate production, particularly monosodium glutamate (MSG), and Givaudan S.A. delivers high-impact flavor enhancers based on botanical and fermented inputs. Kerry Group continues to expand its reach through innovation in taste modulation and sodium-reduction technologies.

Other notable players include B&G Foods Inc., Sensient Technologies Corporation, Archer Daniels Midland Company, A&B Ingredients, International Flavors and Fragrances, Bell Flavors & Fragrances, Scelta Mushrooms B.V., DPO International Sdn. Bhd., and Penta Manufacturing Company, who contribute specialized offerings ranging from yeast extracts to hydrolyzed vegetable proteins and umami-boosting ingredients.

Food Flavor Enhancer Market Report Scope

Report Attributes Details
Market Size (2025) USD 9.8 billion
Projected Market Size (2035) USD 17.6 billion
CAGR (2025 to 2035) 6%
Base Year for Estimation 2024
Historical Period 2020 to 2024
Projections Period 2025 to 2035
Report Parameter USD billion for value/Volume in Metric Tons
Product Types Analyzed Glutamates, Hydrolysed Vegetable Protein, Yeast Extract, Others (Nucleotides, Organic Acids, Enzyme-Modified Enhancers, Peptides)
Source Analyzed Plant-based, Yeast, Seaweed
Application Analyzed Bakery & Confectionery, Soup & Sauces, Meat & Seafood, Ready Meals, Dairy Products, Beverages
Regions Covered North America, Latin America, Western Europe, South Asia, East Asia, Eastern Europe, Middle East & Africa
Countries Covered United States, United Kingdom, Germany, France, Japan, China, India, Brazil, South Korea, Australia and 40+ countries
Key Players Influencing the Market Koninklijke DSM N.V., B&G Foods Inc., Sensient Technologies Corporation, Cargill Inc., Givaudan S.A., Ajinomoto Group, Archer Daniels Midland Company, Kerry Group, A&B Ingredients, International Flavors and Fragrances, Bell Flavors & Fragrances, Scelta Mushrooms B.V., DPO International Sdn . Bhd., and Penta Manufacturing Company.
Additional Attributes Dollar sales by product type, share by source, regional demand growth, clean-label trends, sodium reduction initiatives, competitive benchmarking

Key Segments

By Product Type:

  • Glutamates
  • Hydrolysed Vegetable Protein
  • Yeast Extract

By Source:

  • Plant-based
  • Yeast
  • Seaweed\

By Application:

  • Bakery & Confectionery
  • Soup & Sauces
  • Meat & Seafood
  • Ready Meals
  • Dairy Products
  • Beverages

By Region:

  • North America
  • Latin America
  • Western Europe
  • Eastern Europe
  • East Asia
  • South Asia & Pacific
  • Middle East and Africa

Table of Content

  1. Executive Summary
    • Global Market Outlook
    • Demand-side Trends
    • Supply-side Trends
    • Technology Roadmap Analysis
    • Analysis and Recommendations
  2. Market Overview
    • Market Coverage/Taxonomy
    • Market Definition/Scope/Limitations
  3. Market Background
    • Market Dynamics
      • Drivers
      • Restraints
      • Opportunity
      • Trends
    • Scenario Forecast
      • Demand in Optimistic Scenario
      • Demand in Likely Scenario
      • Demand in Conservative Scenario
    • Opportunity Map Analysis
    • Product Life Cycle Analysis
    • Supply Chain Analysis
      • Supply Side Participants and their Roles
        • Producers
        • Mid-Level Participants (Traders/ Agents/ Brokers)
        • Wholesalers and Distributors
      • Value Added and Value Created at Node in the Supply Chain
      • List of Raw Material Suppliers
      • List of Existing and Potential Buyer’s
    • Investment Feasibility Matrix
    • Value Chain Analysis
      • Profit Margin Analysis
      • Wholesalers and Distributors
      • Retailers
    • PESTLE and Porter’s Analysis
    • Regulatory Landscape
      • By Key Regions
      • By Key Countries
    • Regional Parent Market Outlook
    • Production and Consumption Statistics
    • Import and Export Statistics
  4. Global Market Analysis 2020 to 2024 and Forecast, 2025 to 2035
    • Historical Market Size Value (USD Billion) & Volume (Metric Tons) Analysis, 2020 to 2024
    • Current and Future Market Size Value (USD Billion) & Volume (Metric Tons) Projections, 2025 to 2035
      • Y-o-Y Growth Trend Analysis
      • Absolute $ Opportunity Analysis
  5. Global Market Pricing Analysis 2020 to 2024 and Forecast 2025 to 2035
  6. Global Market Analysis 2020 to 2024 and Forecast 2025 to 2035, By Product Type
    • Introduction/Key Findings
    • Historical Market Size Value (USD Billion) & Volume (Metric Tons) Analysis By Product Type, 2020 to 2024
    • Current and Future Market Size Value (USD Billion) & Volume (Metric Tons) Analysis and Forecast By Product Type, 2025 to 2035
      • Glutamates
      • Hydrolysed Vegetable Protein
      • Yeast Extract
      • Others (Nucleotide-Based Enhancers, Organic Acids, Spices, Flavor Peptides)
    • Y-o-Y Growth Trend Analysis By Product Type, 2020 to 2024
    • Absolute $ Opportunity Analysis By Product Type, 2025 to 2035
  7. Global Market Analysis 2020 to 2024 and Forecast 2025 to 2035, By Source
    • Introduction/Key Findings
    • Historical Market Size Value (USD Billion) & Volume (Metric Tons) Analysis By Source, 2020 to 2024
    • Current and Future Market Size Value (USD Billion) & Volume (Metric Tons) Analysis and Forecast By Source, 2025 to 2035
      • Plant-based
      • Yeast
      • Seaweed
    • Y-o-Y Growth Trend Analysis By Source, 2020 to 2024
    • Absolute $ Opportunity Analysis By Source, 2025 to 2035
  8. Global Market Analysis 2020 to 2024 and Forecast 2025 to 2035, By Application
    • Introduction/Key Findings
    • Historical Market Size Value (USD Billion) & Volume (Metric Tons) Analysis By Application, 2020 to 2024
    • Current and Future Market Size Value (USD Billion) & Volume (Metric Tons) Analysis and Forecast By Application, 2025 to 2035
      • Bakery & Confectionery
      • Soup & Sauces
      • Meat & Seafood
      • Ready Meals
      • Dairy Products
      • Beverages
    • Y-o-Y Growth Trend Analysis By Application, 2020 to 2024
    • Absolute $ Opportunity Analysis By Application, 2025 to 2035
  9. Global Market Analysis 2020 to 2024 and Forecast 2025 to 2035, By Region
    • Introduction
    • Historical Market Size Value (USD Billion) & Volume (Metric Tons) Analysis By Region, 2020 to 2024
    • Current Market Size Value (USD Billion) & Volume (Metric Tons) Analysis and Forecast By Region, 2025 to 2035
      • North America
      • Latin America
      • Western Europe
      • Eastern Europe
      • East Asia
      • South Asia & Pacific
      • Middle East and Africa
    • Market Attractiveness Analysis By Region
  10. North America Market Analysis 2020 to 2024 and Forecast 2025 to 2035, By Country
    • Historical Market Size Value (USD Billion) & Volume (Metric Tons) Trend Analysis By Market Taxonomy, 2020 to 2024
    • Market Size Value (USD Billion) & Volume (Metric Tons) Forecast By Market Taxonomy, 2025 to 2035
      • By Country
        • USA
        • Canada
        • Mexico
      • By Product Type
      • By Source
      • By Application
    • Market Attractiveness Analysis
      • By Country
      • By Product Type
      • By Source
      • By Application
    • Key Takeaways
  11. Latin America Market Analysis 2020 to 2024 and Forecast 2025 to 2035, By Country
    • Historical Market Size Value (USD Billion) & Volume (Metric Tons) Trend Analysis By Market Taxonomy, 2020 to 2024
    • Market Size Value (USD Billion) & Volume (Metric Tons) Forecast By Market Taxonomy, 2025 to 2035
      • By Country
        • Brazil
        • Argentina
        • Rest of LATAM
      • By Product Type
      • By Source
      • By Application
    • Market Attractiveness Analysis
      • By Country
      • By Product Type
      • By Source
      • By Application
    • Key Takeaways
  12. Western Europe Market Analysis 2020 to 2024 and Forecast 2025 to 2035, By Country
    • Historical Market Size Value (USD Billion) & Volume (Metric Tons) Trend Analysis By Market Taxonomy, 2020 to 2024
    • Market Size Value (USD Billion) & Volume (Metric Tons) Forecast By Market Taxonomy, 2025 to 2035
      • By Country
        • Germany
        • Italy
        • France
        • UK
        • Spain
        • BENELUX
        • Nordic
        • Rest of W.Europe
      • By Product Type
      • By Source
      • By Application
    • Market Attractiveness Analysis
      • By Country
      • By Product Type
      • By Source
      • By Application
    • Key Takeaways
  13. Eastern Europe Market Analysis 2020 to 2024 and Forecast 2025 to 2035, By Country
    • Historical Market Size Value (USD Billion) & Volume (Metric Tons) Trend Analysis By Market Taxonomy, 2020 to 2024
    • Market Size Value (USD Billion) & Volume (Metric Tons) Forecast By Market Taxonomy, 2025 to 2035
      • By Country
        • Russia
        • Hungary
        • Poland
        • Balkan & Baltics
        • Rest of E. Europe
      • By Product Type
      • By Source
      • By Application
    • Market Attractiveness Analysis
      • By Country
      • By Product Type
      • By Source
      • By Application
    • Key Takeaways
  14. East Asia Market Analysis 2020 to 2024 and Forecast 2025 to 2035, By Country
    • Historical Market Size Value (USD Billion) & Volume (Metric Tons) Trend Analysis By Market Taxonomy, 2020 to 2024
    • Market Size Value (USD Billion) & Volume (Metric Tons) Forecast By Market Taxonomy, 2025 to 2035
      • By Country
        • China
        • Japan
        • South Korea
      • By Product Type
      • By Source
      • By Application
    • Market Attractiveness Analysis
      • By Country
      • By Product Type
      • By Source
      • By Application
    • Key Takeaways
  15. South Asia & Pacific Market Analysis 2020 to 2024 and Forecast 2025 to 2035, By Country
    • Historical Market Size Value (USD Billion) & Volume (Metric Tons) Trend Analysis By Market Taxonomy, 2020 to 2024
    • Market Size Value (USD Billion) & Volume (Metric Tons) Forecast By Market Taxonomy, 2025 to 2035
      • By Country
        • India
        • Australia & New Zealand
        • ASEAN
        • Rest of SAP
      • By Product Type
      • By Source
      • By Application
    • Market Attractiveness Analysis
      • By Country
      • By Product Type
      • By Source
      • By Application
    • Key Takeaways
  16. Middle East and Africa Market Analysis 2020 to 2024 and Forecast 2025 to 2035, By Country
    • Historical Market Size Value (USD Billion) & Volume (Metric Tons) Trend Analysis By Market Taxonomy, 2020 to 2024
    • Market Size Value (USD Billion) & Volume (Metric Tons) Forecast By Market Taxonomy, 2025 to 2035
      • By Country
        • GCC Countries
        • Northern Africa
        • South Africa
        • Turkiye
        • Rest of MEA
      • By Product Type
      • By Source
      • By Application
    • Market Attractiveness Analysis
      • By Country
      • By Product Type
      • By Source
      • By Application
    • Key Takeaways
  17. Key Countries Market Analysis
    • USA
      • Pricing Analysis
      • Market Share Analysis, 2024
        • By Product Type
        • By Source
        • By Application
    • Canada
      • Pricing Analysis
      • Market Share Analysis, 2024
        • By Product Type
        • By Source
        • By Application
    • Brazil
      • Pricing Analysis
      • Market Share Analysis, 2024
        • By Product Type
        • By Source
        • By Application
    • Mexico
      • Pricing Analysis
      • Market Share Analysis, 2024
        • By Product Type
        • By Source
        • By Application
    • Argentina
      • Pricing Analysis
      • Market Share Analysis, 2024
        • By Product Type
        • By Source
        • By Application
  18. Market Structure Analysis
    • Competition Dashboard
    • Competition Benchmarking
    • Market Share Analysis of Top Players
      • By Regional
      • By Product Type
      • By Source
      • By Application
  19. Competition Analysis
    • Competition Deep Dive
      • Koninklijke DSM N.V.
        • Overview
        • Product Portfolio
        • Profitability by Market Segments (Product/Age /Sales Channel/Region)
        • Sales Footprint
        • Strategy Overview
          • Marketing Strategy
          • Product Strategy
          • Channel Strategy
      • B&G Foods Inc.
        • Overview
        • Product Portfolio
        • Profitability by Market Segments (Product/Age /Sales Channel/Region)
        • Sales Footprint
        • Strategy Overview
          • Marketing Strategy
          • Product Strategy
          • Channel Strategy
      • Sensient Technologies Corporation
        • Overview
        • Product Portfolio
        • Profitability by Market Segments (Product/Age /Sales Channel/Region)
        • Sales Footprint
        • Strategy Overview
          • Marketing Strategy
          • Product Strategy
          • Channel Strategy
      • Cargill Inc.
        • Overview
        • Product Portfolio
        • Profitability by Market Segments (Product/Age /Sales Channel/Region)
        • Sales Footprint
        • Strategy Overview
          • Marketing Strategy
          • Product Strategy
          • Channel Strategy
      • Givaudan S.A.
        • Overview
        • Product Portfolio
        • Profitability by Market Segments (Product/Age /Sales Channel/Region)
        • Sales Footprint
        • Strategy Overview
          • Marketing Strategy
          • Product Strategy
          • Channel Strategy
      • Ajinomoto Group
        • Overview
        • Product Portfolio
        • Profitability by Market Segments (Product/Age /Sales Channel/Region)
        • Sales Footprint
        • Strategy Overview
          • Marketing Strategy
          • Product Strategy
          • Channel Strategy
      • Archer Daniels Midland Company
        • Overview
        • Product Portfolio
        • Profitability by Market Segments (Product/Age /Sales Channel/Region)
        • Sales Footprint
        • Strategy Overview
          • Marketing Strategy
          • Product Strategy
          • Channel Strategy
      • Kerry Group
        • Overview
        • Product Portfolio
        • Profitability by Market Segments (Product/Age /Sales Channel/Region)
        • Sales Footprint
        • Strategy Overview
          • Marketing Strategy
          • Product Strategy
          • Channel Strategy
      • A&B Ingredients
        • Overview
        • Product Portfolio
        • Profitability by Market Segments (Product/Age /Sales Channel/Region)
        • Sales Footprint
        • Strategy Overview
          • Marketing Strategy
          • Product Strategy
          • Channel Strategy
      • International Flavors and Fragrances
        • Overview
        • Product Portfolio
        • Profitability by Market Segments (Product/Age /Sales Channel/Region)
        • Sales Footprint
        • Strategy Overview
          • Marketing Strategy
          • Product Strategy
          • Channel Strategy
      • Bell Flavors & Fragrances
        • Overview
        • Product Portfolio
        • Profitability by Market Segments (Product/Age /Sales Channel/Region)
        • Sales Footprint
        • Strategy Overview
          • Marketing Strategy
          • Product Strategy
          • Channel Strategy
      • Scelta Mushrooms B.V.
        • Overview
        • Product Portfolio
        • Profitability by Market Segments (Product/Age /Sales Channel/Region)
        • Sales Footprint
        • Strategy Overview
          • Marketing Strategy
          • Product Strategy
          • Channel Strategy
      • DPO International Sdn. Bhd.
        • Overview
        • Product Portfolio
        • Profitability by Market Segments (Product/Age /Sales Channel/Region)
        • Sales Footprint
        • Strategy Overview
          • Marketing Strategy
          • Product Strategy
          • Channel Strategy
      • Penta Manufacturing Company
        • Overview
        • Product Portfolio
        • Profitability by Market Segments (Product/Age /Sales Channel/Region)
        • Sales Footprint
        • Strategy Overview
          • Marketing Strategy
          • Product Strategy
          • Channel Strategy
  20. Assumptions & Acronyms Used
  21. Research Methodology

List of Tables

  • Table 1: Global Market Value (USD Billion) Forecast by Region, 2020-2035
  • Table 2: Global Market Volume (Metric Tons) Forecast by Region, 2020-2035
  • Table 3: Global Market Value (USD Billion) Forecast by Product Type, 2020-2035
  • Table 4: Global Market Volume (Metric Tons) Forecast by Product Type, 2020-2035
  • Table 5: Global Market Value (USD Billion) Forecast by Source, 2020-2035
  • Table 6: Global Market Volume (Metric Tons) Forecast by Source, 2020-2035
  • Table 7: Global Market Value (USD Billion) Forecast by Application, 2020-2035
  • Table 8: Global Market Volume (Metric Tons) Forecast by Application, 2020-2035
  • Table 9: North America Market Value (USD Billion) Forecast by Country, 2020-2035
  • Table 10: North America Market Volume (Metric Tons) Forecast by Country, 2020-2035
  • Table 11: North America Market Value (USD Billion) Forecast by Product Type, 2020-2035
  • Table 12: North America Market Volume (Metric Tons) Forecast by Product Type, 2020-2035
  • Table 13: North America Market Value (USD Billion) Forecast by Source, 2020-2035
  • Table 14: North America Market Volume (Metric Tons) Forecast by Source, 2020-2035
  • Table 15: North America Market Value (USD Billion) Forecast by Application, 2020-2035
  • Table 16: North America Market Volume (Metric Tons) Forecast by Application, 2020-2035
  • Table 17: Latin America Market Value (USD Billion) Forecast by Country, 2020-2035
  • Table 18: Latin America Market Volume (Metric Tons) Forecast by Country, 2020-2035
  • Table 19: Latin America Market Value (USD Billion) Forecast by Product Type, 2020-2035
  • Table 20: Latin America Market Volume (Metric Tons) Forecast by Product Type, 2020-2035
  • Table 21: Latin America Market Value (USD Billion) Forecast by Source, 2020-2035
  • Table 22: Latin America Market Volume (Metric Tons) Forecast by Source, 2020-2035
  • Table 23: Latin America Market Value (USD Billion) Forecast by Application, 2020-2035
  • Table 24: Latin America Market Volume (Metric Tons) Forecast by Application, 2020-2035
  • Table 25: Western Europe Market Value (USD Billion) Forecast by Country, 2020-2035
  • Table 26: Western Europe Market Volume (Metric Tons) Forecast by Country, 2020-2035
  • Table 27: Western Europe Market Value (USD Billion) Forecast by Product Type, 2020-2035
  • Table 28: Western Europe Market Volume (Metric Tons) Forecast by Product Type, 2020-2035
  • Table 29: Western Europe Market Value (USD Billion) Forecast by Source, 2020-2035
  • Table 30: Western Europe Market Volume (Metric Tons) Forecast by Source, 2020-2035
  • Table 31: Western Europe Market Value (USD Billion) Forecast by Application, 2020-2035
  • Table 32: Western Europe Market Volume (Metric Tons) Forecast by Application, 2020-2035
  • Table 33: Eastern Europe Market Value (USD Billion) Forecast by Country, 2020-2035
  • Table 34: Eastern Europe Market Volume (Metric Tons) Forecast by Country, 2020-2035
  • Table 35: Eastern Europe Market Value (USD Billion) Forecast by Product Type, 2020-2035
  • Table 36: Eastern Europe Market Volume (Metric Tons) Forecast by Product Type, 2020-2035
  • Table 37: Eastern Europe Market Value (USD Billion) Forecast by Source, 2020-2035
  • Table 38: Eastern Europe Market Volume (Metric Tons) Forecast by Source, 2020-2035
  • Table 39: Eastern Europe Market Value (USD Billion) Forecast by Application, 2020-2035
  • Table 40: Eastern Europe Market Volume (Metric Tons) Forecast by Application, 2020-2035
  • Table 41: East Asia Market Value (USD Billion) Forecast by Country, 2020-2035
  • Table 42: East Asia Market Volume (Metric Tons) Forecast by Country, 2020-2035
  • Table 43: East Asia Market Value (USD Billion) Forecast by Product Type, 2020-2035
  • Table 44: East Asia Market Volume (Metric Tons) Forecast by Product Type, 2020-2035
  • Table 45: East Asia Market Value (USD Billion) Forecast by Source, 2020-2035
  • Table 46: East Asia Market Volume (Metric Tons) Forecast by Source, 2020-2035
  • Table 47: East Asia Market Value (USD Billion) Forecast by Application, 2020-2035
  • Table 48: East Asia Market Volume (Metric Tons) Forecast by Application, 2020-2035
  • Table 49: South Asia & Pacific Market Value (USD Billion) Forecast by Country, 2020-2035
  • Table 50: South Asia & Pacific Market Volume (Metric Tons) Forecast by Country, 2020-2035
  • Table 51: South Asia & Pacific Market Value (USD Billion) Forecast by Product Type, 2020-2035
  • Table 52: South Asia & Pacific Market Volume (Metric Tons) Forecast by Product Type, 2020-2035
  • Table 53: South Asia & Pacific Market Value (USD Billion) Forecast by Source, 2020-2035
  • Table 54: South Asia & Pacific Market Volume (Metric Tons) Forecast by Source, 2020-2035
  • Table 55: South Asia & Pacific Market Value (USD Billion) Forecast by Application, 2020-2035
  • Table 56: South Asia & Pacific Market Volume (Metric Tons) Forecast by Application, 2020-2035
  • Table 57: Middle East and Africa Market Value (USD Billion) Forecast by Country, 2020-2035
  • Table 58: Middle East and Africa Market Volume (Metric Tons) Forecast by Country, 2020-2035
  • Table 59: Middle East and Africa Market Value (USD Billion) Forecast by Product Type, 2020-2035
  • Table 60: Middle East and Africa Market Volume (Metric Tons) Forecast by Product Type, 2020-2035
  • Table 61: Middle East and Africa Market Value (USD Billion) Forecast by Source, 2020-2035
  • Table 62: Middle East and Africa Market Volume (Metric Tons) Forecast by Source, 2020-2035
  • Table 63: Middle East and Africa Market Value (USD Billion) Forecast by Application, 2020-2035
  • Table 64: Middle East and Africa Market Volume (Metric Tons) Forecast by Application, 2020-2035

List of Figures

  • Figure 1: Global Market Volume (Metric Tons) Forecast 2020-2035
  • Figure 2: Global Market Pricing Analysis
  • Figure 3: Global Market Value (USD Billion) Forecast 2020-2035
  • Figure 4: Global Market Value Share and BPS Analysis by Product Type, 2025 and 2035
  • Figure 5: Global Market Y-o-Y Growth Comparison by Product Type, 2025-2035
  • Figure 6: Global Market Attractiveness Analysis by Product Type
  • Figure 7: Global Market Value Share and BPS Analysis by Source, 2025 and 2035
  • Figure 8: Global Market Y-o-Y Growth Comparison by Source, 2025-2035
  • Figure 9: Global Market Attractiveness Analysis by Source
  • Figure 10: Global Market Value Share and BPS Analysis by Application, 2025 and 2035
  • Figure 11: Global Market Y-o-Y Growth Comparison by Application, 2025-2035
  • Figure 12: Global Market Attractiveness Analysis by Application
  • Figure 13: Global Market Value (USD Billion) Share and BPS Analysis by Region, 2025 and 2035
  • Figure 14: Global Market Y-o-Y Growth Comparison by Region, 2025-2035
  • Figure 15: Global Market Attractiveness Analysis by Region
  • Figure 16: North America Market Incremental $ Opportunity, 2025-2035
  • Figure 17: Latin America Market Incremental $ Opportunity, 2025-2035
  • Figure 18: Western Europe Market Incremental $ Opportunity, 2025-2035
  • Figure 19: Eastern Europe Market Incremental $ Opportunity, 2025-2035
  • Figure 20: East Asia Market Incremental $ Opportunity, 2025-2035
  • Figure 21: South Asia & Pacific Market Incremental $ Opportunity, 2025-2035
  • Figure 22: Middle East and Africa Market Incremental $ Opportunity, 2025-2035
  • Figure 23: North America Market Value Share and BPS Analysis by Country, 2025 and 2035
  • Figure 24: North America Market Value Share and BPS Analysis by Product Type, 2025 and 2035
  • Figure 25: North America Market Y-o-Y Growth Comparison by Product Type, 2025-2035
  • Figure 26: North America Market Attractiveness Analysis by Product Type
  • Figure 27: North America Market Value Share and BPS Analysis by Source, 2025 and 2035
  • Figure 28: North America Market Y-o-Y Growth Comparison by Source, 2025-2035
  • Figure 29: North America Market Attractiveness Analysis by Source
  • Figure 30: North America Market Value Share and BPS Analysis by Application, 2025 and 2035
  • Figure 31: North America Market Y-o-Y Growth Comparison by Application, 2025-2035
  • Figure 32: North America Market Attractiveness Analysis by Application
  • Figure 33: Latin America Market Value Share and BPS Analysis by Country, 2025 and 2035
  • Figure 34: Latin America Market Value Share and BPS Analysis by Product Type, 2025 and 2035
  • Figure 35: Latin America Market Y-o-Y Growth Comparison by Product Type, 2025-2035
  • Figure 36: Latin America Market Attractiveness Analysis by Product Type
  • Figure 37: Latin America Market Value Share and BPS Analysis by Source, 2025 and 2035
  • Figure 38: Latin America Market Y-o-Y Growth Comparison by Source, 2025-2035
  • Figure 39: Latin America Market Attractiveness Analysis by Source
  • Figure 40: Latin America Market Value Share and BPS Analysis by Application, 2025 and 2035
  • Figure 41: Latin America Market Y-o-Y Growth Comparison by Application, 2025-2035
  • Figure 42: Latin America Market Attractiveness Analysis by Application
  • Figure 43: Western Europe Market Value Share and BPS Analysis by Country, 2025 and 2035
  • Figure 44: Western Europe Market Value Share and BPS Analysis by Product Type, 2025 and 2035
  • Figure 45: Western Europe Market Y-o-Y Growth Comparison by Product Type, 2025-2035
  • Figure 46: Western Europe Market Attractiveness Analysis by Product Type
  • Figure 47: Western Europe Market Value Share and BPS Analysis by Source, 2025 and 2035
  • Figure 48: Western Europe Market Y-o-Y Growth Comparison by Source, 2025-2035
  • Figure 49: Western Europe Market Attractiveness Analysis by Source
  • Figure 50: Western Europe Market Value Share and BPS Analysis by Application, 2025 and 2035
  • Figure 51: Western Europe Market Y-o-Y Growth Comparison by Application, 2025-2035
  • Figure 52: Western Europe Market Attractiveness Analysis by Application
  • Figure 53: Eastern Europe Market Value Share and BPS Analysis by Country, 2025 and 2035
  • Figure 54: Eastern Europe Market Value Share and BPS Analysis by Product Type, 2025 and 2035
  • Figure 55: Eastern Europe Market Y-o-Y Growth Comparison by Product Type, 2025-2035
  • Figure 56: Eastern Europe Market Attractiveness Analysis by Product Type
  • Figure 57: Eastern Europe Market Value Share and BPS Analysis by Source, 2025 and 2035
  • Figure 58: Eastern Europe Market Y-o-Y Growth Comparison by Source, 2025-2035
  • Figure 59: Eastern Europe Market Attractiveness Analysis by Source
  • Figure 60: Eastern Europe Market Value Share and BPS Analysis by Application, 2025 and 2035
  • Figure 61: Eastern Europe Market Y-o-Y Growth Comparison by Application, 2025-2035
  • Figure 62: Eastern Europe Market Attractiveness Analysis by Application
  • Figure 63: East Asia Market Value Share and BPS Analysis by Country, 2025 and 2035
  • Figure 64: East Asia Market Value Share and BPS Analysis by Product Type, 2025 and 2035
  • Figure 65: East Asia Market Y-o-Y Growth Comparison by Product Type, 2025-2035
  • Figure 66: East Asia Market Attractiveness Analysis by Product Type
  • Figure 67: East Asia Market Value Share and BPS Analysis by Source, 2025 and 2035
  • Figure 68: East Asia Market Y-o-Y Growth Comparison by Source, 2025-2035
  • Figure 69: East Asia Market Attractiveness Analysis by Source
  • Figure 70: East Asia Market Value Share and BPS Analysis by Application, 2025 and 2035
  • Figure 71: East Asia Market Y-o-Y Growth Comparison by Application, 2025-2035
  • Figure 72: East Asia Market Attractiveness Analysis by Application
  • Figure 73: South Asia & Pacific Market Value Share and BPS Analysis by Country, 2025 and 2035
  • Figure 74: South Asia & Pacific Market Value Share and BPS Analysis by Product Type, 2025 and 2035
  • Figure 75: South Asia & Pacific Market Y-o-Y Growth Comparison by Product Type, 2025-2035
  • Figure 76: South Asia & Pacific Market Attractiveness Analysis by Product Type
  • Figure 77: South Asia & Pacific Market Value Share and BPS Analysis by Source, 2025 and 2035
  • Figure 78: South Asia & Pacific Market Y-o-Y Growth Comparison by Source, 2025-2035
  • Figure 79: South Asia & Pacific Market Attractiveness Analysis by Source
  • Figure 80: South Asia & Pacific Market Value Share and BPS Analysis by Application, 2025 and 2035
  • Figure 81: South Asia & Pacific Market Y-o-Y Growth Comparison by Application, 2025-2035
  • Figure 82: South Asia & Pacific Market Attractiveness Analysis by Application
  • Figure 83: Middle East and Africa Market Value Share and BPS Analysis by Country, 2025 and 2035
  • Figure 84: Middle East and Africa Market Value Share and BPS Analysis by Product Type, 2025 and 2035
  • Figure 85: Middle East and Africa Market Y-o-Y Growth Comparison by Product Type, 2025-2035
  • Figure 86: Middle East and Africa Market Attractiveness Analysis by Product Type
  • Figure 87: Middle East and Africa Market Value Share and BPS Analysis by Source, 2025 and 2035
  • Figure 88: Middle East and Africa Market Y-o-Y Growth Comparison by Source, 2025-2035
  • Figure 89: Middle East and Africa Market Attractiveness Analysis by Source
  • Figure 90: Middle East and Africa Market Value Share and BPS Analysis by Application, 2025 and 2035
  • Figure 91: Middle East and Africa Market Y-o-Y Growth Comparison by Application, 2025-2035
  • Figure 92: Middle East and Africa Market Attractiveness Analysis by Application
  • Figure 93: Global Market - Tier Structure Analysis
  • Figure 94: Global Market - Company Share Analysis

Frequently Asked Questions

What is the projected size of the food flavor enhancer market in 2025?

The market is valued at USD 9.8 billion in 2025.

What is the outlook on food flavor enhancer demand by 2035?

The market is forecasted to reach USD 17.6 billion by 2035, reflecting a CAGR of 6%.

Which segment leads the food flavor enhancer market by product type in 2025?

Glutamates will lead the product type segment, accounting for 38% of the global market share in 2025.

What is the top source segment for the food flavor enhancer market in 2025?

Plant-based flavor enhancers will dominate the source segment with a 44% share in 2025.

Which country is projected to have the fastest-growing food flavor enhancer market?

Japan is projected to grow at the fastest rate, with a CAGR of 8.2% from 2025 to 2035.

Explore Similar Insights

Future Market Insights

Food Flavor Enhancer Market