
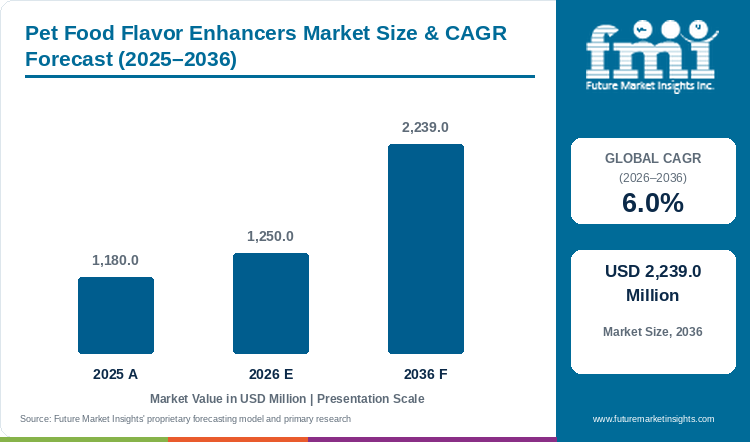
- Market Size (2026)
- USD 1250.0 Mn
- Forecast (2036)
- USD 2239.0 Mn
- CAGR (2026 to 2036)
- 6.0%
How big is the Pet Food Flavor Enhancers Market in 2026?
The Pet Food Flavor Enhancers Market is projected to reach USD 2,239.0 million by 2036, growing at a 6.0% CAGR from 2026 to 2036. FMI estimates the market at USD 1,250.0 million in 2026. The market was valued at USD 1,180.0 million in 2025. Demand follows the pet food industry, valued at USD 141.0 billion in 2026. Flavor enhancers are a small share of that spend, yet they decide whether a pet accepts a recipe. A leading flavor group reported low single-digit pet palatability growth in 2025 and the first quarter of 2026 [1][2]. Gains therefore come from new formats and premium recipes, not from price.
Palatants are coated onto the surface of pet food such as kibble [11]. Demand therefore follows production tonnage, which Alltech reports at 39.28 million tonnes for 2025 [12]. Europe made 13.08 million tonnes and North America 11.37 million [12]. The United States made 10.5 million tonnes, Brazil 4.0 million and China 1.9 million [13]. Asia added about 0.23 million tonnes while North America lost 0.07 million, so new palatant volume sits in Asia [12].
Key Market Trends & Insights
- Pet owners pay for products that do more than taste good. A 2026 private label report found that 77.0% of owners agree functional benefits are worth paying more for [3]. It also found that 62.0% name the ingredient list as the main reason they switch brands [3]. Flavor suppliers are therefore adding clean-label and functional claims to palatants [11].
- Wet, fresh and treat formats are growing, and they rely on palatants for aroma and taste. Private label treat unit sales rose 67.0% in the United States in 2025 [3]. Liquid palatants are dosed at 1 to 4% of a recipe against 0.5 to 3% for powders [21]. Liquid systems add aroma and bind powder coatings, and they also serve recipes in the wet pet food market [21].
- Suppliers are investing in alternative proteins and local capacity. Symrise inaugurated a pet food facility in Querétaro, Mexico, on 25 February 2026 [24]. It also took an equity stake in Bond Pet Foods, a precision-fermentation protein company, in April 2026 [25]. The stake aims to broaden access to proteins that diversify the source of pet food ingredients [25].
- Private label is moving up the quality ladder. Private label pet product unit sales grew 5.4% in 2025 in the United States, with treats up 67.0% and supplements up 39.0% [3], and store brands need flavor systems that match national brand acceptance at a lower cost.
Regional Highlights
- In North America, premium spending supports palatant demand. The US pet industry spent USD 158.0 billion in 2025, of which pet food and treats were USD 68.3 billion, and 95 million households own a pet [4].
- In Europe, the market is large but mature. FEDIAF reported pet food sales of EUR 29.4 billion and about 8.6 million tonnes in 2024, with 306 million pets and 140 million pet-owning households, or 49.0% of households [5].
- In Asia Pacific, pet populations and spending are rising, and Asian pet food output grew 5.6% in 2025 [12]. China's growth comes from higher spending per pet [6].
Pet Food Flavor Enhancers Market Size and Forecast
Table 1: Pet Food Flavor Enhancers Market Size and Forecast
| Market size and forecast | Value |
|---|---|
| Market size in 2025 | USD 1,180.0 million |
| Estimated market size in 2026 | USD 1,250.0 million |
| Projected market size by 2036 | USD 2,239.0 million |
| CAGR from 2026 to 2036 | 6.0% |
Source: Future Market Insights analysis of the pet food flavor enhancers market, 2026.
Analyst Perspective
“Flavor enhancers are a small cost inside a pet food recipe, but they decide repeat purchase, so pet food makers qualify suppliers on palatability test results more than on price. Suppliers with in-house feeding trials, local plants and clean-label options are best placed. Volatile animal by-product costs and tighter traceability rules in Europe and North America are the main risks, because they raise input costs and compliance work.”
- Nandini Roy Choudhury, Principal Analyst at Future Market Insights
How is the Pet Food Flavor Enhancers Market segmented?
- By source: Animal-based, Plant-based and fermentation-derived, Synthetic.
- By form: Dry powder, Liquid, Semi-solid pastes and gels.
- By pet type: Dogs, Cats, Other pets.
- By application: Dry pet food, Wet pet food, Treats and snacks, Veterinary and supplement diets.
- By region: North America, Latin America, Europe, East Asia, South Asia, Oceania, Middle East and Africa.
Why do Animal-based enhancers lead by Source in the Pet Food Flavor Enhancers Market in 2026?
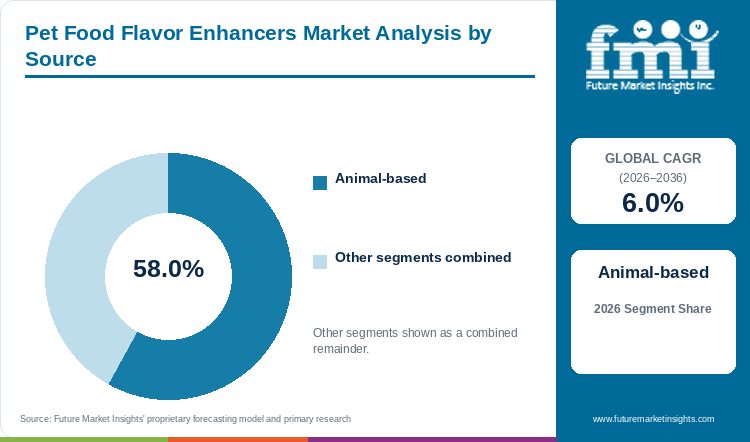
Animal-based enhancers hold 58.0% of the Pet Food Flavor Enhancers Market by source in 2026.
Dogs and cats respond to meat, poultry and fish aromas. Animal proteins supply digestible amino acids, which is why animal-based systems lead pet food palatants. Traditional palatants use animal fats, protein digests and hydrolyzed tissues, often as post-extrusion coatings on kibble [11]. Kemin reports that 5% or 10% hydrolyzed chicken liver improved two-bowl palatability in a kibble recipe [21]. Plant-based, fermentation-derived and synthetic enhancers hold the remaining 42.0%. Plant-based options are entering the range, such as a natural pet flavor from Kerry that helps control odour inside factories [22]. Animal-based products keep the lead because they still give the strongest meat aroma at low cost.
Table 2: Source, 2026 Share
| Leading Share | 2026 market share |
|---|---|
| Animal-based | 58.0% |
| All Other Segments Combined Share | 42.0% |
Source: Future Market Insights analysis of the pet food flavor enhancers market, 2026.
Why does Dry powder lead by Form in the Pet Food Flavor Enhancers Market in 2026?
Dry powder holds 62.0% of the Pet Food Flavor Enhancers Market by form in 2026.
Powders are stable in processing and easy to handle. They add flavor, help control moisture and suit low-moisture cat kibble [21]. Liquid and semi-solid forms hold the remaining 38.0%. Liquid palatants enhance aroma and bind powder coatings, and they are mainly used for dog food [21]. Dry powder keeps the lead because dry pet food is the leading application.
Table 3: Form, 2026 Share
| Leading Share | 2026 market share |
|---|---|
| Dry powder | 62.0% |
| All Other Segments Combined Share | 38.0% |
Source: Future Market Insights analysis of the pet food flavor enhancers market, 2026.
Why do Dogs lead by Pet Type in the Pet Food Flavor Enhancers Market in 2026?
Dogs hold 47.0% of the Pet Food Flavor Enhancers Market by pet type in 2026.
Dogs are the larger pet population in the United States, at 88.9 million against 77.0 million cats [26]. Dogs live in 43.7% of households and cats in 34.1% [26]. Dog products cover both dry kibble and wet food, with many recipes. Cats and other pets hold the remaining 53.0%. Cats need palatants tuned to amino acids and nucleotides, while dogs respond strongly to aroma [21]. Dogs remain the leading pet type for flavor suppliers.
Table 4: Pet Type, 2026 Share
| Leading Share | 2026 market share |
|---|---|
| Dogs | 47.0% |
| All Other Segments Combined Share | 53.0% |
Source: Future Market Insights analysis of the pet food flavor enhancers market, 2026.
Why does Dry pet food lead by Application in the Pet Food Flavor Enhancers Market in 2026?
Dry pet food holds 54.0% of the Pet Food Flavor Enhancers Market by application in 2026.
Palatant is coated onto the surface of extruded kibble, where it sets acceptance [11]. Fat is generally applied first, then liquid palatants and then powder [21]. Wet food, treats and veterinary diets hold the remaining 46.0%. Wet food growth is uneven, since German wet dog food sales fell in 2025 while wet cat food grew [7].
Table 5: Application, 2026 Share
| Leading Share | 2026 market share |
|---|---|
| Dry pet food | 54.0% |
| All Other Segments Combined Share | 46.0% |
Source: Future Market Insights analysis of the pet food flavor enhancers market, 2026.
What are the key drivers, restraints and opportunities?
Driver
Premium and functional pet diets. Owners' willingness to pay for functional benefits, and their focus on the ingredient list when they switch brands [3], push makers toward premium recipes. These recipes use flavor systems to mask functional ingredients and keep acceptance high.
Rising pet spending in Asia Pacific. More pets and higher spending per pet in China lift demand for palatable recipes [6][8], and urban cat ownership is rising across Asia Pacific.
Restraint
Flat volumes in mature markets. Symrise described its pet nutrition business as seeing price normalisation after 2025, with growth to come mainly from volume [1][2]. German wet dog food sales declined in 2025 [7]. Slow volume in mature markets therefore limits palatant growth.
Regulatory change and compliance work. Only authorized feed additives such as flavors may be marketed in the EU [20]. China proposed a mandatory pet feed label standard in August 2025 [18]. AAFCO's model label regulations carry a recommended six-year transition [17]. New rules add compliance work for suppliers that sell across regions.
Opportunity
Treats, wet food and cats. US private label treat unit sales rose 67.0% in 2025 [3]. India's cat food sales grew 31.1% a year from 2020 to 2025 [9]. Suppliers with liquid systems and cat-specific palatants can win share in these formats [22].
Private label and local production. Store brands moving into premium tiers [3] and regional plants close to customers [2] offer new volume to suppliers.
Pet Food Flavor Enhancers Market by Country (2026 to 2036)
Table 6: Pet Food Flavor Enhancers Market Country Growth Forecast
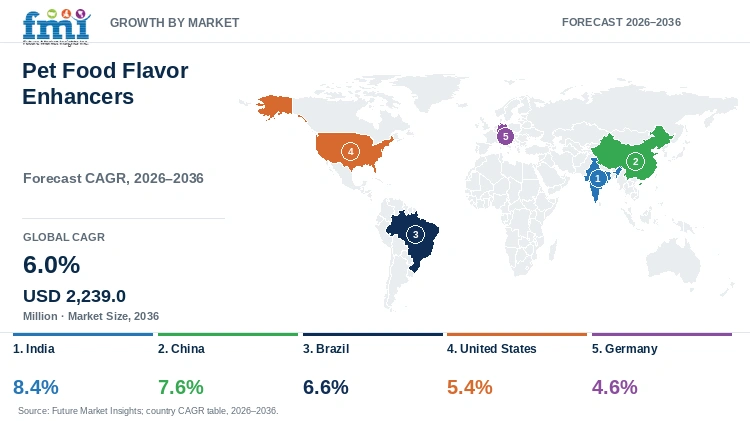
| Country | CAGR, 2026 to 2036 |
|---|---|
| India | 8.4% |
| China | 7.6% |
| Brazil | 6.6% |
| United States | 5.4% |
| Germany | 4.6% |
Source: Future Market Insights analysis of the pet food flavor enhancers market, 2026.
India
India is the fastest-growing profiled market from a small base. Retail pet food sales were USD 769.7 million in 2025, making India the 29th largest market with 0.5% of global sales [9]. Rising pet ownership and urban incomes support fast growth in premium recipes, and an 8.4% CAGR from this base is expected.
India's growth comes from households switching to commercial food. Traditional feeding relied on home-cooked meals and table scraps, and owners often see commercial food as an unnecessary expense [9]. Alltech nonetheless reports a shift toward commercial pet food in India and the Philippines [12]. Retail sales grew 16.6% a year over 2020 to 2025, and the forecast is 11.7% a year to 2030 [9].
Cat food is the faster category, at USD 213.9 million in 2025 after 31.1% annual growth since 2020 [9]. Dog food grew 13.0% a year and still holds 70% of value [9]. Imports of Can$192.9 million in 2025 fill part of the demand, and Thailand supplies 63.3% of that value [9]. Thailand made 1.2 million tonnes in 2025, so Thai plants may buy some palatants that serve India [13]. The buyer base is also concentrated, since two manufacturers held 71% of retail sales in 2024 [9]. Unlike Germany, where cat food leads at over EUR 2.3 billion, India remains dog-led at 70% of value [7][9]. A supplier therefore needs to qualify with the two leading manufacturers and reach Thai export plants [9][13].
China
China's pet industry reached USD 43.4 billion in 2025, with growth driven by higher spending per pet and by younger buyers who expect functionality and nutrition [6], and the urban dog and cat population reached 126 million [8]. Online channels support both domestic and imported products [6], giving a 7.6% CAGR.
China ranks third in world retail pet food sales at USD 7.6 billion, behind the United States and Brazil [9]. Domestic production sets the pace for China's palatant demand. Alltech reports that Chinese pet food output rose 17.8% in 2025, against 5.6% for Asia as a whole [12]. China made 1.9 million tonnes in 2025, while Asia added only 0.23 million tonnes in total [12][13]. Offline retail remains resilient in core cities, and niche and exotic pets are becoming more popular [6]. Regional palatant growth therefore depends on Chinese plants.
Regulation also adds compliance work for imported products and ingredients. Ministry Notice 923 listed 88 enterprises with import registration for 187 feed and feed additive products [19]. On August 11, 2025, the agriculture ministry released a draft mandatory national standard for pet feed labels [18]. It would replace the 2018 provisions and proposes a 24-month transition for overseas enterprises [18]. Customs introduced risk-based supervision of imported feed and feed additives on December 29, 2025 [19]. Suppliers with local registrations and plants are best placed under these rules.
Brazil
Brazil's pet market had revenue of about BRL 77.96 billion in 2025, with a forecast of BRL 81.24 billion for 2026 [10]. Steady growth in a large pet population supports a 6.6% CAGR.
Brazil grows on mix and exports because domestic tonnage is flat. Retail sales of USD 8.9 billion make it the second largest pet food market [9]. Output stayed above 4 million tonnes in 2025 after a 0.12% rise, while sector revenue grew 3.45% [14]. Industrialized pet food sales reached BRL 41.42 billion, or 53.1% of sector revenue [14]. Plants could make more than 9 million tonnes, against output of just over 4 million [14]. Complete pet food can carry a tax burden of nearly 50%, which Abinpet says hinders production growth [15]. The exchange rate also moves the price of basic ingredients, which Abempet lists as a negative influence [14].
Exports are the second source of volume for Brazilian plants. Pet exports reached USD 580.6 million in 2024, up 29.7%, and pet food and treats made up 86% [15]. Pet imports were only USD 20.1 million, against food and treat exports of about USD 499.3 million [15]. Colombia, Uruguay and the United Arab Emirates were the leading buyers of Brazilian pet products [15]. A weak real helps exports but lifts ingredient costs [14][15]. Palatant suppliers in Brazil therefore weigh export contracts and exchange-rate swings as well as home demand [14][15].
United States
In the United States, a mature base of 95 million pet-owning households [4] meets a rising premium share, which leads to a 5.4% CAGR.
Volume is not the driver in the United States. Alltech reports that North American output fell 0.6% in 2025 as ownership shifted to smaller dogs and cats [12]. Smaller animals eat less, which limits tonnage even where pet numbers stay high [12]. The United States made 10.5 million tonnes in 2025 [13]. The Pet Food Institute reports 9.8 million tons made in 2024, with sales of USD 51.7 billion [16]. That is about USD 5,300 of sales per ton, so revenue growth has to come from value per ton [16].
Premium ingredients are the main lever for value per ton. Against the report on 2019 data, US marine ingredients rose 95% and meat and poultry ingredients rose 34% [16]. Alltech also reports more salmon and by-product use in US recipes in 2025 [13]. A richer ingredient mix lets palatant revenue grow while tonnage falls [16]. Label rules add a second driver of reformulation work. AAFCO's model label regulations of 2024 carry a recommended six-year transition, so label changes run to about 2030 [17]. China is rewriting its label rules in the same period, but the US transition is already published [17][18]. Suppliers that can document ingredient claims are best placed for this reformulation work [17].
Germany
Germany is a large but mature pet food market. Dog snack sales rose 2.1% to EUR 768 million in 2025 [7]. Wet dog food fell 1.9% to EUR 582 million [7]. Stable demand with limited volume growth gives a 4.6% CAGR.
Mix, not volume, sets the outlook for palatants in Germany. Ready-made pet food sales were about EUR 4.3 billion in 2025, a rise of only 0.3% [7]. Cat food ranks first at more than EUR 2.3 billion [7]. Wet cat food grew 1.1% to about EUR 1.6 billion [7]. Dry dog food fell 2.7% to EUR 403 million, and wet dog food fell 1.9% [7]. Dog snacks and cat recipes carry the growth, so palatant demand follows them [7]. Pets live in 43% of households, down from 44% in 2024, which limits new demand [7].
Supply to Germany is regional, not national. Germany is the leading importer of pet food, at Can$4.5 billion in 2025 and 14.8% annual growth since 2020 [9]. Alltech names Poland as an export-oriented production hub inside Europe's 13.08 million tonnes [12]. Imports at that scale suggest that plants abroad buy part of the palatant volume for German shelves [9][12]. EU plants work under one rule set, since only authorized feed additives such as flavors may be marketed [20]. Authorizations last 10 years, after which applicants must show the additive remains safe [20]. A supplier therefore needs authorized additives and a route into plants within the EU supply chain [20].
Who are the notable companies in the Pet Food Flavor Enhancers Market?
Notable companies in the Pet Food Flavor Enhancers Market include Symrise, Kemin, Kerry and AFB International.
Palatability evidence separates the suppliers in this market. Pet food makers qualify palatants on feeding-trial results. Suppliers with in-house testing, raw material control and local plants hold an edge [21][22].
Symrise runs a dedicated pet food division, Symrise Pet Food [24]. Its pet palatability business grew at a low single-digit rate in 2025 and in the first quarter of 2026 [1][2]. On 25 February 2026 the division inaugurated a new facility in Querétaro, Mexico, to support local pet food customers [24]. In April 2026 Symrise took an equity stake in Bond Pet Foods, a precision-fermentation protein company [25]. Pet food makers in Mexico can therefore qualify local supply and shorten delivery times.
Kemin offers palatability enhancers to pet food makers through its Nutrisurance business [21]. Its technical team advises liquid palatants at 1 to 4% and powders at 0.5 to 3%, applied after fat [21]. In a kibble trial, replacing part of the meal and liver with 5% or 10% hydrolyzed chicken liver significantly improved palatability [21]. Its guidance matches liquids mainly to dog food and powders to cat food [21].
Kerry sells taste and aroma systems for pet food, built on its human flavour library [22]. Its range covers flavours and aromatics, Cat Pal Booster and PurePal [22]. Kerry states that Cat Pal Booster allows a 10 to 20% palatant reduction against traditional palatants in dry cat food [22]. PurePal is a plant-based natural flavor that also helps control odour inside manufacturing facilities [22]. Kerry validates pet preference with palatability tests [22].
AFB International was founded in 1986 in St. Louis, Missouri, and focuses on palatants for pet food [23]. It is a subsidiary of Ensign-Bickford Industries [23]. AFB partners with pet food manufacturers on food, treats and supplements for dogs and cats [23]. It pairs its palatants with research expertise and technical support [23].
Key Developments in the Pet Food Flavor Enhancers Market
- On 25 February 2026 Symrise inaugurated a new pet food facility in Querétaro, Mexico, to support local customers [24].
Key Players in the Pet Food Flavor Enhancers Market
- Symrise AG
- Kemin Industries, Inc.
- Kerry Group plc
- AFB International
Pet Food Flavor Enhancers Market Report Scope
Table 7: Pet Food Flavor Enhancers Market Report Scope
| Coverage field | Report scope |
|---|---|
| Market definition | Natural, plant-based, fermentation-derived and synthetic palatants, flavors and taste enhancers applied to dog, cat and other pet foods and treats, valued at manufacturer selling prices. Pet food itself, nutritional additives and supplements are excluded. |
| Source | Animal-based; Plant-based and fermentation-derived; Synthetic |
| Form | Dry powder; Liquid; Semi-solid pastes and gels |
| Pet Type | Dogs; Cats; Other pets |
| Application | Dry pet food; Wet pet food; Treats and snacks; Veterinary and supplement diets |
| Regions and profiled countries | North America, Latin America, Europe, East Asia, South Asia, Oceania, Middle East and Africa. Profiled countries: India, China, Brazil, United States, Germany |
| Companies covered | Symrise AG; Kemin Industries, Inc.; Kerry Group plc; AFB International |
| Quantitative Units | USD million |
Pet Food Flavor Enhancers Market by Segments
Pet Food Flavor Enhancers Market segmented by Source:
- Animal-based
- Plant-based and fermentation-derived
- Synthetic
Pet Food Flavor Enhancers Market segmented by Form:
- Dry powder
- Liquid
- Semi-solid pastes and gels
Pet Food Flavor Enhancers Market segmented by Pet Type:
- Dogs
- Cats
- Other pets
Pet Food Flavor Enhancers Market segmented by Application:
- Dry pet food
- Wet pet food
- Treats and snacks
- Veterinary and supplement diets
Pet Food Flavor Enhancers Market by Region
- North America
- Latin America
- Europe
- East Asia
- South Asia
- Oceania
- Middle East
- Africa
- India
- China
- Brazil
- United States
- Germany
Research Sources and Bibliography
- [1] GlobalPETS. (2026, March 9). Symrise posts mixed FY2025 results, pet portfolio stable. https://globalpetindustry.com/news/symrise-posts-mixed-fy2025-results-pet-portfolio-stable/
- [2] GlobalPETS. (2026, April 30). Symrise sees temporary slowdown in pet nutrition as pricing normalizes. https://globalpetindustry.com/news/symrise-sees-temporary-slowdown-in-pet-nutrition-as-pricing-normalizes/
- [3] Pet Food Industry. (2026, September 23). Report: Top trends reshaping private label pet products (ADM 2026 Private Label Pet Market Report). https://www.petfoodindustry.com/pet-food-market/market-trends-and-reports/news/15835667/report-top-trends-reshaping-private-label-pet-products
- [4] American Pet Products Association. (2026). Industry trends and stats: U.S. pet industry spending and 2025 National Pet Owners Survey. https://www.americanpetproducts.org/industry-trends-and-stats
- [5] FEDIAF, European Pet Food Federation. (2026, June). Statistics: facts and figures for 2024. https://europeanpetfood.org/about/statistics/
- [6] U.S. Department of Agriculture, Foreign Agricultural Service. (2026, April 14). China: Pet Food Market Update 2026. GAIN report CH2026-0046. https://www.fas.usda.gov/data/gain/2026/04/china-pet-food-market-update-2026
- [7] Zentralverband Zoologischer Fachbetriebe (ZZF) and Industrieverband Heimtierbedarf (IVH). (2026, April 27). Der deutsche Heimtiermarkt 2025. https://www.zzf.de/marktdaten/der-deutsche-heimtiermarkt
- [8] State Council Information Office of China. (2026, April 2). China's pet economy opens up new consumption scenarios, citing the 2026 China Pet Industry White Paper. http://english.scio.gov.cn/m/chinavoices/2026-04/02/content_118416271.html
- [9] Agriculture and Agri-Food Canada. (2026, May 13). Sector trend analysis: Pet food trends in India. https://agriculture.canada.ca/en/international-trade/reports-and-guides/sector-trend-analysis-pet-food-trends-india
- [10] Noticenter, citing Abinpet and Abempet. (2026, September 20). Mercado pet brasileiro encerrou 2025 com faturamento de aproximadamente R$ 77,96 bilhoes. https://www.noticenter.com.br/noticia/42261/florianopolis-ganha-novo-hospital-veterinario-de-alta-complexidade
- [11] Klinmalai, P., et al. (2025, August 14). Modern palatant strategies in dry and wet pet food: Formulation technologies, patent innovations, and market evolution. Foods, 14(16), 2824. https://www.mdpi.com/2304-8158/14/16/2824
- [12] Pet Food Processing. (2026, April 23). Alltech: Global pet food production slows. https://www.petfoodprocessing.net/articles/20396-alltech-global-pet-food-production-slows
- [13] GlobalPETS. (2026, June 2). Global pet food production grows 2.4% in 2025, slowing from previous years. https://globalpetindustry.com/news/global-pet-food-production-grows-2-4-in-2025-slowing-from-previous-years/
- [14] Abempet. (2026, February). Balanço Abempet 2025: Com crescimento em queda, 3,45% frente a 2024, setor pet faturara R$ 77,96 bilhões em 2025. Press release hosted by the Brazilian Ministry of Agriculture. https://www.gov.br/agricultura/pt-br/assuntos/camaras-setoriais-tematicas/documentos/camaras-setoriais/animais-e-estimacao/2026/45a-ro-23-04-2026/release-projecao-2025-setor-pet.pdf
- [15] Pet Food Industry. (2025, May 13). Pet food drives exports as Brazil's pet sector breaks records. https://www.petfoodindustry.com/global-commerce/news/15745758/pet-food-drives-exports-as-brazils-pet-sector-breaks-records
- [16] Pet Food Institute. (2025). 3 key takeaways from the 2025 Pet Food Production and Ingredient Analysis report. https://www.petfoodinstitute.org/3-key-takeaways-from-the-2025-pet-food-production-and-ingredient-analysis-report/
- [17] Pet Food Institute. (2026). Pet food label modernization. https://www.petfoodinstitute.org/advocacy/labeling-and-regulations/pet-food-label-modernization/
- [18] ChemLinked. (2025, August 22). China consults on mandatory national standard for pet food labeling. https://food.chemlinked.com/news/food-news/china-consults-on-mandatory-national-standard-for-pet-food-labeling
- [19] ChemLinked. (2026, October 19). China animal food regulatory updates: Feed and pet food. https://www.chemlinked.com/featured/china-animal-food-regulatory-updates-feed-and-pet-food
- [20] European Food Safety Authority. (2026, August 18). Feed additives. https://www.efsa.europa.eu/en/topics/topic/feed-additives
- [21] Kemin Industries. (2025, July 2). Enhancing palatability: the role of pet food manufacturing in pets' preferences. https://www.kemin.com/na/en-us/blog/petfood-rendering/enhancing-palatability
- [22] Kerry Group. Pet taste and aroma. https://www.kerry.com/markets/pet/pet-taste-and-aroma
- [23] Interzoo. AFB International (exhibitor profile). https://www.interzoo.com/en/exhibitors/afb-international-2500657
- [24] Symrise Pet Food. (2026, February 25). Symrise Pet Food inaugurates a new facility in Queretaro, Mexico. https://petfood.symrise.com/newsroom/detail/symrise-pet-food-inaugurates-a-new-facility-in-queretaro-mexico/
- [25] Symrise. (2026, April 15). Symrise invests in Bond Pet Foods to accelerate sustainable innovation in pet nutrition via precision fermentation. https://www.symrise.com/newsroom/article/symrise-invests-in-bond-pet-foods-to-accelerate-sustainable-innovation-in-pet-nutrition-via-precision-fermentation/
- [26] American Veterinary Medical Association. (2026). U.S. pet ownership statistics (2026 AVMA Pet Ownership and Demographic Sourcebook). https://www.avma.org/resources-tools/reports-statistics/us-pet-ownership-statistics
Table of Content
Table of Content
- Key Takeaways
- Market Size and CAGR
- Top Growth Driver
- Fastest Growing Segment
- Leading Region
- Key Companies
- Emerging Opportunities
- Executive Summary
- Global Market Outlook
- Demand-side Trends
- Supply-side Trends
- Technology Roadmap Analysis
- Analysis and Recommendations
- Analyst Perspective (What is happening? Why now? What should investors know?)
- Key Questions Answered
- How large is the market?
- What is the CAGR?
- What are key trends?
- Which region dominates?
- Who are the leaders?
Read More...
- Market Overview
- Market Coverage / Taxonomy
- Market Definition / Scope / Limitations
- Research Methodology
- Chapter Orientation
- Analytical Lens and Working Hypotheses
- Market Structure, Signals, and Trend Drivers
- Benchmarking and Cross-market Comparability
- Market Sizing, Forecasting, and Opportunity Mapping
- Research Design and Evidence Framework
- Desk Research Programme (Secondary Evidence)
- Expert Input and Fieldwork (Primary Evidence)
- Tooling, Models, and Reference Databases
- Data Engineering and Model Build
- Quality Assurance and Audit Trail
- Market Background
- Market Dynamics (Drivers, Restraints, Opportunity, Trends)
- Scenario Forecast (Optimistic, Likely, Conservative)
- Impact Analysis
- AI Impact
- Sustainability Impact
- Regulatory Impact
- Technology Impact
- Consumer / Buyer Analysis
- Purchase Drivers
- Adoption Barriers
- Buyer Journey
- Opportunity Map Analysis
- Product Life Cycle Analysis
- Supply Chain Analysis
- Investment Feasibility Matrix
- Value Chain Analysis
- PESTLE and Porter's Analysis
- Regulatory Landscape
- Regional Parent Market Outlook
- Production and Consumption Statistics
- Import and Export Statistics
- Global Market Analysis and Forecast, 2021 to 2036
- Historical Market Size Value (USD Million) Analysis, 2021 to 2025
- Current and Future Market Size Value (USD Million) Projections, 2026 to 2036
- Y-o-Y Growth Trend Analysis
- Absolute $ Opportunity Analysis
- Global Market Pricing Analysis, 2021 to 2036
- Global Market Analysis and Forecast, By Source, 2021 to 2036
- Introduction / Key Findings
- Historical Market Size Value (USD Million) Analysis By Source, 2021 to 2025
- Current and Future Market Size Value (USD Million) Analysis and Forecast By Source, 2026 to 2036
- Animal-based
- Plant-based and fermentation-derived
- Synthetic
- Y-o-Y Growth Trend Analysis By Source, 2021 to 2025
- Absolute $ Opportunity Analysis By Source, 2026 to 2036
- Global Market Analysis and Forecast, By Form, 2021 to 2036
- Introduction / Key Findings
- Historical Market Size Value (USD Million) Analysis By Form, 2021 to 2025
- Current and Future Market Size Value (USD Million) Analysis and Forecast By Form, 2026 to 2036
- Dry powder
- Liquid
- Semi-solid pastes and gels
- Y-o-Y Growth Trend Analysis By Form, 2021 to 2025
- Absolute $ Opportunity Analysis By Form, 2026 to 2036
- Global Market Analysis and Forecast, By Pet Type, 2021 to 2036
- Introduction / Key Findings
- Historical Market Size Value (USD Million) Analysis By Pet Type, 2021 to 2025
- Current and Future Market Size Value (USD Million) Analysis and Forecast By Pet Type, 2026 to 2036
- Dogs
- Cats
- Other pets
- Y-o-Y Growth Trend Analysis By Pet Type, 2021 to 2025
- Absolute $ Opportunity Analysis By Pet Type, 2026 to 2036
- Global Market Analysis and Forecast, By Application, 2021 to 2036
- Introduction / Key Findings
- Historical Market Size Value (USD Million) Analysis By Application, 2021 to 2025
- Current and Future Market Size Value (USD Million) Analysis and Forecast By Application, 2026 to 2036
- Dry pet food
- Wet pet food
- Treats and snacks
- Veterinary and supplement diets
- Y-o-Y Growth Trend Analysis By Application, 2021 to 2025
- Absolute $ Opportunity Analysis By Application, 2026 to 2036
- Global Market Analysis and Forecast, By Region, 2021 to 2036
- Introduction
- Historical Market Size Value (USD Million) Analysis By Region, 2021 to 2025
- Current Market Size Value (USD Million) Analysis and Forecast By Region, 2026 to 2036
- North America
- Latin America
- Europe
- East Asia
- South Asia
- Oceania
- Middle East
- Africa
- Market Attractiveness Analysis By Region
- North America Market Analysis and Forecast, By Country, 2021 to 2036
- Historical Market Size Value (USD Million) Trend Analysis By Market Taxonomy, 2021 to 2025
- Market Size Value (USD Million) Forecast By Market Taxonomy, 2026 to 2036
- By Country
- By Source
- By Form
- By Pet Type
- By Application
- Market Attractiveness Analysis
- By Country
- By Source
- By Form
- By Pet Type
- By Application
- Key Takeaways
- Latin America Market Analysis and Forecast, By Country
- Historical Market Size Value (USD Million) Trend Analysis By Market Taxonomy, 2021 to 2025
- Market Size Value (USD Million) Forecast By Market Taxonomy, 2026 to 2036
- By Country
- By Source
- By Form
- By Pet Type
- By Application
- Market Attractiveness Analysis
- By Country
- By Source
- By Form
- By Pet Type
- By Application
- Key Takeaways
- Europe Market Analysis and Forecast, By Country
- Historical Market Size Value (USD Million) Trend Analysis By Market Taxonomy, 2021 to 2025
- Market Size Value (USD Million) Forecast By Market Taxonomy, 2026 to 2036
- By Country
- By Source
- By Form
- By Pet Type
- By Application
- Market Attractiveness Analysis
- By Country
- By Source
- By Form
- By Pet Type
- By Application
- Key Takeaways
- East Asia Market Analysis and Forecast, By Country
- Historical Market Size Value (USD Million) Trend Analysis By Market Taxonomy, 2021 to 2025
- Market Size Value (USD Million) Forecast By Market Taxonomy, 2026 to 2036
- By Country
- By Source
- By Form
- By Pet Type
- By Application
- Market Attractiveness Analysis
- By Country
- By Source
- By Form
- By Pet Type
- By Application
- Key Takeaways
- South Asia Market Analysis and Forecast, By Country
- Historical Market Size Value (USD Million) Trend Analysis By Market Taxonomy, 2021 to 2025
- Market Size Value (USD Million) Forecast By Market Taxonomy, 2026 to 2036
- By Country
- By Source
- By Form
- By Pet Type
- By Application
- Market Attractiveness Analysis
- By Country
- By Source
- By Form
- By Pet Type
- By Application
- Key Takeaways
- Oceania Market Analysis and Forecast, By Country
- Historical Market Size Value (USD Million) Trend Analysis By Market Taxonomy, 2021 to 2025
- Market Size Value (USD Million) Forecast By Market Taxonomy, 2026 to 2036
- By Country
- By Source
- By Form
- By Pet Type
- By Application
- Market Attractiveness Analysis
- By Country
- By Source
- By Form
- By Pet Type
- By Application
- Key Takeaways
- Middle East Market Analysis and Forecast, By Country
- Historical Market Size Value (USD Million) Trend Analysis By Market Taxonomy, 2021 to 2025
- Market Size Value (USD Million) Forecast By Market Taxonomy, 2026 to 2036
- By Country
- By Source
- By Form
- By Pet Type
- By Application
- Market Attractiveness Analysis
- By Country
- By Source
- By Form
- By Pet Type
- By Application
- Key Takeaways
- Africa Market Analysis and Forecast, By Country
- Historical Market Size Value (USD Million) Trend Analysis By Market Taxonomy, 2021 to 2025
- Market Size Value (USD Million) Forecast By Market Taxonomy, 2026 to 2036
- By Country
- India
- China
- Brazil
- United States
- Germany
- By Source
- By Form
- By Pet Type
- By Application
- By Country
- Market Attractiveness Analysis
- By Country
- By Source
- By Form
- By Pet Type
- By Application
- Key Takeaways
- Key Countries Market Analysis
- United States
- Pricing Analysis
- Market Share Analysis, 2025
- By Source
- By Form
- By Pet Type
- By Application
- Brazil
- Pricing Analysis
- Market Share Analysis, 2025
- By Source
- By Form
- By Pet Type
- By Application
- Germany
- Pricing Analysis
- Market Share Analysis, 2025
- By Source
- By Form
- By Pet Type
- By Application
- India
- Pricing Analysis
- Market Share Analysis, 2025
- By Source
- By Form
- By Pet Type
- By Application
- China
- Pricing Analysis
- Market Share Analysis, 2025
- By Source
- By Form
- By Pet Type
- By Application
- United States
- Market Structure Analysis
- Competition Dashboard
- Competition Benchmarking
- Market Share Analysis of Top Players
- By Regional
- By Source
- By Form
- By Pet Type
- By Application
- Emerging Startups
- Innovation Benchmarking
- Competition Analysis
- Competition Deep Dive
- Symrise AG
- Overview
- Product Portfolio
- Profitability by Market Segments
- Sales Footprint
- Strategy Overview
- Marketing Strategy
- Product Strategy
- Channel Strategy
- Kemin Industries, Inc.
- Kerry Group plc
- AFB International
- Symrise AG
- Case Studies
- Success Stories
- Recent Developments
- Competition Deep Dive
- Assumptions & Acronyms Used
List of Tables
- Table 1: Global Market Value (USD Million) Forecast by Region, 2021 to 2036
- Table 2: Global Market Value (USD Million) Forecast by Source, 2021 to 2036
- Table 3: Global Market Value (USD Million) Forecast by Form, 2021 to 2036
- Table 4: Global Market Value (USD Million) Forecast by Pet Type, 2021 to 2036
- Table 5: Global Market Value (USD Million) Forecast by Application, 2021 to 2036
- Table 6: North America Market Value (USD Million) Forecast by Country, 2021 to 2036
- Table 7: North America Market Value (USD Million) Forecast by Source, 2021 to 2036
- Table 8: North America Market Value (USD Million) Forecast by Form, 2021 to 2036
- Table 9: North America Market Value (USD Million) Forecast by Pet Type, 2021 to 2036
- Table 10: North America Market Value (USD Million) Forecast by Application, 2021 to 2036
- Table 11: Latin America Market Value (USD Million) Forecast by Country, 2021 to 2036
- Table 12: Latin America Market Value (USD Million) Forecast by Source, 2021 to 2036
- Table 13: Latin America Market Value (USD Million) Forecast by Form, 2021 to 2036
- Table 14: Latin America Market Value (USD Million) Forecast by Pet Type, 2021 to 2036
- Table 15: Latin America Market Value (USD Million) Forecast by Application, 2021 to 2036
- Table 16: Europe Market Value (USD Million) Forecast by Country, 2021 to 2036
- Table 17: Europe Market Value (USD Million) Forecast by Source, 2021 to 2036
- Table 18: Europe Market Value (USD Million) Forecast by Form, 2021 to 2036
- Table 19: Europe Market Value (USD Million) Forecast by Pet Type, 2021 to 2036
- Table 20: Europe Market Value (USD Million) Forecast by Application, 2021 to 2036
- Table 21: East Asia Market Value (USD Million) Forecast by Country, 2021 to 2036
- Table 22: East Asia Market Value (USD Million) Forecast by Source, 2021 to 2036
- Table 23: East Asia Market Value (USD Million) Forecast by Form, 2021 to 2036
- Table 24: East Asia Market Value (USD Million) Forecast by Pet Type, 2021 to 2036
- Table 25: East Asia Market Value (USD Million) Forecast by Application, 2021 to 2036
- Table 26: South Asia Market Value (USD Million) Forecast by Country, 2021 to 2036
- Table 27: South Asia Market Value (USD Million) Forecast by Source, 2021 to 2036
- Table 28: South Asia Market Value (USD Million) Forecast by Form, 2021 to 2036
- Table 29: South Asia Market Value (USD Million) Forecast by Pet Type, 2021 to 2036
- Table 30: South Asia Market Value (USD Million) Forecast by Application, 2021 to 2036
- Table 31: Oceania Market Value (USD Million) Forecast by Country, 2021 to 2036
- Table 32: Oceania Market Value (USD Million) Forecast by Source, 2021 to 2036
- Table 33: Oceania Market Value (USD Million) Forecast by Form, 2021 to 2036
- Table 34: Oceania Market Value (USD Million) Forecast by Pet Type, 2021 to 2036
- Table 35: Oceania Market Value (USD Million) Forecast by Application, 2021 to 2036
- Table 36: Middle East Market Value (USD Million) Forecast by Country, 2021 to 2036
- Table 37: Middle East Market Value (USD Million) Forecast by Source, 2021 to 2036
- Table 38: Middle East Market Value (USD Million) Forecast by Form, 2021 to 2036
- Table 39: Middle East Market Value (USD Million) Forecast by Pet Type, 2021 to 2036
- Table 40: Middle East Market Value (USD Million) Forecast by Application, 2021 to 2036
- Table 41: Africa Market Value (USD Million) Forecast by Country, 2021 to 2036
- Table 42: Africa Market Value (USD Million) Forecast by Source, 2021 to 2036
- Table 43: Africa Market Value (USD Million) Forecast by Form, 2021 to 2036
- Table 44: Africa Market Value (USD Million) Forecast by Pet Type, 2021 to 2036
- Table 45: Africa Market Value (USD Million) Forecast by Application, 2021 to 2036
List of Figures
- Figure 1: Global Market Pricing Analysis
- Figure 2: Global Market Value (USD Million) Forecast 2021-2036
- Figure 3: Global Market Value Share and BPS Analysis by Source, 2026 and 2036
- Figure 4: Global Market Y-o-Y Growth Comparison by Source, 2026-2036
- Figure 5: Global Market Attractiveness Analysis by Source
- Figure 6: Global Market Value Share and BPS Analysis by Form, 2026 and 2036
- Figure 7: Global Market Y-o-Y Growth Comparison by Form, 2026-2036
- Figure 8: Global Market Attractiveness Analysis by Form
- Figure 9: Global Market Value Share and BPS Analysis by Pet Type, 2026 and 2036
- Figure 10: Global Market Y-o-Y Growth Comparison by Pet Type, 2026-2036
- Figure 11: Global Market Attractiveness Analysis by Pet Type
- Figure 12: Global Market Value Share and BPS Analysis by Application, 2026 and 2036
- Figure 13: Global Market Y-o-Y Growth Comparison by Application, 2026-2036
- Figure 14: Global Market Attractiveness Analysis by Application
- Figure 15: Global Market Value (USD Million) Share and BPS Analysis by Region, 2026 and 2036
- Figure 16: Global Market Y-o-Y Growth Comparison by Region, 2026-2036
- Figure 17: Global Market Attractiveness Analysis by Region
- Figure 18: North America Market Incremental Dollar Opportunity, 2026-2036
- Figure 19: Latin America Market Incremental Dollar Opportunity, 2026-2036
- Figure 20: Europe Market Incremental Dollar Opportunity, 2026-2036
- Figure 21: East Asia Market Incremental Dollar Opportunity, 2026-2036
- Figure 22: South Asia Market Incremental Dollar Opportunity, 2026-2036
- Figure 23: Oceania Market Incremental Dollar Opportunity, 2026-2036
- Figure 24: Middle East Market Incremental Dollar Opportunity, 2026-2036
- Figure 25: Africa Market Incremental Dollar Opportunity, 2026-2036
- Figure 26: North America Market Value Share and BPS Analysis by Country, 2026 and 2036
- Figure 27: North America Market Value Share and BPS Analysis by Source, 2026 and 2036
- Figure 28: North America Market Y-o-Y Growth Comparison by Source, 2026-2036
- Figure 29: North America Market Attractiveness Analysis by Source
- Figure 30: North America Market Value Share and BPS Analysis by Form, 2026 and 2036
- Figure 31: North America Market Y-o-Y Growth Comparison by Form, 2026-2036
- Figure 32: North America Market Attractiveness Analysis by Form
- Figure 33: North America Market Value Share and BPS Analysis by Pet Type, 2026 and 2036
- Figure 34: North America Market Y-o-Y Growth Comparison by Pet Type, 2026-2036
- Figure 35: North America Market Attractiveness Analysis by Pet Type
- Figure 36: North America Market Value Share and BPS Analysis by Application, 2026 and 2036
- Figure 37: North America Market Y-o-Y Growth Comparison by Application, 2026-2036
- Figure 38: North America Market Attractiveness Analysis by Application
- Figure 39: Latin America Market Value Share and BPS Analysis by Country, 2026 and 2036
- Figure 40: Latin America Market Value Share and BPS Analysis by Source, 2026 and 2036
- Figure 41: Latin America Market Y-o-Y Growth Comparison by Source, 2026-2036
- Figure 42: Latin America Market Attractiveness Analysis by Source
- Figure 43: Latin America Market Value Share and BPS Analysis by Form, 2026 and 2036
- Figure 44: Latin America Market Y-o-Y Growth Comparison by Form, 2026-2036
- Figure 45: Latin America Market Attractiveness Analysis by Form
- Figure 46: Latin America Market Value Share and BPS Analysis by Pet Type, 2026 and 2036
- Figure 47: Latin America Market Y-o-Y Growth Comparison by Pet Type, 2026-2036
- Figure 48: Latin America Market Attractiveness Analysis by Pet Type
- Figure 49: Latin America Market Value Share and BPS Analysis by Application, 2026 and 2036
- Figure 50: Latin America Market Y-o-Y Growth Comparison by Application, 2026-2036
- Figure 51: Latin America Market Attractiveness Analysis by Application
- Figure 52: Europe Market Value Share and BPS Analysis by Country, 2026 and 2036
- Figure 53: Europe Market Value Share and BPS Analysis by Source, 2026 and 2036
- Figure 54: Europe Market Y-o-Y Growth Comparison by Source, 2026-2036
- Figure 55: Europe Market Attractiveness Analysis by Source
- Figure 56: Europe Market Value Share and BPS Analysis by Form, 2026 and 2036
- Figure 57: Europe Market Y-o-Y Growth Comparison by Form, 2026-2036
- Figure 58: Europe Market Attractiveness Analysis by Form
- Figure 59: Europe Market Value Share and BPS Analysis by Pet Type, 2026 and 2036
- Figure 60: Europe Market Y-o-Y Growth Comparison by Pet Type, 2026-2036
- Figure 61: Europe Market Attractiveness Analysis by Pet Type
- Figure 62: Europe Market Value Share and BPS Analysis by Application, 2026 and 2036
- Figure 63: Europe Market Y-o-Y Growth Comparison by Application, 2026-2036
- Figure 64: Europe Market Attractiveness Analysis by Application
- Figure 65: East Asia Market Value Share and BPS Analysis by Country, 2026 and 2036
- Figure 66: East Asia Market Value Share and BPS Analysis by Source, 2026 and 2036
- Figure 67: East Asia Market Y-o-Y Growth Comparison by Source, 2026-2036
- Figure 68: East Asia Market Attractiveness Analysis by Source
- Figure 69: East Asia Market Value Share and BPS Analysis by Form, 2026 and 2036
- Figure 70: East Asia Market Y-o-Y Growth Comparison by Form, 2026-2036
- Figure 71: East Asia Market Attractiveness Analysis by Form
- Figure 72: East Asia Market Value Share and BPS Analysis by Pet Type, 2026 and 2036
- Figure 73: East Asia Market Y-o-Y Growth Comparison by Pet Type, 2026-2036
- Figure 74: East Asia Market Attractiveness Analysis by Pet Type
- Figure 75: East Asia Market Value Share and BPS Analysis by Application, 2026 and 2036
- Figure 76: East Asia Market Y-o-Y Growth Comparison by Application, 2026-2036
- Figure 77: East Asia Market Attractiveness Analysis by Application
- Figure 78: South Asia Market Value Share and BPS Analysis by Country, 2026 and 2036
- Figure 79: South Asia Market Value Share and BPS Analysis by Source, 2026 and 2036
- Figure 80: South Asia Market Y-o-Y Growth Comparison by Source, 2026-2036
- Figure 81: South Asia Market Attractiveness Analysis by Source
- Figure 82: South Asia Market Value Share and BPS Analysis by Form, 2026 and 2036
- Figure 83: South Asia Market Y-o-Y Growth Comparison by Form, 2026-2036
- Figure 84: South Asia Market Attractiveness Analysis by Form
- Figure 85: South Asia Market Value Share and BPS Analysis by Pet Type, 2026 and 2036
- Figure 86: South Asia Market Y-o-Y Growth Comparison by Pet Type, 2026-2036
- Figure 87: South Asia Market Attractiveness Analysis by Pet Type
- Figure 88: South Asia Market Value Share and BPS Analysis by Application, 2026 and 2036
- Figure 89: South Asia Market Y-o-Y Growth Comparison by Application, 2026-2036
- Figure 90: South Asia Market Attractiveness Analysis by Application
- Figure 91: Oceania Market Value Share and BPS Analysis by Country, 2026 and 2036
- Figure 92: Oceania Market Value Share and BPS Analysis by Source, 2026 and 2036
- Figure 93: Oceania Market Y-o-Y Growth Comparison by Source, 2026-2036
- Figure 94: Oceania Market Attractiveness Analysis by Source
- Figure 95: Oceania Market Value Share and BPS Analysis by Form, 2026 and 2036
- Figure 96: Oceania Market Y-o-Y Growth Comparison by Form, 2026-2036
- Figure 97: Oceania Market Attractiveness Analysis by Form
- Figure 98: Oceania Market Value Share and BPS Analysis by Pet Type, 2026 and 2036
- Figure 99: Oceania Market Y-o-Y Growth Comparison by Pet Type, 2026-2036
- Figure 100: Oceania Market Attractiveness Analysis by Pet Type
- Figure 101: Oceania Market Value Share and BPS Analysis by Application, 2026 and 2036
- Figure 102: Oceania Market Y-o-Y Growth Comparison by Application, 2026-2036
- Figure 103: Oceania Market Attractiveness Analysis by Application
- Figure 104: Middle East Market Value Share and BPS Analysis by Country, 2026 and 2036
- Figure 105: Middle East Market Value Share and BPS Analysis by Source, 2026 and 2036
- Figure 106: Middle East Market Y-o-Y Growth Comparison by Source, 2026-2036
- Figure 107: Middle East Market Attractiveness Analysis by Source
- Figure 108: Middle East Market Value Share and BPS Analysis by Form, 2026 and 2036
- Figure 109: Middle East Market Y-o-Y Growth Comparison by Form, 2026-2036
- Figure 110: Middle East Market Attractiveness Analysis by Form
- Figure 111: Middle East Market Value Share and BPS Analysis by Pet Type, 2026 and 2036
- Figure 112: Middle East Market Y-o-Y Growth Comparison by Pet Type, 2026-2036
- Figure 113: Middle East Market Attractiveness Analysis by Pet Type
- Figure 114: Middle East Market Value Share and BPS Analysis by Application, 2026 and 2036
- Figure 115: Middle East Market Y-o-Y Growth Comparison by Application, 2026-2036
- Figure 116: Middle East Market Attractiveness Analysis by Application
- Figure 117: Africa Market Value Share and BPS Analysis by Country, 2026 and 2036
- Figure 118: Africa Market Value Share and BPS Analysis by Source, 2026 and 2036
- Figure 119: Africa Market Y-o-Y Growth Comparison by Source, 2026-2036
- Figure 120: Africa Market Attractiveness Analysis by Source
- Figure 121: Africa Market Value Share and BPS Analysis by Form, 2026 and 2036
- Figure 122: Africa Market Y-o-Y Growth Comparison by Form, 2026-2036
- Figure 123: Africa Market Attractiveness Analysis by Form
- Figure 124: Africa Market Value Share and BPS Analysis by Pet Type, 2026 and 2036
- Figure 125: Africa Market Y-o-Y Growth Comparison by Pet Type, 2026-2036
- Figure 126: Africa Market Attractiveness Analysis by Pet Type
- Figure 127: Africa Market Value Share and BPS Analysis by Application, 2026 and 2036
- Figure 128: Africa Market Y-o-Y Growth Comparison by Application, 2026-2036
- Figure 129: Africa Market Attractiveness Analysis by Application
- Figure 130: Global Market - Tier Structure Analysis
- Figure 131: Global Market - Company Share Analysis
Frequently Asked Questions
How big is the pet food flavor enhancers market in 2026?
FMI estimates the market at USD 1,250.0 million in 2026, up from USD 1,180.0 million in 2025. It is forecast to reach USD 2,239.0 million by 2036 at a 6.0% CAGR.
Which source leads the pet food flavor enhancers market?
Animal-based enhancers lead by source with 58.0% in 2026. Plant-based, fermentation-derived and synthetic enhancers together hold 42.0%.
Which form, pet type and application segments lead in 2026?
Dry powder holds 62.0% by form. Dogs hold 47.0% by pet type. Dry pet food holds 54.0% by application.
Which profiled country is forecast to grow fastest through 2036?
India has the highest forecast CAGR among the profiled countries at 8.4% during 2026 to 2036, followed by China at 7.6%. These are FMI forecasts and are not rates reported by the cited public bodies.
Why do pet food makers use flavor enhancers?
Palatants raise acceptance across species, breeds and life stages [11]. Palatability decides whether pets accept and keep eating a product [21]. Higher acceptance supports repeat purchase.
Preview the report firsthand - request a free sample
Get SampleGet the brochure for pricing and purchase details.
Get PDF
