Pet Food Market Forecast and Outlook 2025 to 2035

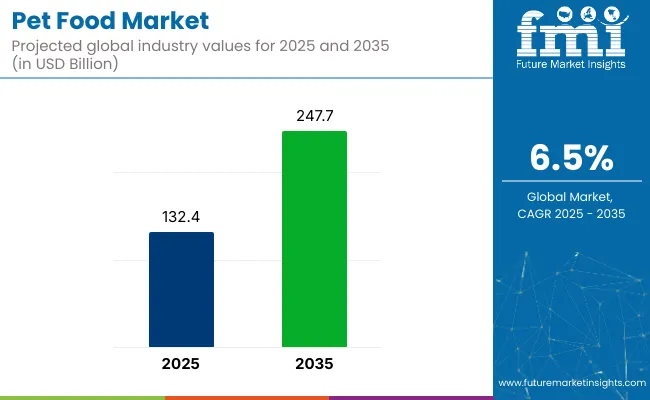
The pet food market is valued at USD 132.4 billion in 2025 and is projected to reach USD 247.7 billion by 2035, growing at a CAGR of 6.5%. The market expansion is driven by rising pet humanization, the premiumization of diets, and the shift toward tailored nutrition that addresses specific life-stage and breed requirements. The product innovation continues to enhance value propositions with formulations targeting digestive health, joint support, and immune function.
Quick Stats For the Pet Food Market

  • Market Value (2025): USD 132.4 billion
  • Forecast Value (2035): USD 247.7 billion
  • Forecast CAGR: 6.5%
  • Nature Leader in 2025: Conventional (70% market share)
  • Top Animal Type Segment: Dog (60% market share)
  • Key Growth Region: Western Europe (UK is the fastest-growing market with 6.8% CAGR)

Pet Food Market

Metric Value
Market Value (2025) USD 132.4 billion
Forecast Value (2035) USD 247.7 billion
CAGR (2025 to 2035) 6.5%

The market holds approximately 3.6% of the USD 72 billion animal nutrition market, 1.73% of the USD 150 billion pet care market, 0.072% of the USD 3.6 trillion packaged food market, and 0.026% of the USD 10 trillion global consumer goods market. Its growth is driven by rising pet ownership, demand for premium nutrition, and increasing humanization of pets worldwide.

Government regulations impacting the market focus on ensuring safety, quality, and accurate labeling of products. In the USA, the FDA’s Center for Veterinary Medicine oversees compliance with nutritional standards and ingredient approvals. In Europe, regulations under EFSA require strict safety assessments, while FEDIAF guidelines standardize pet food formulations.

Countries like Japan enforce rigorous standards under the Ministry of Agriculture for labeling and ingredient safety. Globally, regulations mandate transparency in sourcing, ban harmful additives, and require hygienic manufacturing practices to protect animal health and consumer trust, thereby shaping the operational landscape for pet food manufacturers.

The UK is projected to be the fastest-growing market, expanding at a CAGR of 6.8% from 2025 to 2035. Conventional pet food will lead the nature segment with a 70% market share, while dog food will dominate the animal type segment with a 60% share. The USA and Germany markets are also expected to grow steadily at CAGRs of 6.2% and 6.4%, respectively.

Analyzing Pet Food Market by Top Investment Segments

The pet food market is segmented by product type, source, animal type, nature, and region. By product type, the market is divided into kibble/dry (extruded, baked, coated), dehydrated food, freeze-dried cooked, freeze-dried raw, wet food, frozen, raw food, powder, and treats & chews (dog - paste, cremes, crunchy snacks, chew sticks, tablets, biscuits, jerky, rawhide; cat - pastes, crèmes, crunchy snacks, chew sticks, tablets, biscuits, cat milk/milk snacks).

Based on the source, the market is segmented into animal-derived (fish, chicken, duck, beef, pork, venison, lamb, turkey), plant-derived, and insect-derived (crickets, mealworms, black soldier flies). By animal type, the market is bifurcated into cats (kittens, seniors), dogs (puppies, adults, seniors), birds, and others (rabbits, hamsters).

By nature, it is segmented into organic, monoprotein, and conventional. Regionally, the market is classified into North America, Latin America, Western Europe, Eastern Europe, the Balkans and Baltic, Russia and Belarus, Central Asia, East Asia, South Asia and Pacific, and the Middle East and Africa.

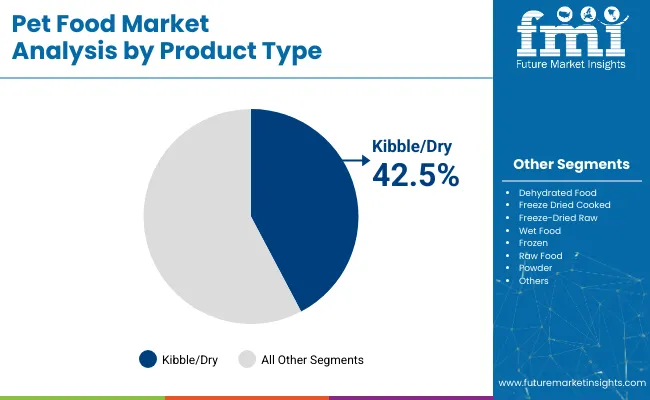
Kibble/Dry to Lead the Product Type Segment with 42.5% Market Share

The Kibble/dry food is projected to lead the product type segment, accounting for 42.5% of market share by 2025. Kibble products are typically made from animal-derived proteins, cereals, grains, and added vitamins and minerals, offering pet owners a cost-effective and convenient solution for maintaining their pet's health and dietary consistency.
  • Kibble/Dry provides dental benefits through its crunchy texture
  • Compatible with automated feeding systems in urban households
  • Continuous innovation in flavors and coatings to enhance palatability

Pet Food Market By Product Type

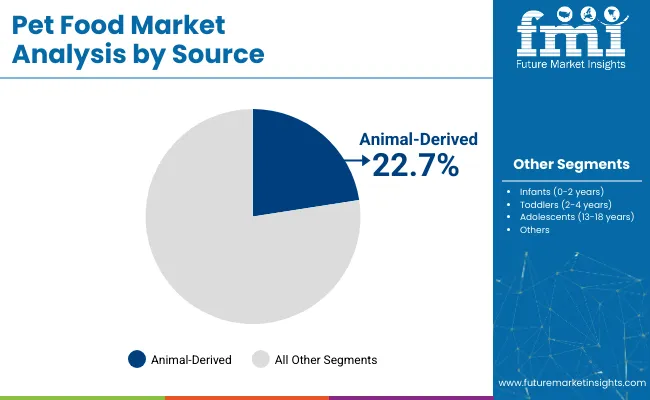
Animal-Derived to Lead the Source Segment with 22.7% Market Share

The animal-derived segment is expected to lead the source segment, accounting for approximately 22.7% of the market share in 2025. Their demand is driven by the high protein content preferred by pet owners for optimal growth and health.
  • Chicken and fish remain dominant due to digestibility and availability
  • Beef, lamb, and turkey cater to premium and specialized diet categories
  • Fish-based proteins provide omega-3 benefits for skin and coat health

Pet Food Market By Source

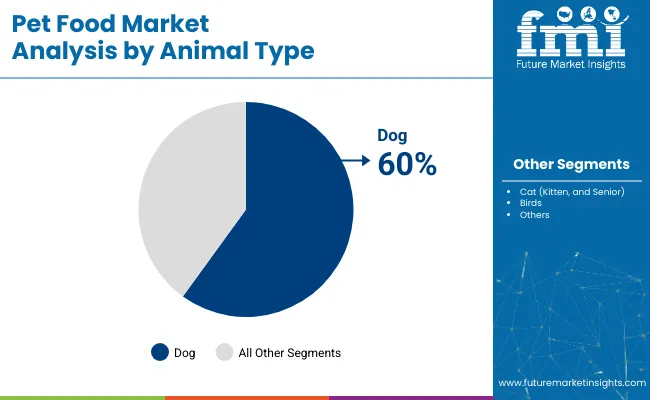
Dog to Lead the Animal Type Segment with Over 60% Market Share

The dog is expected to capture 60% of the market share in 2025. This is supported by higher pet ownership rates globally and rising demand for premium treats, age-specific formulations, and breed-targeted diets that cater to diverse nutritional needs.
  • Puppy and adult diets dominate with targeted nutrition profiles.
  • Rising demand for senior dog food is driven by aging pet populations.
  • Breed-specific diets are increasingly marketed for tailored nutrition.

Pet Food Market By Animal Type

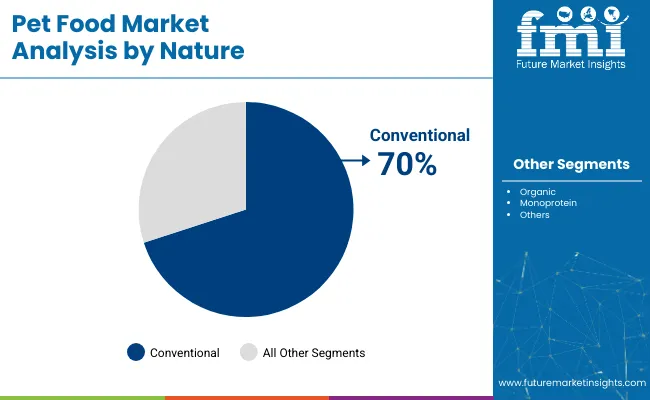
Conventional to Lead the Nature Segment with Approximately 70% Market Share.

The conventional is projected to dominate the nature segment, accounting for approximately 70% of the market share in 2025. The demand is driven by affordability, wide availability across retail channels, and trusted formulations suitable for general health maintenance in pets.
  • Conventional diets offer a balanced mix of macronutrients at affordable prices.
  • Companies continue to improve the quality and transparency of ingredients.
  • Monoprotein and organic segments are growing but remain a niche in the total market value.

Pet Food Market By Nature

Top Pet Food Market Dynamics

The pet food market has been experiencing steady growth, driven by increasing pet ownership, rising demand for premium nutrition, and a shift towards personalized, breed-specific formulations.

Recent Trends in the Pet Food Market

  • Integration of smart packaging for enhanced transparency and traceability has been increasing.
  • Genetic profiling is being adopted to create personalized nutrition plans for pets.
  • Brands are incorporating functional ingredients, such as probiotics, omega-3 fatty acids, and antioxidants, for targeted health benefits.

Challenges in the Pet Food Market

  • High production costs of premium and specialized formulations have impacted affordability.
  • Regulatory complexities concerning pet food safety standards differ across regions, creating compliance challenges.
  • Sustainability of sourcing animal-derived proteins remains a concern, driving the need for alternative solutions.

Top Countries Exporting, Distributing, and Supplying Pet Food

The UK leads the pet food market, driven by trends in premiumization and the humanization of pets, as consumers increasingly prioritize high-quality, tailored nutrition. France follows with a CAGR of 6.6%, supported by the rising demand for functional and eco-friendly pet products. Germany, expected to grow at 6.4%, is driven by a strong market for hypoallergenic and natural formulations, as well as increasing pet ownership.

The US market is expected to expand at a steady CAGR of 6.2%, driven by increased demand for organic, natural, and breed-specific diets, particularly for dogs and cats. Japan’s market, growing at 6.1%, is fueled by demand for small-breed formulations and age-specific diets, as urban households increasingly prioritize tailored nutrition. These regions highlight key growth drivers, including premiumization, humanization, and growing pet ownership, all of which contribute to the market’s steady expansion.

As the pet food industry evolves, countries such as the UK and France are witnessing a shift toward functional foods, with consumers increasingly opting for products that cater to their pets' health and well-being. Meanwhile, the USA and Japan are focused on specific formulations that cater to dietary needs based on breed, age, and size. As a result, these countries continue to be key exporters, distributors, and suppliers in the global pet food market.

The report provides an in-depth analysis of over 40 countries, with the five top-performing OECD countries highlighted below.

In-depth Analysis of Pet Food Demand in Japan

The Japanese pet food market is projected to grow at a CAGR of 6.1% from 2025 to 2035. Growth is driven by demand for specialized, age-specific, and small-breed formulations as urban households prefer tailored nutrition for pets..

  • High demand for small-breed tailored formulations
  • Expansion of premium treats and functional supplements

Growth Outlook for Pet Food in Germany

The sales of pet food in Germany are forecast to expand at a CAGR of 6.4% during the forecast period. The demand is driven by hypoallergenic and natural formulations and shifting consumer preference towards monoprotein diets addressing sensitivities and organic options ensuring transparency.

  • High demand for monoprotein diets addressing food sensitivities
  • Expansion of organic and insect-based protein products

Demand Trajectory for Industrial Pet Food in France

The French pet food market is expected to grow at a CAGR of 6.6% from 2025 to 2035, driven by premiumization, pet humanization, and demand for functional treats enhancing mobility and digestion.

  • Strong adoption of functional treats for health benefits
  • Increased popularity of organic and eco-friendly formulations

USA Pet Food Market Analysis

The USA pet food market is projected to grow at a CAGR of 6.2% from 2025 to 2035. Growth is driven by rising pet ownership, a preference for organic and natural diets, and strong demand for treats that target dental health and joint care.

  • Strong demand for organic and natural pet food formulations
  • High spending on treatments targeting dental health and joint care

Pet Food Market Sales Analysis in the UK

The UK pet food revenue is forecast to grow at a CAGR of 6.8% from 2025 to 2035. Growth is driven by premiumization, rising direct-to-consumer e-commerce sales, and breed-specific formulations tailored to meet pet health needs.

  • Demand for breed-specific and life-stage formulations is increasing
  • Organic and grain-free products are gaining traction

Leading Pet Food Suppliers and Manufacturers

The pet food market is moderately consolidated, with leading players such as Mars Petcare Inc., Nestlé Purina PetCare, Hill’s Pet Nutrition, Blue Buffalo (owned by General Mills), and Cargill Incorporated dominating the industry. These companies dominate the global landscape by offering a diverse portfolio of pet food products tailored to the nutritional needs of dogs, cats, and small animals.

Mars Petcare Inc. specializes in veterinary and breed-specific diets, while Nestlé Purina PetCare emphasizes science-backed formulations that support health conditions like digestion, weight management, and joint care. Hill’s Pet Nutrition and Blue Buffalo cater to the premium and natural food segments, driving innovation and consumer trust.

Pet food manufacturers are investing heavily in R&D, focusing on innovations like personalized nutrition, functional ingredients (e.g., probiotics and omega-3 fatty acids), and sustainable protein alternatives such as insect or plant-based sources. These developments align with the rising consumer demand for premium, health-oriented, and eco-friendly pet foods. As premium and natural segments grow at 5-7% annually, continuous R&D is driving product differentiation and market expansion..

Recent Pet Food Industry News

  • In February 2025, Pets at Home, a UK retailer, has launched "Chick Bites," dog treats made from lab-grown chicken meat, claiming a world first in this innovation. Produced by Meatly, these treats aim to provide a sustainable and ethical alternative to traditional meat products, reflecting a shift towards environmentally conscious pet food options.
  • In February 2023, Mars Petcare completed its acquisition of Champion Petfoods, a leader in premium pet food, recognized for its brands ORIJEN and ACANA, which are trusted by pet parents worldwide.

Pet Food Market Report Scope

Report Attributes Details
Current Total Market Size (2025) USD 132.4 billion
Projected Market Size (2035) USD 247.7 billion
CAGR (2025 to 2035) 6.5%
Base Year for Estimation 2024
Historical Period 2020 to 2024
Projections Period 2025 to 2035
Report Parameters Revenue in USD billion / Volume in metric tons
By Product Type Kibble/Dry (Extruded, Baked, Coated), Dehydrated Food, Freeze Dried Cooked, Freeze-Dried Raw, Wet Food, Frozen, Raw Food, Powder, Treats and Chews, Dog (Paste, Crèmes, Crunchy snacks, Chew sticks, Tablets, Biscuits, Jerky, Rawhide), Cat (Pastes, Crèmes, Crunchy snacks, Chew sticks, Tablets, Biscuits, Cat Milk / Milk snacks)
By Source Animal-Derived (Fish, Chicken, Duck, Beef, Pork, Venison, Lamb, Turkey), Plant-Derived, Insect-Derived (Crickets, Mealworms, Black Soldier Flies)
By Animal Type Cat (Kitten, Senior), Dog (Puppy, Adult, Senior), Birds, Others (Rabbits, Hamsters, etc.)
By Nature Organic, Monoprotein, and Conventional
Regions Covered North America, Latin America, Western Europe, Eastern Europe, Balkans & Baltic, Russia & Belarus, Central Asia, East Asia, South Asia Pacific, Middle East and Africa
Countries Covered United States, Canada, United Kingdom, Germany, France, China, Japan, South Korea, Brazil, Australia
Key Players Simmons, Inc., Merrick Pet Care, Inc., Champion Petfoods LP, Nature's Variety, Archer Daniels Midland Company (ADM), Cargill, Incorporated, Hill's Pet Nutrition, General Mills, Inc. (Blue Buffalo), Mars Petcare Inc., Nestlé Purina PetCare, Hill's Pet Nutrition, J.M. Smucker Company, Diamonds, Blue Buffalo Co., Ltd., Spectrum Brands Holdings, Inc., Unicharm Corporation, Deuerer GmbH, Sunshine Mills, Inc., Nutriara Alimentos Ltda., Unicharm PetCare Corporation.
Additional Attributes Market share analysis by product type and source, country-wise CAGR analysis, and brand positioning insights

Top Investment Segments in the Pet Food Market

By Nature:

As per Nature, the industry has been categorized into Organic, Monoprotein, and Conventional.

By Product Type:

As per Product Type, the industry has been categorized into Kibble/Dry (Extruded, Baked, Coated), Dehydrated Food, Freeze Dried Cooked, Freeze-Dried Raw, Wet Food, Frozen, Raw Food, Powder, Treats and Chews [Dog (Pastes, Crèmes, Crunchy snacks, Chew sticks, Tablets, Biscuits, Jerky, Rawhide), Cat (Pastes, Crèmes, Crunchy snacks, Chew sticks, Tablets, Biscuits, Cat Milk / Milk snacks)].

By Source:

This segment is further categorized into Animal-Derived (Fish, Chicken, Duck, Beef, Pork, Venison, Lamb, and Turkey), Plant-Derived, Insect-Derived (Crickets, Mealworms, Black Solider Flies).

By Animal Type:

As per animal type this segment is categorized into Cat (Kitten, and Senior), Dog (Puppy, Adult, and Senior), Birds, and Others (Rabbits, Hamsters, etc.).

By Region:

Industry analysis has been carried out in key countries of North America, Latin America, Western Europe, Eastern Europe, East Asia, South Asia & Pacific, Central Asia, Russia & Belarus, Baltic and Balkans Countries and the Middle East & Africa.

Table of Content

  1. Executive Summary
    • Global Market Outlook
    • Demand-side Trends
    • Supply-side Trends
    • Technology Roadmap Analysis
    • Analysis and Recommendations
  2. Market Overview
    • Market Coverage / Taxonomy
    • Market Definition / Scope / Limitations
  3. Market Background
    • Market Dynamics
      • Drivers
      • Restraints
      • Opportunity
      • Trends
    • Scenario Forecast
      • Demand in Optimistic Scenario
      • Demand in Likely Scenario
      • Demand in Conservative Scenario
    • Opportunity Map Analysis
    • Product Life Cycle Analysis
    • Supply Chain Analysis
      • Supply Side Participants and their Roles
        • Producers
        • Mid-Level Participants (Traders/ Agents/ Brokers)
        • Wholesalers and Distributors
      • Value Added and Value Created at Node in the Supply Chain
      • List of Raw Material Suppliers
      • List of Existing and Potential Buyer’s
    • Investment Feasibility Matrix
    • Value Chain Analysis
      • Profit Margin Analysis
      • Wholesalers and Distributors
      • Retailers
    • PESTLE and Porter’s Analysis
    • Regulatory Landscape
      • By Key Regions
      • By Key Countries
    • Regional Parent Market Outlook
    • Production and Consumption Statistics
    • Import and Export Statistics
  4. Global Market Analysis 2020 to 2024 and Forecast, 2025 to 2035
    • Historical Market Size Value (USD Billion) & Volume (Metric Tons) Analysis, 2020 to 2024
    • Current and Future Market Size Value (USD Billion) & Volume (Metric Tons) Projections, 2025 to 2035
      • Y-o-Y Growth Trend Analysis
      • Absolute $ Opportunity Analysis
  5. Global Market Pricing Analysis 2020 to 2024 and Forecast 2025 to 2035
  6. Global Market Analysis 2020 to 2024 and Forecast 2025 to 2035, By Product Type
    • Introduction / Key Findings
    • Historical Market Size Value (USD Billion) & Volume (Metric Tons) Analysis By Product Type, 2020 to 2024
    • Current and Future Market Size Value (USD Billion) & Volume (Metric Tons) Analysis and Forecast By Product Type, 2025 to 2035
      • Kibble/Dry
        • Extruded
        • Baked
        • Coated
      • Dehydrated Food
      • Freeze Dried Cooked
      • Freeze-Dried Raw
      • Wet Food
      • Frozen
      • Raw Food
      • Powder
      • Treats and Chews
        • Dog (paste, cremes, crunchy snacks, chew sticks, tablets, biscuits, jerky, rawhide)
        • Cat (pastes, cremes, crunchy snacks, chew sticks, tablets, biscuits, cat milk/milk snacks)
    • Y-o-Y Growth Trend Analysis By Product Type, 2020 to 2024
    • Absolute $ Opportunity Analysis By Product Type, 2025 to 2035
  7. Global Market Analysis 2020 to 2024 and Forecast 2025 to 2035, By Source
    • Introduction / Key Findings
    • Historical Market Size Value (USD Billion) & Volume (Metric Tons) Analysis By Source, 2020 to 2024
    • Current and Future Market Size Value (USD Billion) & Volume (Metric Tons) Analysis and Forecast By Source, 2025 to 2035
      • Animal-Derived
        • Fish
        • Chicken
        • Duck
        • Beef
        • Pork
        • Venison
        • Lamb
        • Turkey
      • Plant-Derived
      • Insect-Derived
        • Crickets
        • Mealworms
        • Black Soldier Flies
    • Y-o-Y Growth Trend Analysis By Source, 2020 to 2024
    • Absolute $ Opportunity Analysis By Source, 2025 to 2035
  8. Global Market Analysis 2020 to 2024 and Forecast 2025 to 2035, By Animal Type
    • Introduction / Key Findings
    • Historical Market Size Value (USD Billion) & Volume (Metric Tons) Analysis By Animal Type, 2020 to 2024
    • Current and Future Market Size Value (USD Billion) & Volume (Metric Tons) Analysis and Forecast By Animal Type, 2025 to 2035
      • Cat
        • Kitten
        • Senior
      • Dog
        • Puppy
        • Adult
        • Senior
      • Birds
      • Others (Rabbits, Hamsters, etc.)
    • Y-o-Y Growth Trend Analysis By Animal Type, 2020 to 2024
    • Absolute $ Opportunity Analysis By Animal Type, 2025 to 2035
  9. Global Market Analysis 2020 to 2024 and Forecast 2025 to 2035, By Nature
    • Introduction / Key Findings
    • Historical Market Size Value (USD Billion) & Volume (Metric Tons) Analysis By Nature, 2020 to 2024
    • Current and Future Market Size Value (USD Billion) & Volume (Metric Tons) Analysis and Forecast By Nature, 2025 to 2035
      • Organic
      • Monoprotein
      • Conventional
    • Y-o-Y Growth Trend Analysis By Nature, 2020 to 2024
    • Absolute $ Opportunity Analysis By Nature, 2025 to 2035
  10. Global Market Analysis 2020 to 2024 and Forecast 2025 to 2035, By Region
    • Introduction
    • Historical Market Size Value (USD Billion) & Volume (Metric Tons) Analysis By Region, 2020 to 2024
    • Current Market Size Value (USD Billion) & Volume (Metric Tons) Analysis and Forecast By Region, 2025 to 2035
      • North America
      • Latin America
      • Western Europe
      • Eastern Europe
      • East Asia
      • South Asia & Pacific
      • Middle East and Africa
    • Market Attractiveness Analysis By Region
  11. North America Market Analysis 2020 to 2024 and Forecast 2025 to 2035, By Country
    • Historical Market Size Value (USD Billion) & Volume (Metric Tons) Trend Analysis By Market Taxonomy, 2020 to 2024
    • Market Size Value (USD Billion) & Volume (Metric Tons) Forecast By Market Taxonomy, 2025 to 2035
      • By Country
        • USA
        • Canada
        • Mexico
      • By Product Type
      • By Source
      • By Animal Type
      • By Nature
    • Market Attractiveness Analysis
      • By Country
      • By Product Type
      • By Source
      • By Animal Type
      • By Nature
    • Key Takeaways
  12. Latin America Market Analysis 2020 to 2024 and Forecast 2025 to 2035, By Country
    • Historical Market Size Value (USD Billion) & Volume (Metric Tons) Trend Analysis By Market Taxonomy, 2020 to 2024
    • Market Size Value (USD Billion) & Volume (Metric Tons) Forecast By Market Taxonomy, 2025 to 2035
      • By Country
        • Brazil
        • Argentina
        • Rest of LATAM
      • By Product Type
      • By Source
      • By Animal Type
      • By Nature
    • Market Attractiveness Analysis
      • By Country
      • By Product Type
      • By Source
      • By Animal Type
      • By Nature
    • Key Takeaways
  13. Western Europe Market Analysis 2020 to 2024 and Forecast 2025 to 2035, By Country
    • Historical Market Size Value (USD Billion) & Volume (Metric Tons) Trend Analysis By Market Taxonomy, 2020 to 2024
    • Market Size Value (USD Billion) & Volume (Metric Tons) Forecast By Market Taxonomy, 2025 to 2035
      • By Country
        • Germany
        • Italy
        • France
        • UK
        • Spain
        • BENELUX
        • Nordic
        • Rest of W.Europe
      • By Product Type
      • By Source
      • By Animal Type
      • By Nature
    • Market Attractiveness Analysis
      • By Country
      • By Product Type
      • By Source
      • By Animal Type
      • By Nature
    • Key Takeaways
  14. Eastern Europe Market Analysis 2020 to 2024 and Forecast 2025 to 2035, By Country
    • Historical Market Size Value (USD Billion) & Volume (Metric Tons) Trend Analysis By Market Taxonomy, 2020 to 2024
    • Market Size Value (USD Billion) & Volume (Metric Tons) Forecast By Market Taxonomy, 2025 to 2035
      • By Country
        • Russia
        • Hungary
        • Poland
        • Balkan & Baltics
        • Rest of E. Europe
      • By Product Type
      • By Source
      • By Animal Type
      • By Nature
    • Market Attractiveness Analysis
      • By Country
      • By Product Type
      • By Source
      • By Animal Type
      • By Nature
    • Key Takeaways
  15. East Asia Market Analysis 2020 to 2024 and Forecast 2025 to 2035, By Country
    • Historical Market Size Value (USD Billion) & Volume (Metric Tons) Trend Analysis By Market Taxonomy, 2020 to 2024
    • Market Size Value (USD Billion) & Volume (Metric Tons) Forecast By Market Taxonomy, 2025 to 2035
      • By Country
        • China
        • Japan
        • South Korea
      • By Product Type
      • By Source
      • By Animal Type
      • By Nature
    • Market Attractiveness Analysis
      • By Country
      • By Product Type
      • By Source
      • By Animal Type
      • By Nature
    • Key Takeaways
  16. South Asia & Pacific Market Analysis 2020 to 2024 and Forecast 2025 to 2035, By Country
    • Historical Market Size Value (USD Billion) & Volume (Metric Tons) Trend Analysis By Market Taxonomy, 2020 to 2024
    • Market Size Value (USD Billion) & Volume (Metric Tons) Forecast By Market Taxonomy, 2025 to 2035
      • By Country
        • India
        • Australia & New Zealand
        • ASEAN
        • Rest of SAP
      • By Product Type
      • By Source
      • By Animal Type
      • By Nature
    • Market Attractiveness Analysis
      • By Country
      • By Product Type
      • By Source
      • By Animal Type
      • By Nature
    • Key Takeaways
  17. Middle East and Africa Market Analysis 2020 to 2024 and Forecast 2025 to 2035, By Country
    • Historical Market Size Value (USD Billion) & Volume (Metric Tons) Trend Analysis By Market Taxonomy, 2020 to 2024
    • Market Size Value (USD Billion) & Volume (Metric Tons) Forecast By Market Taxonomy, 2025 to 2035
      • By Country
        • GCC Countries
        • Northern Africa
        • South Africa
        • Turkiye
        • Rest of MEA
      • By Product Type
      • By Source
      • By Animal Type
      • By Nature
    • Market Attractiveness Analysis
      • By Country
      • By Product Type
      • By Source
      • By Animal Type
      • By Nature
    • Key Takeaways
  18. Key Countries Market Analysis
    • USA
      • Pricing Analysis
      • Market Share Analysis, 2024
        • By Product Type
        • By Source
        • By Animal Type
        • By Nature
    • Canada
      • Pricing Analysis
      • Market Share Analysis, 2024
        • By Product Type
        • By Source
        • By Animal Type
        • By Nature
    • Brazil
      • Pricing Analysis
      • Market Share Analysis, 2024
        • By Product Type
        • By Source
        • By Animal Type
        • By Nature
    • Mexico
      • Pricing Analysis
      • Market Share Analysis, 2024
        • By Product Type
        • By Source
        • By Animal Type
        • By Nature
    • Argentina
      • Pricing Analysis
      • Market Share Analysis, 2024
        • By Product Type
        • By Source
        • By Animal Type
        • By Nature
  19. Market Structure Analysis
    • Competition Dashboard
    • Competition Benchmarking
    • Market Share Analysis of Top Players
      • By Regional
      • By Product Type
      • By Source
      • By Animal Type
      • By Nature
  20. Competition Analysis
    • Competition Deep Dive
      • Simmons, Inc.
        • Overview
        • Product Portfolio
        • Profitability by Market Segments (Product/Age /Sales Channel/Region)
        • Sales Footprint
        • Strategy Overview
          • Marketing Strategy
          • Product Strategy
          • Channel Strategy
      • Merrick Pet Care, Inc.
        • Overview
        • Product Portfolio
        • Profitability by Market Segments (Product/Age /Sales Channel/Region)
        • Sales Footprint
        • Strategy Overview
          • Marketing Strategy
          • Product Strategy
          • Channel Strategy
      • Champion Petfoods LP
        • Overview
        • Product Portfolio
        • Profitability by Market Segments (Product/Age /Sales Channel/Region)
        • Sales Footprint
        • Strategy Overview
          • Marketing Strategy
          • Product Strategy
          • Channel Strategy
      • Nature's Variety
        • Overview
        • Product Portfolio
        • Profitability by Market Segments (Product/Age /Sales Channel/Region)
        • Sales Footprint
        • Strategy Overview
          • Marketing Strategy
          • Product Strategy
          • Channel Strategy
      • Archer Daniels Midland Company (ADM)
        • Overview
        • Product Portfolio
        • Profitability by Market Segments (Product/Age /Sales Channel/Region)
        • Sales Footprint
        • Strategy Overview
          • Marketing Strategy
          • Product Strategy
          • Channel Strategy
      • Cargill, Incorporated
        • Overview
        • Product Portfolio
        • Profitability by Market Segments (Product/Age /Sales Channel/Region)
        • Sales Footprint
        • Strategy Overview
          • Marketing Strategy
          • Product Strategy
          • Channel Strategy
      • Hill's Pet Nutrition
        • Overview
        • Product Portfolio
        • Profitability by Market Segments (Product/Age /Sales Channel/Region)
        • Sales Footprint
        • Strategy Overview
          • Marketing Strategy
          • Product Strategy
          • Channel Strategy
      • General Mills, Inc. (Blue Buffalo)
        • Overview
        • Product Portfolio
        • Profitability by Market Segments (Product/Age /Sales Channel/Region)
        • Sales Footprint
        • Strategy Overview
          • Marketing Strategy
          • Product Strategy
          • Channel Strategy
      • Mars Petcare Inc.
        • Overview
        • Product Portfolio
        • Profitability by Market Segments (Product/Age /Sales Channel/Region)
        • Sales Footprint
        • Strategy Overview
          • Marketing Strategy
          • Product Strategy
          • Channel Strategy
      • Nestlé Purina PetCare
        • Overview
        • Product Portfolio
        • Profitability by Market Segments (Product/Age /Sales Channel/Region)
        • Sales Footprint
        • Strategy Overview
          • Marketing Strategy
          • Product Strategy
          • Channel Strategy
      • Hill's Pet Nutrition
        • Overview
        • Product Portfolio
        • Profitability by Market Segments (Product/Age /Sales Channel/Region)
        • Sales Footprint
        • Strategy Overview
          • Marketing Strategy
          • Product Strategy
          • Channel Strategy
      • J.M. Smucker Company
        • Overview
        • Product Portfolio
        • Profitability by Market Segments (Product/Age /Sales Channel/Region)
        • Sales Footprint
        • Strategy Overview
          • Marketing Strategy
          • Product Strategy
          • Channel Strategy
      • Diamonds
        • Overview
        • Product Portfolio
        • Profitability by Market Segments (Product/Age /Sales Channel/Region)
        • Sales Footprint
        • Strategy Overview
          • Marketing Strategy
          • Product Strategy
          • Channel Strategy
      • Blue Buffalo Co., Ltd.
        • Overview
        • Product Portfolio
        • Profitability by Market Segments (Product/Age /Sales Channel/Region)
        • Sales Footprint
        • Strategy Overview
          • Marketing Strategy
          • Product Strategy
          • Channel Strategy
      • Spectrum Brands Holdings, Inc.
        • Overview
        • Product Portfolio
        • Profitability by Market Segments (Product/Age /Sales Channel/Region)
        • Sales Footprint
        • Strategy Overview
          • Marketing Strategy
          • Product Strategy
          • Channel Strategy
      • Unicharm Corporation
        • Overview
        • Product Portfolio
        • Profitability by Market Segments (Product/Age /Sales Channel/Region)
        • Sales Footprint
        • Strategy Overview
          • Marketing Strategy
          • Product Strategy
          • Channel Strategy
      • Deuerer GmbH
        • Overview
        • Product Portfolio
        • Profitability by Market Segments (Product/Age /Sales Channel/Region)
        • Sales Footprint
        • Strategy Overview
          • Marketing Strategy
          • Product Strategy
          • Channel Strategy
      • Sunshine Mills, Inc.
        • Overview
        • Product Portfolio
        • Profitability by Market Segments (Product/Age /Sales Channel/Region)
        • Sales Footprint
        • Strategy Overview
          • Marketing Strategy
          • Product Strategy
          • Channel Strategy
      • Nutriara Alimentos Ltda.
        • Overview
        • Product Portfolio
        • Profitability by Market Segments (Product/Age /Sales Channel/Region)
        • Sales Footprint
        • Strategy Overview
          • Marketing Strategy
          • Product Strategy
          • Channel Strategy
      • Unicharm PetCare Corporation
        • Overview
        • Product Portfolio
        • Profitability by Market Segments (Product/Age /Sales Channel/Region)
        • Sales Footprint
        • Strategy Overview
          • Marketing Strategy
          • Product Strategy
          • Channel Strategy
  21. Assumptions & Acronyms Used
  22. Research Methodology

List of Tables

  • Table 1: Global Market Value (USD Billion) Forecast by Region, 2020-2035
  • Table 2: Global Market Volume (Metric Tons) Forecast by Region, 2020-2035
  • Table 3: Global Market Value (USD Billion) Forecast by Product Type, 2020-2035
  • Table 4: Global Market Volume (Metric Tons) Forecast by Product Type, 2020-2035
  • Table 5: Global Market Value (USD Billion) Forecast by Source, 2020-2035
  • Table 6: Global Market Volume (Metric Tons) Forecast by Source, 2020-2035
  • Table 7: Global Market Value (USD Billion) Forecast by Animal Type, 2020-2035
  • Table 8: Global Market Volume (Metric Tons) Forecast by Animal Type, 2020-2035
  • Table 9: Global Market Value (USD Billion) Forecast by Nature, 2020-2035
  • Table 10: Global Market Volume (Metric Tons) Forecast by Nature, 2020-2035
  • Table 11: North America Market Value (USD Billion) Forecast by Country, 2020-2035
  • Table 12: North America Market Volume (Metric Tons) Forecast by Country, 2020-2035
  • Table 13: North America Market Value (USD Billion) Forecast by Product Type, 2020-2035
  • Table 14: North America Market Volume (Metric Tons) Forecast by Product Type, 2020-2035
  • Table 15: North America Market Value (USD Billion) Forecast by Source, 2020-2035
  • Table 16: North America Market Volume (Metric Tons) Forecast by Source, 2020-2035
  • Table 17: North America Market Value (USD Billion) Forecast by Animal Type, 2020-2035
  • Table 18: North America Market Volume (Metric Tons) Forecast by Animal Type, 2020-2035
  • Table 19: North America Market Value (USD Billion) Forecast by Nature, 2020-2035
  • Table 20: North America Market Volume (Metric Tons) Forecast by Nature, 2020-2035
  • Table 21: Latin America Market Value (USD Billion) Forecast by Country, 2020-2035
  • Table 22: Latin America Market Volume (Metric Tons) Forecast by Country, 2020-2035
  • Table 23: Latin America Market Value (USD Billion) Forecast by Product Type, 2020-2035
  • Table 24: Latin America Market Volume (Metric Tons) Forecast by Product Type, 2020-2035
  • Table 25: Latin America Market Value (USD Billion) Forecast by Source, 2020-2035
  • Table 26: Latin America Market Volume (Metric Tons) Forecast by Source, 2020-2035
  • Table 27: Latin America Market Value (USD Billion) Forecast by Animal Type, 2020-2035
  • Table 28: Latin America Market Volume (Metric Tons) Forecast by Animal Type, 2020-2035
  • Table 29: Latin America Market Value (USD Billion) Forecast by Nature, 2020-2035
  • Table 30: Latin America Market Volume (Metric Tons) Forecast by Nature, 2020-2035
  • Table 31: Western Europe Market Value (USD Billion) Forecast by Country, 2020-2035
  • Table 32: Western Europe Market Volume (Metric Tons) Forecast by Country, 2020-2035
  • Table 33: Western Europe Market Value (USD Billion) Forecast by Product Type, 2020-2035
  • Table 34: Western Europe Market Volume (Metric Tons) Forecast by Product Type, 2020-2035
  • Table 35: Western Europe Market Value (USD Billion) Forecast by Source, 2020-2035
  • Table 36: Western Europe Market Volume (Metric Tons) Forecast by Source, 2020-2035
  • Table 37: Western Europe Market Value (USD Billion) Forecast by Animal Type, 2020-2035
  • Table 38: Western Europe Market Volume (Metric Tons) Forecast by Animal Type, 2020-2035
  • Table 39: Western Europe Market Value (USD Billion) Forecast by Nature, 2020-2035
  • Table 40: Western Europe Market Volume (Metric Tons) Forecast by Nature, 2020-2035
  • Table 41: Eastern Europe Market Value (USD Billion) Forecast by Country, 2020-2035
  • Table 42: Eastern Europe Market Volume (Metric Tons) Forecast by Country, 2020-2035
  • Table 43: Eastern Europe Market Value (USD Billion) Forecast by Product Type, 2020-2035
  • Table 44: Eastern Europe Market Volume (Metric Tons) Forecast by Product Type, 2020-2035
  • Table 45: Eastern Europe Market Value (USD Billion) Forecast by Source, 2020-2035
  • Table 46: Eastern Europe Market Volume (Metric Tons) Forecast by Source, 2020-2035
  • Table 47: Eastern Europe Market Value (USD Billion) Forecast by Animal Type, 2020-2035
  • Table 48: Eastern Europe Market Volume (Metric Tons) Forecast by Animal Type, 2020-2035
  • Table 49: Eastern Europe Market Value (USD Billion) Forecast by Nature, 2020-2035
  • Table 50: Eastern Europe Market Volume (Metric Tons) Forecast by Nature, 2020-2035
  • Table 51: East Asia Market Value (USD Billion) Forecast by Country, 2020-2035
  • Table 52: East Asia Market Volume (Metric Tons) Forecast by Country, 2020-2035
  • Table 53: East Asia Market Value (USD Billion) Forecast by Product Type, 2020-2035
  • Table 54: East Asia Market Volume (Metric Tons) Forecast by Product Type, 2020-2035
  • Table 55: East Asia Market Value (USD Billion) Forecast by Source, 2020-2035
  • Table 56: East Asia Market Volume (Metric Tons) Forecast by Source, 2020-2035
  • Table 57: East Asia Market Value (USD Billion) Forecast by Animal Type, 2020-2035
  • Table 58: East Asia Market Volume (Metric Tons) Forecast by Animal Type, 2020-2035
  • Table 59: East Asia Market Value (USD Billion) Forecast by Nature, 2020-2035
  • Table 60: East Asia Market Volume (Metric Tons) Forecast by Nature, 2020-2035
  • Table 61: South Asia & Pacific Market Value (USD Billion) Forecast by Country, 2020-2035
  • Table 62: South Asia & Pacific Market Volume (Metric Tons) Forecast by Country, 2020-2035
  • Table 63: South Asia & Pacific Market Value (USD Billion) Forecast by Product Type, 2020-2035
  • Table 64: South Asia & Pacific Market Volume (Metric Tons) Forecast by Product Type, 2020-2035
  • Table 65: South Asia & Pacific Market Value (USD Billion) Forecast by Source, 2020-2035
  • Table 66: South Asia & Pacific Market Volume (Metric Tons) Forecast by Source, 2020-2035
  • Table 67: South Asia & Pacific Market Value (USD Billion) Forecast by Animal Type, 2020-2035
  • Table 68: South Asia & Pacific Market Volume (Metric Tons) Forecast by Animal Type, 2020-2035
  • Table 69: South Asia & Pacific Market Value (USD Billion) Forecast by Nature, 2020-2035
  • Table 70: South Asia & Pacific Market Volume (Metric Tons) Forecast by Nature, 2020-2035
  • Table 71: Middle East and Africa Market Value (USD Billion) Forecast by Country, 2020-2035
  • Table 72: Middle East and Africa Market Volume (Metric Tons) Forecast by Country, 2020-2035
  • Table 73: Middle East and Africa Market Value (USD Billion) Forecast by Product Type, 2020-2035
  • Table 74: Middle East and Africa Market Volume (Metric Tons) Forecast by Product Type, 2020-2035
  • Table 75: Middle East and Africa Market Value (USD Billion) Forecast by Source, 2020-2035
  • Table 76: Middle East and Africa Market Volume (Metric Tons) Forecast by Source, 2020-2035
  • Table 77: Middle East and Africa Market Value (USD Billion) Forecast by Animal Type, 2020-2035
  • Table 78: Middle East and Africa Market Volume (Metric Tons) Forecast by Animal Type, 2020-2035
  • Table 79: Middle East and Africa Market Value (USD Billion) Forecast by Nature, 2020-2035
  • Table 80: Middle East and Africa Market Volume (Metric Tons) Forecast by Nature, 2020-2035

List of Figures

  • Figure 1: Global Market Volume (Metric Tons) Forecast 2020-2035
  • Figure 2: Global Market Pricing Analysis
  • Figure 3: Global Market Value (USD Billion) Forecast 2020-2035
  • Figure 4: Global Market Value Share and BPS Analysis by Product Type, 2025 and 2035
  • Figure 5: Global Market Y-o-Y Growth Comparison by Product Type, 2025-2035
  • Figure 6: Global Market Attractiveness Analysis by Product Type
  • Figure 7: Global Market Value Share and BPS Analysis by Source, 2025 and 2035
  • Figure 8: Global Market Y-o-Y Growth Comparison by Source, 2025-2035
  • Figure 9: Global Market Attractiveness Analysis by Source
  • Figure 10: Global Market Value Share and BPS Analysis by Animal Type, 2025 and 2035
  • Figure 11: Global Market Y-o-Y Growth Comparison by Animal Type, 2025-2035
  • Figure 12: Global Market Attractiveness Analysis by Animal Type
  • Figure 13: Global Market Value Share and BPS Analysis by Nature, 2025 and 2035
  • Figure 14: Global Market Y-o-Y Growth Comparison by Nature, 2025-2035
  • Figure 15: Global Market Attractiveness Analysis by Nature
  • Figure 16: Global Market Value (USD Billion) Share and BPS Analysis by Region, 2025 and 2035
  • Figure 17: Global Market Y-o-Y Growth Comparison by Region, 2025-2035
  • Figure 18: Global Market Attractiveness Analysis by Region
  • Figure 19: North America Market Incremental $ Opportunity, 2025-2035
  • Figure 20: Latin America Market Incremental $ Opportunity, 2025-2035
  • Figure 21: Western Europe Market Incremental $ Opportunity, 2025-2035
  • Figure 22: Eastern Europe Market Incremental $ Opportunity, 2025-2035
  • Figure 23: East Asia Market Incremental $ Opportunity, 2025-2035
  • Figure 24: South Asia & Pacific Market Incremental $ Opportunity, 2025-2035
  • Figure 25: Middle East and Africa Market Incremental $ Opportunity, 2025-2035
  • Figure 26: North America Market Value Share and BPS Analysis by Country, 2025 and 2035
  • Figure 27: North America Market Value Share and BPS Analysis by Product Type, 2025 and 2035
  • Figure 28: North America Market Y-o-Y Growth Comparison by Product Type, 2025-2035
  • Figure 29: North America Market Attractiveness Analysis by Product Type
  • Figure 30: North America Market Value Share and BPS Analysis by Source, 2025 and 2035
  • Figure 31: North America Market Y-o-Y Growth Comparison by Source, 2025-2035
  • Figure 32: North America Market Attractiveness Analysis by Source
  • Figure 33: North America Market Value Share and BPS Analysis by Animal Type, 2025 and 2035
  • Figure 34: North America Market Y-o-Y Growth Comparison by Animal Type, 2025-2035
  • Figure 35: North America Market Attractiveness Analysis by Animal Type
  • Figure 36: North America Market Value Share and BPS Analysis by Nature, 2025 and 2035
  • Figure 37: North America Market Y-o-Y Growth Comparison by Nature, 2025-2035
  • Figure 38: North America Market Attractiveness Analysis by Nature
  • Figure 39: Latin America Market Value Share and BPS Analysis by Country, 2025 and 2035
  • Figure 40: Latin America Market Value Share and BPS Analysis by Product Type, 2025 and 2035
  • Figure 41: Latin America Market Y-o-Y Growth Comparison by Product Type, 2025-2035
  • Figure 42: Latin America Market Attractiveness Analysis by Product Type
  • Figure 43: Latin America Market Value Share and BPS Analysis by Source, 2025 and 2035
  • Figure 44: Latin America Market Y-o-Y Growth Comparison by Source, 2025-2035
  • Figure 45: Latin America Market Attractiveness Analysis by Source
  • Figure 46: Latin America Market Value Share and BPS Analysis by Animal Type, 2025 and 2035
  • Figure 47: Latin America Market Y-o-Y Growth Comparison by Animal Type, 2025-2035
  • Figure 48: Latin America Market Attractiveness Analysis by Animal Type
  • Figure 49: Latin America Market Value Share and BPS Analysis by Nature, 2025 and 2035
  • Figure 50: Latin America Market Y-o-Y Growth Comparison by Nature, 2025-2035
  • Figure 51: Latin America Market Attractiveness Analysis by Nature
  • Figure 52: Western Europe Market Value Share and BPS Analysis by Country, 2025 and 2035
  • Figure 53: Western Europe Market Value Share and BPS Analysis by Product Type, 2025 and 2035
  • Figure 54: Western Europe Market Y-o-Y Growth Comparison by Product Type, 2025-2035
  • Figure 55: Western Europe Market Attractiveness Analysis by Product Type
  • Figure 56: Western Europe Market Value Share and BPS Analysis by Source, 2025 and 2035
  • Figure 57: Western Europe Market Y-o-Y Growth Comparison by Source, 2025-2035
  • Figure 58: Western Europe Market Attractiveness Analysis by Source
  • Figure 59: Western Europe Market Value Share and BPS Analysis by Animal Type, 2025 and 2035
  • Figure 60: Western Europe Market Y-o-Y Growth Comparison by Animal Type, 2025-2035
  • Figure 61: Western Europe Market Attractiveness Analysis by Animal Type
  • Figure 62: Western Europe Market Value Share and BPS Analysis by Nature, 2025 and 2035
  • Figure 63: Western Europe Market Y-o-Y Growth Comparison by Nature, 2025-2035
  • Figure 64: Western Europe Market Attractiveness Analysis by Nature
  • Figure 65: Eastern Europe Market Value Share and BPS Analysis by Country, 2025 and 2035
  • Figure 66: Eastern Europe Market Value Share and BPS Analysis by Product Type, 2025 and 2035
  • Figure 67: Eastern Europe Market Y-o-Y Growth Comparison by Product Type, 2025-2035
  • Figure 68: Eastern Europe Market Attractiveness Analysis by Product Type
  • Figure 69: Eastern Europe Market Value Share and BPS Analysis by Source, 2025 and 2035
  • Figure 70: Eastern Europe Market Y-o-Y Growth Comparison by Source, 2025-2035
  • Figure 71: Eastern Europe Market Attractiveness Analysis by Source
  • Figure 72: Eastern Europe Market Value Share and BPS Analysis by Animal Type, 2025 and 2035
  • Figure 73: Eastern Europe Market Y-o-Y Growth Comparison by Animal Type, 2025-2035
  • Figure 74: Eastern Europe Market Attractiveness Analysis by Animal Type
  • Figure 75: Eastern Europe Market Value Share and BPS Analysis by Nature, 2025 and 2035
  • Figure 76: Eastern Europe Market Y-o-Y Growth Comparison by Nature, 2025-2035
  • Figure 77: Eastern Europe Market Attractiveness Analysis by Nature
  • Figure 78: East Asia Market Value Share and BPS Analysis by Country, 2025 and 2035
  • Figure 79: East Asia Market Value Share and BPS Analysis by Product Type, 2025 and 2035
  • Figure 80: East Asia Market Y-o-Y Growth Comparison by Product Type, 2025-2035
  • Figure 81: East Asia Market Attractiveness Analysis by Product Type
  • Figure 82: East Asia Market Value Share and BPS Analysis by Source, 2025 and 2035
  • Figure 83: East Asia Market Y-o-Y Growth Comparison by Source, 2025-2035
  • Figure 84: East Asia Market Attractiveness Analysis by Source
  • Figure 85: East Asia Market Value Share and BPS Analysis by Animal Type, 2025 and 2035
  • Figure 86: East Asia Market Y-o-Y Growth Comparison by Animal Type, 2025-2035
  • Figure 87: East Asia Market Attractiveness Analysis by Animal Type
  • Figure 88: East Asia Market Value Share and BPS Analysis by Nature, 2025 and 2035
  • Figure 89: East Asia Market Y-o-Y Growth Comparison by Nature, 2025-2035
  • Figure 90: East Asia Market Attractiveness Analysis by Nature
  • Figure 91: South Asia & Pacific Market Value Share and BPS Analysis by Country, 2025 and 2035
  • Figure 92: South Asia & Pacific Market Value Share and BPS Analysis by Product Type, 2025 and 2035
  • Figure 93: South Asia & Pacific Market Y-o-Y Growth Comparison by Product Type, 2025-2035
  • Figure 94: South Asia & Pacific Market Attractiveness Analysis by Product Type
  • Figure 95: South Asia & Pacific Market Value Share and BPS Analysis by Source, 2025 and 2035
  • Figure 96: South Asia & Pacific Market Y-o-Y Growth Comparison by Source, 2025-2035
  • Figure 97: South Asia & Pacific Market Attractiveness Analysis by Source
  • Figure 98: South Asia & Pacific Market Value Share and BPS Analysis by Animal Type, 2025 and 2035
  • Figure 99: South Asia & Pacific Market Y-o-Y Growth Comparison by Animal Type, 2025-2035
  • Figure 100: South Asia & Pacific Market Attractiveness Analysis by Animal Type
  • Figure 101: South Asia & Pacific Market Value Share and BPS Analysis by Nature, 2025 and 2035
  • Figure 102: South Asia & Pacific Market Y-o-Y Growth Comparison by Nature, 2025-2035
  • Figure 103: South Asia & Pacific Market Attractiveness Analysis by Nature
  • Figure 104: Middle East and Africa Market Value Share and BPS Analysis by Country, 2025 and 2035
  • Figure 105: Middle East and Africa Market Value Share and BPS Analysis by Product Type, 2025 and 2035
  • Figure 106: Middle East and Africa Market Y-o-Y Growth Comparison by Product Type, 2025-2035
  • Figure 107: Middle East and Africa Market Attractiveness Analysis by Product Type
  • Figure 108: Middle East and Africa Market Value Share and BPS Analysis by Source, 2025 and 2035
  • Figure 109: Middle East and Africa Market Y-o-Y Growth Comparison by Source, 2025-2035
  • Figure 110: Middle East and Africa Market Attractiveness Analysis by Source
  • Figure 111: Middle East and Africa Market Value Share and BPS Analysis by Animal Type, 2025 and 2035
  • Figure 112: Middle East and Africa Market Y-o-Y Growth Comparison by Animal Type, 2025-2035
  • Figure 113: Middle East and Africa Market Attractiveness Analysis by Animal Type
  • Figure 114: Middle East and Africa Market Value Share and BPS Analysis by Nature, 2025 and 2035
  • Figure 115: Middle East and Africa Market Y-o-Y Growth Comparison by Nature, 2025-2035
  • Figure 116: Middle East and Africa Market Attractiveness Analysis by Nature
  • Figure 117: Global Market - Tier Structure Analysis
  • Figure 118: Global Market - Company Share Analysis

Frequently Asked Questions

What is the projected size of the pet food market by 2035?

The market is forecasted to reach USD 247.7 billion by 2035.

What is the CAGR of the pet food market from 2025 to 2035?

The market is projected to grow at a CAGR of 6.5% during this period.

Which product type holds the highest share in the pet food market in 2025?

Kibble/dry food is expected to lead with over 42.5% market share in 2025.

What is the projected share of animal-derived source segment in the pet food market by 2025?

Animal-derived segment is expected to hold approximately 22.7% of the market share in 2025.

Which country is projected to grow fastest in the pet food market?

The UK is anticipated to be the fastest-growing market with a CAGR of 6.8% from 2025 to 2035.

Explore Similar Insights

Future Market Insights

Pet Food Market