Reports

- Global Locations -

Headquarters

Future Market Insights, Inc.

Christiana Corporate, 200
Continental Drive, Suite 401,
Newark, Delaware - 19713,
United States

T: +1-845-579-5705

Americas

Future Market Insights, Inc.

616 Corporate Way, Suite 2-9018,
Valley Cottage, NY 10989, United States

T: +1-347-918-3531

MEA

Future Market Insights

1602-6 Jumeirah Bay X2 Tower, Plot No: JLT-PH2-X2A,
Jumeirah Lakes Towers, Dubai,
United Arab Emirates

Europe

Future Market Insights

3rd Floor, 207 Regent Street,
W1B 3HH London
United Kingdom

T: + 44 (0) 20 8123 9659
D: +44 (0) 20 3287 4268

Asia Pacific

Future Market Insights

IndiaLand Global Tech Park, Unit UG-1, Behind Grand HighStreet, Phase 1, Hinjawadi, MH, Pune – 411057, India

Pet Food and Supplement Market Outlook from 2024 to 2034

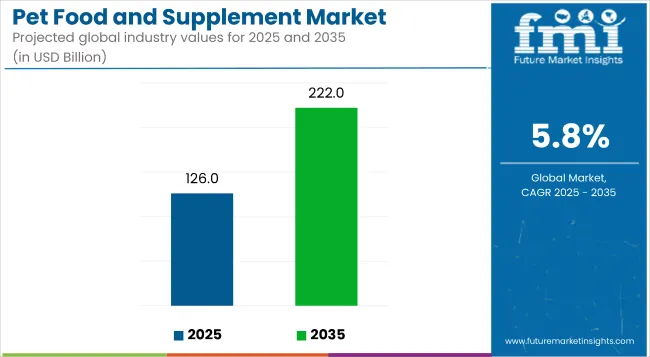
Recent research from Future Market Insights suggests that the global pet food and supplement market is poised to reach a value of US$ 119.1 billion by 2024. Projections indicate a substantial surge to US$ 210.0 billion by 2034, showcasing an impressive growth trajectory. The expansion is indicative of a CAGR of 5.8% over the forecast period.

Attributes Key Insights
Pet Food and Supplement Market Estimated Size in 2024 US$ 119.1 billion
Projected Market Value in 2034 US$ 210.0 billion
Value-based CAGR from 2024 to 2034 5.8%

Don't pay for what you don't need

Customize your report by selecting specific countries or regions and save 30%!

Market Motivators Enhancing Market Growth

  • There is an increasing demand for specialized pet foods and supplements tailored to address health concerns.
  • E-commerce boom has made it easier for pet owners to access a wide variety of pet supplements.
  • Innovations in product formulations will cater to specific dietary needs and preferences.
  • The manufacturers are also expanding their distribution channels to reach a wider audience.

Barks and Purrs Everywhere- The Culinary World of Pet Food and Supplements to Widen Substantially

Sales of pet food and supplements rose at a 7.5% CAGR between 2019 and 2023. The global market is achieving heights to grow at a moderate CAGR of 5.8% over the forecast period 2024 to 2034.

The market witnessed a significant growth during the historical period, attributed to the factors such as increasing pet ownership.

Pet owners increasingly view their pets as members of the family and seek products that mirror human food trends, such as organic, natural, and functional ingredients. Rising awareness of pet health and wellness has led to increased demand for high quality pet supplements.

Pet owners are becoming more conscious of the nutritional needs of their pets and are willing to invest in products to maintain their health. Urbanization and changing lifestyles will continue to shape pet ownership trends and preferences.

Advancements in nutrition science and pet health research will drive innovation in pet supplement formulations. The market will continue to expand into emerging markets with rising pet ownership rates and increasing disposable incomes. The trend presents opportunities for brands to tap into new consumer demographics and preferences.

Sudip Saha
Sudip Saha

Principal Consultant

Talk to Analyst

Find your sweet spots for generating winning opportunities in this market.

Major Contributors of the Market

  • Awareness of environmental and ethical concerns is accelerating the demand for sustainable and ethically sourced pet food.
  • Focus on convenience has led to the growth of products such as freeze dried and dehydrated pet foods.
  • Customization has led to the emergence of personalized pet food formulations based on factors including age, size, and health conditions.
  • Rise of functional ingredients enriched with functional ingredients that offer specific health benefits.

Factors Hampering the Market

  • Rising ingredient costs can affect the profitability of pet food manufacturers.
  • Health and safety concerns can erode consumer trust and confidence in certain brands or product categories.
  • Consumer shifts in preferences could impact purchasing decisions in the market.
  • Negative public perception could influence consumer perceptions and purchasing behavior.

Get the data you need at a Fraction of the cost

Personalize your report by choosing insights you need
and save 40%!

Comparative View of Adjacent Industries

Future Market Insights has compared two other industries, pet dietary supplement market, and organic pet food market. Focus on transparency and traceability provides detailed information about ingredient sourcing, and manufacturing processes.

Rising pet health awareness is fuelling the demand for dietary supplements formulated to address specific health concerns or provide nutritional support. Increasing demand for organic products driven by concerns about food safety, is augmenting the demand for organic pet food.

Pet Food and Supplement Market:

Attributes Pet Food and Supplement Market
CAGR from 2024 to 2034 5.8%
Key Trends
  • Premiumization of treats and snacks has led to the expansion of the market for gourmet, natural, and high protein pet treats.
  • CBD and hemp based products are marketed for their potential benefits in managing pet anxiety, pain, inflammation, and other health issues.
Opportunity
  • Regulatory changes and standards will create opportunities for companies that proactively adapt to meet new regulations and consumer expectations.
  • Health tracking and monitoring technologies enable pet owners to monitor the nutrition, activity levels, and health metrics of pets.

Pet Dietary Supplement Market:

Attributes Pet Dietary Supplement Market
CAGR from 2023 to 2033 7.3%
Key Trends
  • Veterinary recommendations can significantly influence the purchasing decisions of the pet owners.
  • Complementary and alternative medicine trends among pet owners is driving interest in natural and holistic approaches to pet health care.
Opportunity
  • Convenience and ease of administration is making it easier for pet owners to incorporate supplements into the daily routines of the pets.
  • Specialized formulations for health conditions are gaining traction in the pet market.

Organic Pet Food Market:

Attributes Organic Pet Food Market
CAGR from 2022 to 2032 7.4%
Key Trends
  • Concerns about synthetic additives and preservatives is driving demand for natural and organic alternatives.
  • Organic certification provides assurance of compliance with strict standards for organic farming practices, and production methods.
Opportunity
  • Pet owners are increasingly willing to invest in premium products for their pets, including organic pet food.
  • Regulatory support provides credibility and assurance to consumers regarding the authenticity of organic pet food products.

Country-wise Insights

Premiumization of Products to Augment the Market Growth in the United States

Country The United States
CAGR through 2034 6.2%

The pet food and supplement market in the United States will expand at a CAGR of 6.2% through 2034. Pet owners in the United States are increasingly willing to pay a premium for high quality pet food.

They are drawn to products made with natural ingredients, free from artificial additives and preservatives, and sourced from trusted suppliers. Premiumization drives growth in the market as pet owners seek products that offer superior quality and nutritional value for their pets.

There is a growing emphasis on pet health and wellness in the United States, with pet owners seeking products that support the overall health of the pets, address specific health concerns, as well as provide functional benefits. The trend drives demand for products such as joint supplements, probiotics, and premium pet foods formulated for specific health needs.

E-commerce Boom Will Boost the Market Growth in the United Kingdom

Country The United Kingdom
CAGR through 2034 7.1%

The pet food and supplement market in the United Kingdom to expand at a CAGR of 7.1% through 2034. The growth of e-commerce has transformed the market in the country, providing consumers with convenient access to a vast selection of products.

Online retailers offer competitive pricing, subscription options, and home delivery, driving significant growth in online pet product sales.

The industry in the United Kingdom benefits from a diverse range of distribution channels, including pet specialty stores, online retailers, supermarkets, and veterinary clinics. The expansion of distribution channels makes it easier for pet owners to access a wide variety of products, driving market growth.

Urbanization and Lifestyle Trends to Open up Avenues for the Market in China

Country China
CAGR through 2034 6.6%

Pet food and supplement trends in China are taking a turn for the better. A 6.6% CAGR is forecast for the country from 2024 to 2034. Urbanization in China has led to smaller living spaces and an increase in single person households, where pets often serve as companions.

Busy urban lifestyles leave pet owners with less time to prepare homemade pet food, driving demand for convenient and nutritious commercial pet supplements. The expanding middle class population in China has greater purchasing power and is increasingly willing to spend on premium products for their pets. The demographic shift contributes to the rising demand for high quality pet food.

Government Support and Regulations to Stimulate the Market Growth in Japan

Country Japan
CAGR through 2034 7.6%

The pet food and supplement market in Japan is poised to expand at a CAGR of 7.6% through 2034. The Japanese government has implemented regulations to ensure the safety and quality of supplements.

The regulations provide a level of assurance to consumers and contribute to the overall growth of the market by fostering consumer trust. Manufacturers in Japan are continually innovating to develop new and improved pet food formulations. This includes the use of novel ingredients, advanced processing techniques, and specialized formulations to cater to specific dietary needs and preferences.

Rise in Pet Health Awareness Campaigns to Fuel the Market Prospects in Korea

Country Korea
CAGR through 2034 8.0%

The pet food and supplement market in Korea will expand at a CAGR of 8.0% through 2034. There has been an increase in pet health awareness initiatives in Korea, aimed at educating pet owners about the importance of proper nutrition and supplementation well-being of pets.

The campaigns help drive demand for high quality pet food among conscientious pet owners. Korea has been implementing pet friendly policies and improving pet related infrastructure, such as pet parks, pet friendly cafes, and pet friendly accommodations.

The initiatives encourage pet ownership and contribute to the overall growth of the pet industry, including the demand for pet food and supplements.

Category-wise Insights

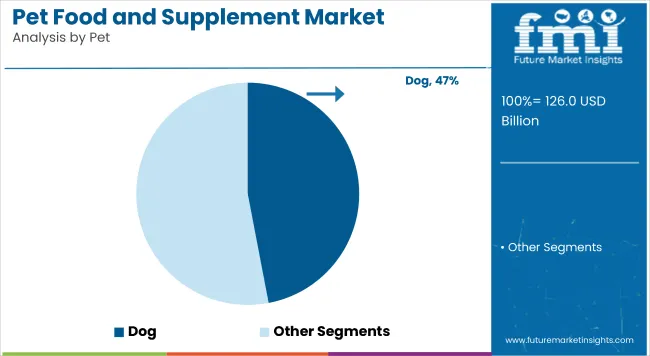
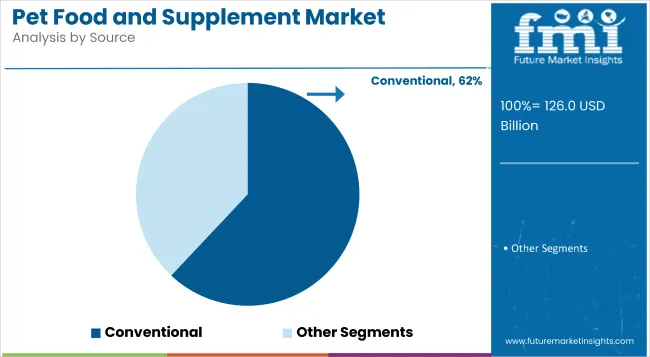
The below table highlights how dog segment is leading the market in terms of pet, and will account for a CAGR of 5.6% through 2034. Based on source, the conventional segment is gaining heights and will to account for a CAGR of 5.4% through 2034.

Category CAGR through 2034
Dog 5.6%
Conventional 5.4%

Dog Segment Witnesses High Demand for Pet Food and Supplement

Based on pet, the dog segment will dominate the market growth in the coming years. Pet owners value convenience when it comes to feeding and supplementing their dogs.

Manufacturers are innovating to offer convenient and easy to administer products, such as soft chews, liquid supplements, and single serve packaging, making it easier for pet owners to incorporate supplements into daily routines of their dogs.

Increasing awareness of preventive healthcare and the importance of nutrition in the overall health of the dogs has led to a growing interest in dietary supplements among pet owners. Supplements targeting specific health concerns, such as joint support, immune health, and dental care, are gaining popularity in the dog segment.

Conventional Segment to Hold High Demand for Pet Food and Supplement

In terms of source, the conventional segment will dominate the pet food and supplement market. Conventional pet supplements are widely available across various retail channels, including supermarkets, pet stores, and online platforms.

Their accessibility makes them convenient options for pet owners who may not have access to specialty or organic pet products in their area. Conventional pet food and supplements typically use less expensive ingredients and production methods compared to organic alternatives.

The cost effectiveness appeals to price conscious consumers, especially those with multiple pets or larger breeds that require larger quantities of food and supplements.

Competitive Landscape

The competitive landscape of the pet food and supplement industry is dynamic and multifaceted, characterized by a diverse range of players vying for market share.

Company Portfolio

  • Mars Petcare offers a diverse portfolio of pet food and supplement products catering to various dietary needs and preferences of pets. Their range includes both dry and wet food options, as well as specialized diets for specific health concerns such as weight management or sensitive stomachs.
  • Nestlé Purina Petcare is renowned for its extensive line of pet supplement offerings. Their supplements are designed to complement these diets and support optimal pet health.

Key Coverage in the Pet Food and Supplement Industry Report

  • Pet food trends
  • Healthy pet nutrition
  • Premium pet supplements
  • Organic pet food
  • Holistic pet care
  • Specialty pet diets
  • Pet Insurance Market
  • Pet Toys and Accessories Market

Report Scope

Attribute Details
Estimated Market Size in 2024 US$ 119.1 billion
Projected Market Valuation in 2034 US$ 210.0 billion
Value-based CAGR 2024 to 2034 5.8%
Forecast Period 2024 to 2034
Historical Data Available for 2019 to 2023
Market Analysis Value in US$ Billion
Key Regions Covered
  • North America
  • Latin America
  • Western Europe
  • Eastern Europe
  • South Asia and Pacific
  • East Asia
  • The Middle East & Africa
Key Market Segments Covered
  • Product Type
  • Source
  • Distribution Channel
  • Food Type
  • Region
Key Countries Profiled
  • The United States
  • Canada
  • Brazil
  • Mexico
  • Germany
  • France
  • France
  • Spain
  • Italy
  • Russia
  • Poland
  • Czech Republic
  • Romania
  • India
  • Bangladesh
  • Australia
  • New Zealand
  • China
  • Japan
  • South Korea
  • GCC countries
  • South Africa
  • Israel
Key Companies Profiled
  • Mars Petcare
  • Nestlé Purina Petcare
  • Hill's Pet Nutrition
  • The J.M. Smucker Company
  • Blue Buffalo
  • Diamond Pet Foods
  • Spectrum Brands
  • Nutro Products
  • Wellness Pet Food
  • Merrick Pet Care
  • Ainsworth Pet Nutrition

Segmentation Analysis of the Pet Food and Supplement Market

By Product Type:

  • Dog
  • Cat
  • Freshwater Fish
  • Others

By Source:

  • Organic
  • Conventional

By Distribution Channel:

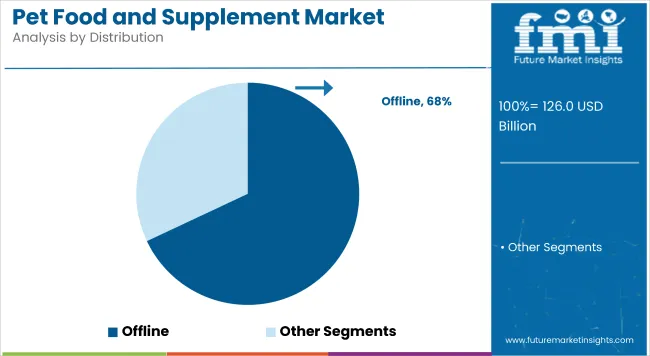
  • Offline
  • Online

By Food Type:

  • Wet Food
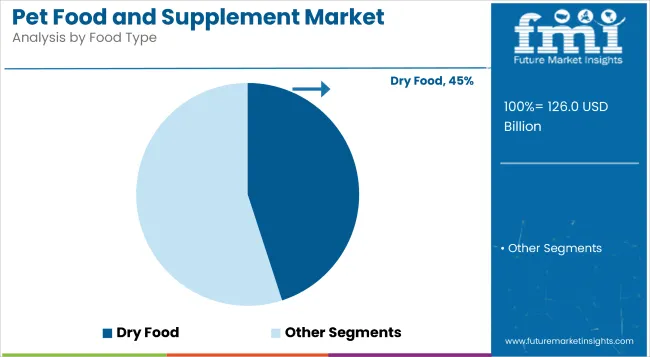
  • Dry Food
  • Snacks/Treats

By Region:

  • North America
  • Latin America
  • Western Europe
  • Eastern Europe
  • South Asia and Pacific
  • East Asia
  • The Middle East and Africa

Frequently Asked Questions

What is the value of the Pet Food and Supplement market in 2024?

The market is projected to reach a valuation of US$ 119.1 billion in 2024.

What is the CAGR for the Pet Food and Supplement market until 2034?

The pet food and supplement industry is set to expand by a CAGR of 5.8% through 2034.

What value is projected for the Pet Food and Supplement market in 2034?

The market is forecast to reach US$ 210.0 billion by 2034.

Which country leads in the Pet Food and Supplement market?

Korea is a top performing market, exhibiting a CAGR of 8.0% through 2034.

Which Pet Food and Supplement type will generate high sales?

Dog pet food and supplement sales will rise at a CAGR of 5.6% through 2034.

Table of Content

1. Executive Summary

    1.1. Global Market Outlook

    1.2. Demand-side Trends

    1.3. Supply-side Trends

    1.4. Technology Roadmap Analysis

    1.5. Analysis and Recommendations

2. Market Overview

    2.1. Market Coverage / Taxonomy

    2.2. Market Definition / Scope / Limitations

3. Market Background

    3.1. Market Dynamics

        3.1.1. Drivers

        3.1.2. Restraints

        3.1.3. Opportunity

        3.1.4. Trends

    3.2. Scenario Forecast

        3.2.1. Demand in Optimistic Scenario

        3.2.2. Demand in Likely Scenario

        3.2.3. Demand in Conservative Scenario

    3.3. Opportunity Map Analysis

    3.4. Product Life Cycle Analysis

    3.5. Supply Chain Analysis

        3.5.1. Supply Side Participants and their Roles

            3.5.1.1. Manufacturer

            3.5.1.2. Mid-Level Participants (Traders)

            3.5.1.3. Wholesalers and Distributors

        3.5.2. Value Added and Value Created at Node in the Supply Chain

        3.5.3. List of Raw Material Suppliers

        3.5.4. List of Existing and Potential Buyer’s

    3.6. Investment Feasibility Matrix

    3.7. Value Chain Analysis

        3.7.1. Profit Margin Analysis

        3.7.2. Wholesalers and Distributors

        3.7.3. Retailers

    3.8. PESTLE and Porter’s Analysis

    3.9. Regulatory Landscape

        3.9.1. By Key Regions

        3.9.2. By Key Countries

    3.10. Regional Parent Market Outlook

    3.11. Production and Consumption Statistics

    3.12. Import and Export Statistics

4. Global Market Analysis 2019 to 2023 and Forecast, 2024 to 2034

    4.1. Historical Market Size Value (US$ Million) & Volume (Unit Pack) Analysis, 2019 to 2023

    4.2. Current and Future Market Size Value (US$ Million) & Volume (Unit Pack) Projections, 2024 to 2034

        4.2.1. Y-o-Y Growth Trend Analysis

        4.2.2. Absolute $ Opportunity Analysis

5. Global Market Analysis 2019 to 2023 and Forecast 2024 to 2034, By Pet

    5.1. Introduction / Key Findings

    5.2. Historical Market Size Value (US$ Million) & Volume (Unit Pack) Analysis By Pet, 2019 to 2023

    5.3. Current and Future Market Size Value (US$ Million) & Volume (Unit Pack) Analysis and Forecast By Pet, 2024 to 2034

        5.3.1. Dog

        5.3.2. Cat

        5.3.3. Freshwater Fish

        5.3.4. Others

    5.4. Y-o-Y Growth Trend Analysis By Pet, 2019 to 2023

    5.5. Absolute $ Opportunity Analysis By Pet, 2024 to 2034

6. Global Market Analysis 2019 to 2023 and Forecast 2024 to 2034, By Application

    6.1. Introduction / Key Findings

    6.2. Historical Market Size Value (US$ Million) & Volume (Unit Pack) Analysis By Application, 2019 to 2023

    6.3. Current and Future Market Size Value (US$ Million) & Volume (Unit Pack) Analysis and Forecast By Application, 2024 to 2034

        6.3.1. Multivitamins

        6.3.2. Skin & Coat

        6.3.3. Hip & Joint

        6.3.4. Prebiotics & Probiotics

        6.3.5. Calming

        6.3.6. Others

    6.4. Y-o-Y Growth Trend Analysis By Application, 2019 to 2023

    6.5. Absolute $ Opportunity Analysis By Application, 2024 to 2034

7. Global Market Analysis 2019 to 2023 and Forecast 2024 to 2034, By Source

    7.1. Introduction / Key Findings

    7.2. Historical Market Size Value (US$ Million) & Volume (Unit Pack) Analysis By Source, 2019 to 2023

    7.3. Current and Future Market Size Value (US$ Million) & Volume (Unit Pack) Analysis and Forecast By Source, 2024 to 2034

        7.3.1. Organic

        7.3.2. Conventional

    7.4. Y-o-Y Growth Trend Analysis By Source, 2019 to 2023

    7.5. Absolute $ Opportunity Analysis By Source, 2024 to 2034

8. Global Market Analysis 2019 to 2023 and Forecast 2024 to 2034, By Distribution Channel

    8.1. Introduction / Key Findings

    8.2. Historical Market Size Value (US$ Million) & Volume (Unit Pack) Analysis By Distribution Channel, 2019 to 2023

    8.3. Current and Future Market Size Value (US$ Million) & Volume (Unit Pack) Analysis and Forecast By Distribution Channel, 2024 to 2034

        8.3.1. Offline

        8.3.2. Online

    8.4. Y-o-Y Growth Trend Analysis By Distribution Channel, 2019 to 2023

    8.5. Absolute $ Opportunity Analysis By Distribution Channel, 2024 to 2034

9. Global Market Analysis 2019 to 2023 and Forecast 2024 to 2034, By Food Type

    9.1. Introduction / Key Findings

    9.2. Historical Market Size Value (US$ Million) & Volume (Unit Pack) Analysis By Food Type, 2019 to 2023

    9.3. Current and Future Market Size Value (US$ Million) & Volume (Unit Pack) Analysis and Forecast By Food Type, 2024 to 2034

        9.3.1. Wet Food

        9.3.2. Dry Food

        9.3.3. Snacks/Treats

    9.4. Y-o-Y Growth Trend Analysis By Food Type, 2019 to 2023

    9.5. Absolute $ Opportunity Analysis By Food Type, 2024 to 2034

10. Global Market Analysis 2019 to 2023 and Forecast 2024 to 2034, By Region

    10.1. Introduction

    10.2. Historical Market Size Value (US$ Million) & Volume (Unit Pack) Analysis By Region, 2019 to 2023

    10.3. Current Market Size Value (US$ Million) & Volume (Unit Pack) Analysis and Forecast By Region, 2024 to 2034

        10.3.1. North America

        10.3.2. Latin America

        10.3.3. Western Europe

        10.3.4. Eastern Europe

        10.3.5. South Asia and Pacific

        10.3.6. East Asia

        10.3.7. Middle East and Africa

    10.4. Market Attractiveness Analysis By Region

11. North America Market Analysis 2019 to 2023 and Forecast 2024 to 2034, By Country

    11.1. Historical Market Size Value (US$ Million) & Volume (Unit Pack) Trend Analysis By Market Taxonomy, 2019 to 2023

    11.2. Market Size Value (US$ Million) & Volume (Unit Pack) Forecast By Market Taxonomy, 2024 to 2034

        11.2.1. By Country

            11.2.1.1. USA

            11.2.1.2. Canada

        11.2.2. By Pet

        11.2.3. By Application

        11.2.4. By Source

        11.2.5. By Distribution Channel

        11.2.6. By Food Type

    11.3. Market Attractiveness Analysis

        11.3.1. By Country

        11.3.2. By Pet

        11.3.3. By Application

        11.3.4. By Source

        11.3.5. By Distribution Channel

        11.3.6. By Food Type

    11.4. Key Takeaways

12. Latin America Market Analysis 2019 to 2023 and Forecast 2024 to 2034, By Country

    12.1. Historical Market Size Value (US$ Million) & Volume (Unit Pack) Trend Analysis By Market Taxonomy, 2019 to 2023

    12.2. Market Size Value (US$ Million) & Volume (Unit Pack) Forecast By Market Taxonomy, 2024 to 2034

        12.2.1. By Country

            12.2.1.1. Brazil

            12.2.1.2. Mexico

            12.2.1.3. Rest of Latin America

        12.2.2. By Pet

        12.2.3. By Application

        12.2.4. By Source

        12.2.5. By Distribution Channel

        12.2.6. By Food Type

    12.3. Market Attractiveness Analysis

        12.3.1. By Country

        12.3.2. By Pet

        12.3.3. By Application

        12.3.4. By Source

        12.3.5. By Distribution Channel

        12.3.6. By Food Type

    12.4. Key Takeaways

13. Western Europe Market Analysis 2019 to 2023 and Forecast 2024 to 2034, By Country

    13.1. Historical Market Size Value (US$ Million) & Volume (Unit Pack) Trend Analysis By Market Taxonomy, 2019 to 2023

    13.2. Market Size Value (US$ Million) & Volume (Unit Pack) Forecast By Market Taxonomy, 2024 to 2034

        13.2.1. By Country

            13.2.1.1. Germany

            13.2.1.2. UK

            13.2.1.3. France

            13.2.1.4. Spain

            13.2.1.5. Italy

            13.2.1.6. Rest of Western Europe

        13.2.2. By Pet

        13.2.3. By Application

        13.2.4. By Source

        13.2.5. By Distribution Channel

        13.2.6. By Food Type

    13.3. Market Attractiveness Analysis

        13.3.1. By Country

        13.3.2. By Pet

        13.3.3. By Application

        13.3.4. By Source

        13.3.5. By Distribution Channel

        13.3.6. By Food Type

    13.4. Key Takeaways

14. Eastern Europe Market Analysis 2019 to 2023 and Forecast 2024 to 2034, By Country

    14.1. Historical Market Size Value (US$ Million) & Volume (Unit Pack) Trend Analysis By Market Taxonomy, 2019 to 2023

    14.2. Market Size Value (US$ Million) & Volume (Unit Pack) Forecast By Market Taxonomy, 2024 to 2034

        14.2.1. By Country

            14.2.1.1. Poland

            14.2.1.2. Russia

            14.2.1.3. Czech Republic

            14.2.1.4. Romania

            14.2.1.5. Rest of Eastern Europe

        14.2.2. By Pet

        14.2.3. By Application

        14.2.4. By Source

        14.2.5. By Distribution Channel

        14.2.6. By Food Type

    14.3. Market Attractiveness Analysis

        14.3.1. By Country

        14.3.2. By Pet

        14.3.3. By Application

        14.3.4. By Source

        14.3.5. By Distribution Channel

        14.3.6. By Food Type

    14.4. Key Takeaways

15. South Asia and Pacific Market Analysis 2019 to 2023 and Forecast 2024 to 2034, By Country

    15.1. Historical Market Size Value (US$ Million) & Volume (Unit Pack) Trend Analysis By Market Taxonomy, 2019 to 2023

    15.2. Market Size Value (US$ Million) & Volume (Unit Pack) Forecast By Market Taxonomy, 2024 to 2034

        15.2.1. By Country

            15.2.1.1. India

            15.2.1.2. Bangladesh

            15.2.1.3. Australia

            15.2.1.4. New Zealand

            15.2.1.5. Rest of South Asia and Pacific

        15.2.2. By Pet

        15.2.3. By Application

        15.2.4. By Source

        15.2.5. By Distribution Channel

        15.2.6. By Food Type

    15.3. Market Attractiveness Analysis

        15.3.1. By Country

        15.3.2. By Pet

        15.3.3. By Application

        15.3.4. By Source

        15.3.5. By Distribution Channel

        15.3.6. By Food Type

    15.4. Key Takeaways

16. East Asia Market Analysis 2019 to 2023 and Forecast 2024 to 2034, By Country

    16.1. Historical Market Size Value (US$ Million) & Volume (Unit Pack) Trend Analysis By Market Taxonomy, 2019 to 2023

    16.2. Market Size Value (US$ Million) & Volume (Unit Pack) Forecast By Market Taxonomy, 2024 to 2034

        16.2.1. By Country

            16.2.1.1. China

            16.2.1.2. Japan

            16.2.1.3. South Korea

        16.2.2. By Pet

        16.2.3. By Application

        16.2.4. By Source

        16.2.5. By Distribution Channel

        16.2.6. By Food Type

    16.3. Market Attractiveness Analysis

        16.3.1. By Country

        16.3.2. By Pet

        16.3.3. By Application

        16.3.4. By Source

        16.3.5. By Distribution Channel

        16.3.6. By Food Type

    16.4. Key Takeaways

17. Middle East and Africa Market Analysis 2019 to 2023 and Forecast 2024 to 2034, By Country

    17.1. Historical Market Size Value (US$ Million) & Volume (Unit Pack) Trend Analysis By Market Taxonomy, 2019 to 2023

    17.2. Market Size Value (US$ Million) & Volume (Unit Pack) Forecast By Market Taxonomy, 2024 to 2034

        17.2.1. By Country

            17.2.1.1. GCC Countries

            17.2.1.2. South Africa

            17.2.1.3. Israel

            17.2.1.4. Rest of MEA

        17.2.2. By Pet

        17.2.3. By Application

        17.2.4. By Source

        17.2.5. By Distribution Channel

        17.2.6. By Food Type

    17.3. Market Attractiveness Analysis

        17.3.1. By Country

        17.3.2. By Pet

        17.3.3. By Application

        17.3.4. By Source

        17.3.5. By Distribution Channel

        17.3.6. By Food Type

    17.4. Key Takeaways

18. Key Countries Market Analysis

    18.1. USA

        18.1.1. Pricing Analysis

        18.1.2. Market Share Analysis, 2023

            18.1.2.1. By Pet

            18.1.2.2. By Application

            18.1.2.3. By Source

            18.1.2.4. By Distribution Channel

            18.1.2.5. By Food Type

    18.2. Canada

        18.2.1. Pricing Analysis

        18.2.2. Market Share Analysis, 2023

            18.2.2.1. By Pet

            18.2.2.2. By Application

            18.2.2.3. By Source

            18.2.2.4. By Distribution Channel

            18.2.2.5. By Food Type

    18.3. Brazil

        18.3.1. Pricing Analysis

        18.3.2. Market Share Analysis, 2023

            18.3.2.1. By Pet

            18.3.2.2. By Application

            18.3.2.3. By Source

            18.3.2.4. By Distribution Channel

            18.3.2.5. By Food Type

    18.4. Mexico

        18.4.1. Pricing Analysis

        18.4.2. Market Share Analysis, 2023

            18.4.2.1. By Pet

            18.4.2.2. By Application

            18.4.2.3. By Source

            18.4.2.4. By Distribution Channel

            18.4.2.5. By Food Type

    18.5. Germany

        18.5.1. Pricing Analysis

        18.5.2. Market Share Analysis, 2023

            18.5.2.1. By Pet

            18.5.2.2. By Application

            18.5.2.3. By Source

            18.5.2.4. By Distribution Channel

            18.5.2.5. By Food Type

    18.6. UK

        18.6.1. Pricing Analysis

        18.6.2. Market Share Analysis, 2023

            18.6.2.1. By Pet

            18.6.2.2. By Application

            18.6.2.3. By Source

            18.6.2.4. By Distribution Channel

            18.6.2.5. By Food Type

    18.7. France

        18.7.1. Pricing Analysis

        18.7.2. Market Share Analysis, 2023

            18.7.2.1. By Pet

            18.7.2.2. By Application

            18.7.2.3. By Source

            18.7.2.4. By Distribution Channel

            18.7.2.5. By Food Type

    18.8. Spain

        18.8.1. Pricing Analysis

        18.8.2. Market Share Analysis, 2023

            18.8.2.1. By Pet

            18.8.2.2. By Application

            18.8.2.3. By Source

            18.8.2.4. By Distribution Channel

            18.8.2.5. By Food Type

    18.9. Italy

        18.9.1. Pricing Analysis

        18.9.2. Market Share Analysis, 2023

            18.9.2.1. By Pet

            18.9.2.2. By Application

            18.9.2.3. By Source

            18.9.2.4. By Distribution Channel

            18.9.2.5. By Food Type

    18.10. Poland

        18.10.1. Pricing Analysis

        18.10.2. Market Share Analysis, 2023

            18.10.2.1. By Pet

            18.10.2.2. By Application

            18.10.2.3. By Source

            18.10.2.4. By Distribution Channel

            18.10.2.5. By Food Type

    18.11. Russia

        18.11.1. Pricing Analysis

        18.11.2. Market Share Analysis, 2023

            18.11.2.1. By Pet

            18.11.2.2. By Application

            18.11.2.3. By Source

            18.11.2.4. By Distribution Channel

            18.11.2.5. By Food Type

    18.12. Czech Republic

        18.12.1. Pricing Analysis

        18.12.2. Market Share Analysis, 2023

            18.12.2.1. By Pet

            18.12.2.2. By Application

            18.12.2.3. By Source

            18.12.2.4. By Distribution Channel

            18.12.2.5. By Food Type

    18.13. Romania

        18.13.1. Pricing Analysis

        18.13.2. Market Share Analysis, 2023

            18.13.2.1. By Pet

            18.13.2.2. By Application

            18.13.2.3. By Source

            18.13.2.4. By Distribution Channel

            18.13.2.5. By Food Type

    18.14. India

        18.14.1. Pricing Analysis

        18.14.2. Market Share Analysis, 2023

            18.14.2.1. By Pet

            18.14.2.2. By Application

            18.14.2.3. By Source

            18.14.2.4. By Distribution Channel

            18.14.2.5. By Food Type

    18.15. Bangladesh

        18.15.1. Pricing Analysis

        18.15.2. Market Share Analysis, 2023

            18.15.2.1. By Pet

            18.15.2.2. By Application

            18.15.2.3. By Source

            18.15.2.4. By Distribution Channel

            18.15.2.5. By Food Type

    18.16. Australia

        18.16.1. Pricing Analysis

        18.16.2. Market Share Analysis, 2023

            18.16.2.1. By Pet

            18.16.2.2. By Application

            18.16.2.3. By Source

            18.16.2.4. By Distribution Channel

            18.16.2.5. By Food Type

    18.17. New Zealand

        18.17.1. Pricing Analysis

        18.17.2. Market Share Analysis, 2023

            18.17.2.1. By Pet

            18.17.2.2. By Application

            18.17.2.3. By Source

            18.17.2.4. By Distribution Channel

            18.17.2.5. By Food Type

    18.18. China

        18.18.1. Pricing Analysis

        18.18.2. Market Share Analysis, 2023

            18.18.2.1. By Pet

            18.18.2.2. By Application

            18.18.2.3. By Source

            18.18.2.4. By Distribution Channel

            18.18.2.5. By Food Type

    18.19. Japan

        18.19.1. Pricing Analysis

        18.19.2. Market Share Analysis, 2023

            18.19.2.1. By Pet

            18.19.2.2. By Application

            18.19.2.3. By Source

            18.19.2.4. By Distribution Channel

            18.19.2.5. By Food Type

    18.20. South Korea

        18.20.1. Pricing Analysis

        18.20.2. Market Share Analysis, 2023

            18.20.2.1. By Pet

            18.20.2.2. By Application

            18.20.2.3. By Source

            18.20.2.4. By Distribution Channel

            18.20.2.5. By Food Type

    18.21. GCC Countries

        18.21.1. Pricing Analysis

        18.21.2. Market Share Analysis, 2023

            18.21.2.1. By Pet

            18.21.2.2. By Application

            18.21.2.3. By Source

            18.21.2.4. By Distribution Channel

            18.21.2.5. By Food Type

    18.22. South Africa

        18.22.1. Pricing Analysis

        18.22.2. Market Share Analysis, 2023

            18.22.2.1. By Pet

            18.22.2.2. By Application

            18.22.2.3. By Source

            18.22.2.4. By Distribution Channel

            18.22.2.5. By Food Type

    18.23. Israel

        18.23.1. Pricing Analysis

        18.23.2. Market Share Analysis, 2023

            18.23.2.1. By Pet

            18.23.2.2. By Application

            18.23.2.3. By Source

            18.23.2.4. By Distribution Channel

            18.23.2.5. By Food Type

19. Market Structure Analysis

    19.1. Competition Dashboard

    19.2. Competition Benchmarking

    19.3. Market Share Analysis of Top Players

        19.3.1. By Regional

        19.3.2. By Pet

        19.3.3. By Application

        19.3.4. By Source

        19.3.5. By Distribution Channel

        19.3.6. By Food Type

20. Competition Analysis

    20.1. Competition Deep Dive

        20.1.1. Mars Petcare

            20.1.1.1. Overview

            20.1.1.2. Product Portfolio

            20.1.1.3. Profitability by Market Segments

            20.1.1.4. Sales Footprint

            20.1.1.5. Strategy Overview

                20.1.1.5.1. Marketing Strategy

                20.1.1.5.2. Product Strategy

                20.1.1.5.3. Channel Strategy

        20.1.2. Nestlé Purina Petcare

            20.1.2.1. Overview

            20.1.2.2. Product Portfolio

            20.1.2.3. Profitability by Market Segments

            20.1.2.4. Sales Footprint

            20.1.2.5. Strategy Overview

                20.1.2.5.1. Marketing Strategy

                20.1.2.5.2. Product Strategy

                20.1.2.5.3. Channel Strategy

        20.1.3. Hill's Pet Nutrition

            20.1.3.1. Overview

            20.1.3.2. Product Portfolio

            20.1.3.3. Profitability by Market Segments

            20.1.3.4. Sales Footprint

            20.1.3.5. Strategy Overview

                20.1.3.5.1. Marketing Strategy

                20.1.3.5.2. Product Strategy

                20.1.3.5.3. Channel Strategy

        20.1.4. The J.M. Smucker Company

            20.1.4.1. Overview

            20.1.4.2. Product Portfolio

            20.1.4.3. Profitability by Market Segments

            20.1.4.4. Sales Footprint

            20.1.4.5. Strategy Overview

                20.1.4.5.1. Marketing Strategy

                20.1.4.5.2. Product Strategy

                20.1.4.5.3. Channel Strategy

        20.1.5. Blue Buffalo

            20.1.5.1. Overview

            20.1.5.2. Product Portfolio

            20.1.5.3. Profitability by Market Segments

            20.1.5.4. Sales Footprint

            20.1.5.5. Strategy Overview

                20.1.5.5.1. Marketing Strategy

                20.1.5.5.2. Product Strategy

                20.1.5.5.3. Channel Strategy

        20.1.6. Diamond Pet Foods

            20.1.6.1. Overview

            20.1.6.2. Product Portfolio

            20.1.6.3. Profitability by Market Segments

            20.1.6.4. Sales Footprint

            20.1.6.5. Strategy Overview

                20.1.6.5.1. Marketing Strategy

                20.1.6.5.2. Product Strategy

                20.1.6.5.3. Channel Strategy

        20.1.7. Spectrum Brands

            20.1.7.1. Overview

            20.1.7.2. Product Portfolio

            20.1.7.3. Profitability by Market Segments

            20.1.7.4. Sales Footprint

            20.1.7.5. Strategy Overview

                20.1.7.5.1. Marketing Strategy

                20.1.7.5.2. Product Strategy

                20.1.7.5.3. Channel Strategy

        20.1.8. Nutro Products

            20.1.8.1. Overview

            20.1.8.2. Product Portfolio

            20.1.8.3. Profitability by Market Segments

            20.1.8.4. Sales Footprint

            20.1.8.5. Strategy Overview

                20.1.8.5.1. Marketing Strategy

                20.1.8.5.2. Product Strategy

                20.1.8.5.3. Channel Strategy

        20.1.9. Wellness Pet Food

            20.1.9.1. Overview

            20.1.9.2. Product Portfolio

            20.1.9.3. Profitability by Market Segments

            20.1.9.4. Sales Footprint

            20.1.9.5. Strategy Overview

                20.1.9.5.1. Marketing Strategy

                20.1.9.5.2. Product Strategy

                20.1.9.5.3. Channel Strategy

        20.1.10. Merrick Pet Care

            20.1.10.1. Overview

            20.1.10.2. Product Portfolio

            20.1.10.3. Profitability by Market Segments

            20.1.10.4. Sales Footprint

            20.1.10.5. Strategy Overview

                20.1.10.5.1. Marketing Strategy

                20.1.10.5.2. Product Strategy

                20.1.10.5.3. Channel Strategy

        20.1.11. Ainsworth Pet Nutrition

            20.1.11.1. Overview

            20.1.11.2. Product Portfolio

            20.1.11.3. Profitability by Market Segments

            20.1.11.4. Sales Footprint

            20.1.11.5. Strategy Overview

                20.1.11.5.1. Marketing Strategy

                20.1.11.5.2. Product Strategy

                20.1.11.5.3. Channel Strategy

21. Assumptions & Acronyms Used

22. Research Methodology

List of Tables

Table 1: Global Market Value (US$ Million) Forecast by Region, 2019 to 2034

Table 2: Global Market Volume (Unit Pack) Forecast by Region, 2019 to 2034

Table 3: Global Market Value (US$ Million) Forecast by Pet, 2019 to 2034

Table 4: Global Market Volume (Unit Pack) Forecast by Pet, 2019 to 2034

Table 5: Global Market Value (US$ Million) Forecast by Application, 2019 to 2034

Table 6: Global Market Volume (Unit Pack) Forecast by Application, 2019 to 2034

Table 7: Global Market Value (US$ Million) Forecast by Source, 2019 to 2034

Table 8: Global Market Volume (Unit Pack) Forecast by Source, 2019 to 2034

Table 9: Global Market Value (US$ Million) Forecast by Distribution Channel, 2019 to 2034

Table 10: Global Market Volume (Unit Pack) Forecast by Distribution Channel, 2019 to 2034

Table 11: Global Market Value (US$ Million) Forecast by Food Type, 2019 to 2034

Table 12: Global Market Volume (Unit Pack) Forecast by Food Type, 2019 to 2034

Table 13: North America Market Value (US$ Million) Forecast by Country, 2019 to 2034

Table 14: North America Market Volume (Unit Pack) Forecast by Country, 2019 to 2034

Table 15: North America Market Value (US$ Million) Forecast by Pet, 2019 to 2034

Table 16: North America Market Volume (Unit Pack) Forecast by Pet, 2019 to 2034

Table 17: North America Market Value (US$ Million) Forecast by Application, 2019 to 2034

Table 18: North America Market Volume (Unit Pack) Forecast by Application, 2019 to 2034

Table 19: North America Market Value (US$ Million) Forecast by Source, 2019 to 2034

Table 20: North America Market Volume (Unit Pack) Forecast by Source, 2019 to 2034

Table 21: North America Market Value (US$ Million) Forecast by Distribution Channel, 2019 to 2034

Table 22: North America Market Volume (Unit Pack) Forecast by Distribution Channel, 2019 to 2034

Table 23: North America Market Value (US$ Million) Forecast by Food Type, 2019 to 2034

Table 24: North America Market Volume (Unit Pack) Forecast by Food Type, 2019 to 2034

Table 25: Latin America Market Value (US$ Million) Forecast by Country, 2019 to 2034

Table 26: Latin America Market Volume (Unit Pack) Forecast by Country, 2019 to 2034

Table 27: Latin America Market Value (US$ Million) Forecast by Pet, 2019 to 2034

Table 28: Latin America Market Volume (Unit Pack) Forecast by Pet, 2019 to 2034

Table 29: Latin America Market Value (US$ Million) Forecast by Application, 2019 to 2034

Table 30: Latin America Market Volume (Unit Pack) Forecast by Application, 2019 to 2034

Table 31: Latin America Market Value (US$ Million) Forecast by Source, 2019 to 2034

Table 32: Latin America Market Volume (Unit Pack) Forecast by Source, 2019 to 2034

Table 33: Latin America Market Value (US$ Million) Forecast by Distribution Channel, 2019 to 2034

Table 34: Latin America Market Volume (Unit Pack) Forecast by Distribution Channel, 2019 to 2034

Table 35: Latin America Market Value (US$ Million) Forecast by Food Type, 2019 to 2034

Table 36: Latin America Market Volume (Unit Pack) Forecast by Food Type, 2019 to 2034

Table 37: Western Europe Market Value (US$ Million) Forecast by Country, 2019 to 2034

Table 38: Western Europe Market Volume (Unit Pack) Forecast by Country, 2019 to 2034

Table 39: Western Europe Market Value (US$ Million) Forecast by Pet, 2019 to 2034

Table 40: Western Europe Market Volume (Unit Pack) Forecast by Pet, 2019 to 2034

Table 41: Western Europe Market Value (US$ Million) Forecast by Application, 2019 to 2034

Table 42: Western Europe Market Volume (Unit Pack) Forecast by Application, 2019 to 2034

Table 43: Western Europe Market Value (US$ Million) Forecast by Source, 2019 to 2034

Table 44: Western Europe Market Volume (Unit Pack) Forecast by Source, 2019 to 2034

Table 45: Western Europe Market Value (US$ Million) Forecast by Distribution Channel, 2019 to 2034

Table 46: Western Europe Market Volume (Unit Pack) Forecast by Distribution Channel, 2019 to 2034

Table 47: Western Europe Market Value (US$ Million) Forecast by Food Type, 2019 to 2034

Table 48: Western Europe Market Volume (Unit Pack) Forecast by Food Type, 2019 to 2034

Table 49: Eastern Europe Market Value (US$ Million) Forecast by Country, 2019 to 2034

Table 50: Eastern Europe Market Volume (Unit Pack) Forecast by Country, 2019 to 2034

Table 51: Eastern Europe Market Value (US$ Million) Forecast by Pet, 2019 to 2034

Table 52: Eastern Europe Market Volume (Unit Pack) Forecast by Pet, 2019 to 2034

Table 53: Eastern Europe Market Value (US$ Million) Forecast by Application, 2019 to 2034

Table 54: Eastern Europe Market Volume (Unit Pack) Forecast by Application, 2019 to 2034

Table 55: Eastern Europe Market Value (US$ Million) Forecast by Source, 2019 to 2034

Table 56: Eastern Europe Market Volume (Unit Pack) Forecast by Source, 2019 to 2034

Table 57: Eastern Europe Market Value (US$ Million) Forecast by Distribution Channel, 2019 to 2034

Table 58: Eastern Europe Market Volume (Unit Pack) Forecast by Distribution Channel, 2019 to 2034

Table 59: Eastern Europe Market Value (US$ Million) Forecast by Food Type, 2019 to 2034

Table 60: Eastern Europe Market Volume (Unit Pack) Forecast by Food Type, 2019 to 2034

Table 61: South Asia and Pacific Market Value (US$ Million) Forecast by Country, 2019 to 2034

Table 62: South Asia and Pacific Market Volume (Unit Pack) Forecast by Country, 2019 to 2034

Table 63: South Asia and Pacific Market Value (US$ Million) Forecast by Pet, 2019 to 2034

Table 64: South Asia and Pacific Market Volume (Unit Pack) Forecast by Pet, 2019 to 2034

Table 65: South Asia and Pacific Market Value (US$ Million) Forecast by Application, 2019 to 2034

Table 66: South Asia and Pacific Market Volume (Unit Pack) Forecast by Application, 2019 to 2034

Table 67: South Asia and Pacific Market Value (US$ Million) Forecast by Source, 2019 to 2034

Table 68: South Asia and Pacific Market Volume (Unit Pack) Forecast by Source, 2019 to 2034

Table 69: South Asia and Pacific Market Value (US$ Million) Forecast by Distribution Channel, 2019 to 2034

Table 70: South Asia and Pacific Market Volume (Unit Pack) Forecast by Distribution Channel, 2019 to 2034

Table 71: South Asia and Pacific Market Value (US$ Million) Forecast by Food Type, 2019 to 2034

Table 72: South Asia and Pacific Market Volume (Unit Pack) Forecast by Food Type, 2019 to 2034

Table 73: East Asia Market Value (US$ Million) Forecast by Country, 2019 to 2034

Table 74: East Asia Market Volume (Unit Pack) Forecast by Country, 2019 to 2034

Table 75: East Asia Market Value (US$ Million) Forecast by Pet, 2019 to 2034

Table 76: East Asia Market Volume (Unit Pack) Forecast by Pet, 2019 to 2034

Table 77: East Asia Market Value (US$ Million) Forecast by Application, 2019 to 2034

Table 78: East Asia Market Volume (Unit Pack) Forecast by Application, 2019 to 2034

Table 79: East Asia Market Value (US$ Million) Forecast by Source, 2019 to 2034

Table 80: East Asia Market Volume (Unit Pack) Forecast by Source, 2019 to 2034

Table 81: East Asia Market Value (US$ Million) Forecast by Distribution Channel, 2019 to 2034

Table 82: East Asia Market Volume (Unit Pack) Forecast by Distribution Channel, 2019 to 2034

Table 83: East Asia Market Value (US$ Million) Forecast by Food Type, 2019 to 2034

Table 84: East Asia Market Volume (Unit Pack) Forecast by Food Type, 2019 to 2034

Table 85: Middle East and Africa Market Value (US$ Million) Forecast by Country, 2019 to 2034

Table 86: Middle East and Africa Market Volume (Unit Pack) Forecast by Country, 2019 to 2034

Table 87: Middle East and Africa Market Value (US$ Million) Forecast by Pet, 2019 to 2034

Table 88: Middle East and Africa Market Volume (Unit Pack) Forecast by Pet, 2019 to 2034

Table 89: Middle East and Africa Market Value (US$ Million) Forecast by Application, 2019 to 2034

Table 90: Middle East and Africa Market Volume (Unit Pack) Forecast by Application, 2019 to 2034

Table 91: Middle East and Africa Market Value (US$ Million) Forecast by Source, 2019 to 2034

Table 92: Middle East and Africa Market Volume (Unit Pack) Forecast by Source, 2019 to 2034

Table 93: Middle East and Africa Market Value (US$ Million) Forecast by Distribution Channel, 2019 to 2034

Table 94: Middle East and Africa Market Volume (Unit Pack) Forecast by Distribution Channel, 2019 to 2034

Table 95: Middle East and Africa Market Value (US$ Million) Forecast by Food Type, 2019 to 2034

Table 96: Middle East and Africa Market Volume (Unit Pack) Forecast by Food Type, 2019 to 2034

List of Charts

Figure 1: Global Market Value (US$ Million) by Pet, 2024 to 2034

Figure 2: Global Market Value (US$ Million) by Application, 2024 to 2034

Figure 3: Global Market Value (US$ Million) by Source, 2024 to 2034

Figure 4: Global Market Value (US$ Million) by Distribution Channel, 2024 to 2034

Figure 5: Global Market Value (US$ Million) by Food Type, 2024 to 2034

Figure 6: Global Market Value (US$ Million) by Region, 2024 to 2034

Figure 7: Global Market Value (US$ Million) Analysis by Region, 2019 to 2034

Figure 8: Global Market Volume (Unit Pack) Analysis by Region, 2019 to 2034

Figure 9: Global Market Value Share (%) and BPS Analysis by Region, 2024 to 2034

Figure 10: Global Market Y-o-Y Growth (%) Projections by Region, 2024 to 2034

Figure 11: Global Market Value (US$ Million) Analysis by Pet, 2019 to 2034

Figure 12: Global Market Volume (Unit Pack) Analysis by Pet, 2019 to 2034

Figure 13: Global Market Value Share (%) and BPS Analysis by Pet, 2024 to 2034

Figure 14: Global Market Y-o-Y Growth (%) Projections by Pet, 2024 to 2034

Figure 15: Global Market Value (US$ Million) Analysis by Application, 2019 to 2034

Figure 16: Global Market Volume (Unit Pack) Analysis by Application, 2019 to 2034

Figure 17: Global Market Value Share (%) and BPS Analysis by Application, 2024 to 2034

Figure 18: Global Market Y-o-Y Growth (%) Projections by Application, 2024 to 2034

Figure 19: Global Market Value (US$ Million) Analysis by Source, 2019 to 2034

Figure 20: Global Market Volume (Unit Pack) Analysis by Source, 2019 to 2034

Figure 21: Global Market Value Share (%) and BPS Analysis by Source, 2024 to 2034

Figure 22: Global Market Y-o-Y Growth (%) Projections by Source, 2024 to 2034

Figure 23: Global Market Value (US$ Million) Analysis by Distribution Channel, 2019 to 2034

Figure 24: Global Market Volume (Unit Pack) Analysis by Distribution Channel, 2019 to 2034

Figure 25: Global Market Value Share (%) and BPS Analysis by Distribution Channel, 2024 to 2034

Figure 26: Global Market Y-o-Y Growth (%) Projections by Distribution Channel, 2024 to 2034

Figure 27: Global Market Value (US$ Million) Analysis by Food Type, 2019 to 2034

Figure 28: Global Market Volume (Unit Pack) Analysis by Food Type, 2019 to 2034

Figure 29: Global Market Value Share (%) and BPS Analysis by Food Type, 2024 to 2034

Figure 30: Global Market Y-o-Y Growth (%) Projections by Food Type, 2024 to 2034

Figure 31: Global Market Attractiveness by Pet, 2024 to 2034

Figure 32: Global Market Attractiveness by Application, 2024 to 2034

Figure 33: Global Market Attractiveness by Source, 2024 to 2034

Figure 34: Global Market Attractiveness by Distribution Channel, 2024 to 2034

Figure 35: Global Market Attractiveness by Food Type, 2024 to 2034

Figure 36: Global Market Attractiveness by Region, 2024 to 2034

Figure 37: North America Market Value (US$ Million) by Pet, 2024 to 2034

Figure 38: North America Market Value (US$ Million) by Application, 2024 to 2034

Figure 39: North America Market Value (US$ Million) by Source, 2024 to 2034

Figure 40: North America Market Value (US$ Million) by Distribution Channel, 2024 to 2034

Figure 41: North America Market Value (US$ Million) by Food Type, 2024 to 2034

Figure 42: North America Market Value (US$ Million) by Country, 2024 to 2034

Figure 43: North America Market Value (US$ Million) Analysis by Country, 2019 to 2034

Figure 44: North America Market Volume (Unit Pack) Analysis by Country, 2019 to 2034

Figure 45: North America Market Value Share (%) and BPS Analysis by Country, 2024 to 2034

Figure 46: North America Market Y-o-Y Growth (%) Projections by Country, 2024 to 2034

Figure 47: North America Market Value (US$ Million) Analysis by Pet, 2019 to 2034

Figure 48: North America Market Volume (Unit Pack) Analysis by Pet, 2019 to 2034

Figure 49: North America Market Value Share (%) and BPS Analysis by Pet, 2024 to 2034

Figure 50: North America Market Y-o-Y Growth (%) Projections by Pet, 2024 to 2034

Figure 51: North America Market Value (US$ Million) Analysis by Application, 2019 to 2034

Figure 52: North America Market Volume (Unit Pack) Analysis by Application, 2019 to 2034

Figure 53: North America Market Value Share (%) and BPS Analysis by Application, 2024 to 2034

Figure 54: North America Market Y-o-Y Growth (%) Projections by Application, 2024 to 2034

Figure 55: North America Market Value (US$ Million) Analysis by Source, 2019 to 2034

Figure 56: North America Market Volume (Unit Pack) Analysis by Source, 2019 to 2034

Figure 57: North America Market Value Share (%) and BPS Analysis by Source, 2024 to 2034

Figure 58: North America Market Y-o-Y Growth (%) Projections by Source, 2024 to 2034

Figure 59: North America Market Value (US$ Million) Analysis by Distribution Channel, 2019 to 2034

Figure 60: North America Market Volume (Unit Pack) Analysis by Distribution Channel, 2019 to 2034

Figure 61: North America Market Value Share (%) and BPS Analysis by Distribution Channel, 2024 to 2034

Figure 62: North America Market Y-o-Y Growth (%) Projections by Distribution Channel, 2024 to 2034

Figure 63: North America Market Value (US$ Million) Analysis by Food Type, 2019 to 2034

Figure 64: North America Market Volume (Unit Pack) Analysis by Food Type, 2019 to 2034

Figure 65: North America Market Value Share (%) and BPS Analysis by Food Type, 2024 to 2034

Figure 66: North America Market Y-o-Y Growth (%) Projections by Food Type, 2024 to 2034

Figure 67: North America Market Attractiveness by Pet, 2024 to 2034

Figure 68: North America Market Attractiveness by Application, 2024 to 2034

Figure 69: North America Market Attractiveness by Source, 2024 to 2034

Figure 70: North America Market Attractiveness by Distribution Channel, 2024 to 2034

Figure 71: North America Market Attractiveness by Food Type, 2024 to 2034

Figure 72: North America Market Attractiveness by Country, 2024 to 2034

Figure 73: Latin America Market Value (US$ Million) by Pet, 2024 to 2034

Figure 74: Latin America Market Value (US$ Million) by Application, 2024 to 2034

Figure 75: Latin America Market Value (US$ Million) by Source, 2024 to 2034

Figure 76: Latin America Market Value (US$ Million) by Distribution Channel, 2024 to 2034

Figure 77: Latin America Market Value (US$ Million) by Food Type, 2024 to 2034

Figure 78: Latin America Market Value (US$ Million) by Country, 2024 to 2034

Figure 79: Latin America Market Value (US$ Million) Analysis by Country, 2019 to 2034

Figure 80: Latin America Market Volume (Unit Pack) Analysis by Country, 2019 to 2034

Figure 81: Latin America Market Value Share (%) and BPS Analysis by Country, 2024 to 2034

Figure 82: Latin America Market Y-o-Y Growth (%) Projections by Country, 2024 to 2034

Figure 83: Latin America Market Value (US$ Million) Analysis by Pet, 2019 to 2034

Figure 84: Latin America Market Volume (Unit Pack) Analysis by Pet, 2019 to 2034

Figure 85: Latin America Market Value Share (%) and BPS Analysis by Pet, 2024 to 2034

Figure 86: Latin America Market Y-o-Y Growth (%) Projections by Pet, 2024 to 2034

Figure 87: Latin America Market Value (US$ Million) Analysis by Application, 2019 to 2034

Figure 88: Latin America Market Volume (Unit Pack) Analysis by Application, 2019 to 2034

Figure 89: Latin America Market Value Share (%) and BPS Analysis by Application, 2024 to 2034

Figure 90: Latin America Market Y-o-Y Growth (%) Projections by Application, 2024 to 2034

Figure 91: Latin America Market Value (US$ Million) Analysis by Source, 2019 to 2034

Figure 92: Latin America Market Volume (Unit Pack) Analysis by Source, 2019 to 2034

Figure 93: Latin America Market Value Share (%) and BPS Analysis by Source, 2024 to 2034

Figure 94: Latin America Market Y-o-Y Growth (%) Projections by Source, 2024 to 2034

Figure 95: Latin America Market Value (US$ Million) Analysis by Distribution Channel, 2019 to 2034

Figure 96: Latin America Market Volume (Unit Pack) Analysis by Distribution Channel, 2019 to 2034

Figure 97: Latin America Market Value Share (%) and BPS Analysis by Distribution Channel, 2024 to 2034

Figure 98: Latin America Market Y-o-Y Growth (%) Projections by Distribution Channel, 2024 to 2034

Figure 99: Latin America Market Value (US$ Million) Analysis by Food Type, 2019 to 2034

Figure 100: Latin America Market Volume (Unit Pack) Analysis by Food Type, 2019 to 2034

Figure 101: Latin America Market Value Share (%) and BPS Analysis by Food Type, 2024 to 2034

Figure 102: Latin America Market Y-o-Y Growth (%) Projections by Food Type, 2024 to 2034

Figure 103: Latin America Market Attractiveness by Pet, 2024 to 2034

Figure 104: Latin America Market Attractiveness by Application, 2024 to 2034

Figure 105: Latin America Market Attractiveness by Source, 2024 to 2034

Figure 106: Latin America Market Attractiveness by Distribution Channel, 2024 to 2034

Figure 107: Latin America Market Attractiveness by Food Type, 2024 to 2034

Figure 108: Latin America Market Attractiveness by Country, 2024 to 2034

Figure 109: Western Europe Market Value (US$ Million) by Pet, 2024 to 2034

Figure 110: Western Europe Market Value (US$ Million) by Application, 2024 to 2034

Figure 111: Western Europe Market Value (US$ Million) by Source, 2024 to 2034

Figure 112: Western Europe Market Value (US$ Million) by Distribution Channel, 2024 to 2034

Figure 113: Western Europe Market Value (US$ Million) by Food Type, 2024 to 2034

Figure 114: Western Europe Market Value (US$ Million) by Country, 2024 to 2034

Figure 115: Western Europe Market Value (US$ Million) Analysis by Country, 2019 to 2034

Figure 116: Western Europe Market Volume (Unit Pack) Analysis by Country, 2019 to 2034

Figure 117: Western Europe Market Value Share (%) and BPS Analysis by Country, 2024 to 2034

Figure 118: Western Europe Market Y-o-Y Growth (%) Projections by Country, 2024 to 2034

Figure 119: Western Europe Market Value (US$ Million) Analysis by Pet, 2019 to 2034

Figure 120: Western Europe Market Volume (Unit Pack) Analysis by Pet, 2019 to 2034

Figure 121: Western Europe Market Value Share (%) and BPS Analysis by Pet, 2024 to 2034

Figure 122: Western Europe Market Y-o-Y Growth (%) Projections by Pet, 2024 to 2034

Figure 123: Western Europe Market Value (US$ Million) Analysis by Application, 2019 to 2034

Figure 124: Western Europe Market Volume (Unit Pack) Analysis by Application, 2019 to 2034

Figure 125: Western Europe Market Value Share (%) and BPS Analysis by Application, 2024 to 2034

Figure 126: Western Europe Market Y-o-Y Growth (%) Projections by Application, 2024 to 2034

Figure 127: Western Europe Market Value (US$ Million) Analysis by Source, 2019 to 2034

Figure 128: Western Europe Market Volume (Unit Pack) Analysis by Source, 2019 to 2034

Figure 129: Western Europe Market Value Share (%) and BPS Analysis by Source, 2024 to 2034

Figure 130: Western Europe Market Y-o-Y Growth (%) Projections by Source, 2024 to 2034

Figure 131: Western Europe Market Value (US$ Million) Analysis by Distribution Channel, 2019 to 2034

Figure 132: Western Europe Market Volume (Unit Pack) Analysis by Distribution Channel, 2019 to 2034

Figure 133: Western Europe Market Value Share (%) and BPS Analysis by Distribution Channel, 2024 to 2034

Figure 134: Western Europe Market Y-o-Y Growth (%) Projections by Distribution Channel, 2024 to 2034

Figure 135: Western Europe Market Value (US$ Million) Analysis by Food Type, 2019 to 2034

Figure 136: Western Europe Market Volume (Unit Pack) Analysis by Food Type, 2019 to 2034

Figure 137: Western Europe Market Value Share (%) and BPS Analysis by Food Type, 2024 to 2034

Figure 138: Western Europe Market Y-o-Y Growth (%) Projections by Food Type, 2024 to 2034

Figure 139: Western Europe Market Attractiveness by Pet, 2024 to 2034

Figure 140: Western Europe Market Attractiveness by Application, 2024 to 2034

Figure 141: Western Europe Market Attractiveness by Source, 2024 to 2034

Figure 142: Western Europe Market Attractiveness by Distribution Channel, 2024 to 2034

Figure 143: Western Europe Market Attractiveness by Food Type, 2024 to 2034

Figure 144: Western Europe Market Attractiveness by Country, 2024 to 2034

Figure 145: Eastern Europe Market Value (US$ Million) by Pet, 2024 to 2034

Figure 146: Eastern Europe Market Value (US$ Million) by Application, 2024 to 2034

Figure 147: Eastern Europe Market Value (US$ Million) by Source, 2024 to 2034

Figure 148: Eastern Europe Market Value (US$ Million) by Distribution Channel, 2024 to 2034

Figure 149: Eastern Europe Market Value (US$ Million) by Food Type, 2024 to 2034

Figure 150: Eastern Europe Market Value (US$ Million) by Country, 2024 to 2034

Figure 151: Eastern Europe Market Value (US$ Million) Analysis by Country, 2019 to 2034

Figure 152: Eastern Europe Market Volume (Unit Pack) Analysis by Country, 2019 to 2034

Figure 153: Eastern Europe Market Value Share (%) and BPS Analysis by Country, 2024 to 2034

Figure 154: Eastern Europe Market Y-o-Y Growth (%) Projections by Country, 2024 to 2034

Figure 155: Eastern Europe Market Value (US$ Million) Analysis by Pet, 2019 to 2034

Figure 156: Eastern Europe Market Volume (Unit Pack) Analysis by Pet, 2019 to 2034

Figure 157: Eastern Europe Market Value Share (%) and BPS Analysis by Pet, 2024 to 2034

Figure 158: Eastern Europe Market Y-o-Y Growth (%) Projections by Pet, 2024 to 2034

Figure 159: Eastern Europe Market Value (US$ Million) Analysis by Application, 2019 to 2034

Figure 160: Eastern Europe Market Volume (Unit Pack) Analysis by Application, 2019 to 2034

Figure 161: Eastern Europe Market Value Share (%) and BPS Analysis by Application, 2024 to 2034

Figure 162: Eastern Europe Market Y-o-Y Growth (%) Projections by Application, 2024 to 2034

Figure 163: Eastern Europe Market Value (US$ Million) Analysis by Source, 2019 to 2034

Figure 164: Eastern Europe Market Volume (Unit Pack) Analysis by Source, 2019 to 2034

Figure 165: Eastern Europe Market Value Share (%) and BPS Analysis by Source, 2024 to 2034

Figure 166: Eastern Europe Market Y-o-Y Growth (%) Projections by Source, 2024 to 2034

Figure 167: Eastern Europe Market Value (US$ Million) Analysis by Distribution Channel, 2019 to 2034

Figure 168: Eastern Europe Market Volume (Unit Pack) Analysis by Distribution Channel, 2019 to 2034

Figure 169: Eastern Europe Market Value Share (%) and BPS Analysis by Distribution Channel, 2024 to 2034

Figure 170: Eastern Europe Market Y-o-Y Growth (%) Projections by Distribution Channel, 2024 to 2034

Figure 171: Eastern Europe Market Value (US$ Million) Analysis by Food Type, 2019 to 2034

Figure 172: Eastern Europe Market Volume (Unit Pack) Analysis by Food Type, 2019 to 2034

Figure 173: Eastern Europe Market Value Share (%) and BPS Analysis by Food Type, 2024 to 2034

Figure 174: Eastern Europe Market Y-o-Y Growth (%) Projections by Food Type, 2024 to 2034

Figure 175: Eastern Europe Market Attractiveness by Pet, 2024 to 2034

Figure 176: Eastern Europe Market Attractiveness by Application, 2024 to 2034

Figure 177: Eastern Europe Market Attractiveness by Source, 2024 to 2034

Figure 178: Eastern Europe Market Attractiveness by Distribution Channel, 2024 to 2034

Figure 179: Eastern Europe Market Attractiveness by Food Type, 2024 to 2034

Figure 180: Eastern Europe Market Attractiveness by Country, 2024 to 2034

Figure 181: South Asia and Pacific Market Value (US$ Million) by Pet, 2024 to 2034

Figure 182: South Asia and Pacific Market Value (US$ Million) by Application, 2024 to 2034

Figure 183: South Asia and Pacific Market Value (US$ Million) by Source, 2024 to 2034

Figure 184: South Asia and Pacific Market Value (US$ Million) by Distribution Channel, 2024 to 2034

Figure 185: South Asia and Pacific Market Value (US$ Million) by Food Type, 2024 to 2034

Figure 186: South Asia and Pacific Market Value (US$ Million) by Country, 2024 to 2034

Figure 187: South Asia and Pacific Market Value (US$ Million) Analysis by Country, 2019 to 2034

Figure 188: South Asia and Pacific Market Volume (Unit Pack) Analysis by Country, 2019 to 2034

Figure 189: South Asia and Pacific Market Value Share (%) and BPS Analysis by Country, 2024 to 2034

Figure 190: South Asia and Pacific Market Y-o-Y Growth (%) Projections by Country, 2024 to 2034

Figure 191: South Asia and Pacific Market Value (US$ Million) Analysis by Pet, 2019 to 2034

Figure 192: South Asia and Pacific Market Volume (Unit Pack) Analysis by Pet, 2019 to 2034

Figure 193: South Asia and Pacific Market Value Share (%) and BPS Analysis by Pet, 2024 to 2034

Figure 194: South Asia and Pacific Market Y-o-Y Growth (%) Projections by Pet, 2024 to 2034

Figure 195: South Asia and Pacific Market Value (US$ Million) Analysis by Application, 2019 to 2034

Figure 196: South Asia and Pacific Market Volume (Unit Pack) Analysis by Application, 2019 to 2034

Figure 197: South Asia and Pacific Market Value Share (%) and BPS Analysis by Application, 2024 to 2034

Figure 198: South Asia and Pacific Market Y-o-Y Growth (%) Projections by Application, 2024 to 2034

Figure 199: South Asia and Pacific Market Value (US$ Million) Analysis by Source, 2019 to 2034

Figure 200: South Asia and Pacific Market Volume (Unit Pack) Analysis by Source, 2019 to 2034

Figure 201: South Asia and Pacific Market Value Share (%) and BPS Analysis by Source, 2024 to 2034

Figure 202: South Asia and Pacific Market Y-o-Y Growth (%) Projections by Source, 2024 to 2034

Figure 203: South Asia and Pacific Market Value (US$ Million) Analysis by Distribution Channel, 2019 to 2034

Figure 204: South Asia and Pacific Market Volume (Unit Pack) Analysis by Distribution Channel, 2019 to 2034

Figure 205: South Asia and Pacific Market Value Share (%) and BPS Analysis by Distribution Channel, 2024 to 2034

Figure 206: South Asia and Pacific Market Y-o-Y Growth (%) Projections by Distribution Channel, 2024 to 2034

Figure 207: South Asia and Pacific Market Value (US$ Million) Analysis by Food Type, 2019 to 2034

Figure 208: South Asia and Pacific Market Volume (Unit Pack) Analysis by Food Type, 2019 to 2034

Figure 209: South Asia and Pacific Market Value Share (%) and BPS Analysis by Food Type, 2024 to 2034

Figure 210: South Asia and Pacific Market Y-o-Y Growth (%) Projections by Food Type, 2024 to 2034

Figure 211: South Asia and Pacific Market Attractiveness by Pet, 2024 to 2034

Figure 212: South Asia and Pacific Market Attractiveness by Application, 2024 to 2034

Figure 213: South Asia and Pacific Market Attractiveness by Source, 2024 to 2034

Figure 214: South Asia and Pacific Market Attractiveness by Distribution Channel, 2024 to 2034

Figure 215: South Asia and Pacific Market Attractiveness by Food Type, 2024 to 2034

Figure 216: South Asia and Pacific Market Attractiveness by Country, 2024 to 2034

Figure 217: East Asia Market Value (US$ Million) by Pet, 2024 to 2034

Figure 218: East Asia Market Value (US$ Million) by Application, 2024 to 2034

Figure 219: East Asia Market Value (US$ Million) by Source, 2024 to 2034

Figure 220: East Asia Market Value (US$ Million) by Distribution Channel, 2024 to 2034

Figure 221: East Asia Market Value (US$ Million) by Food Type, 2024 to 2034

Figure 222: East Asia Market Value (US$ Million) by Country, 2024 to 2034

Figure 223: East Asia Market Value (US$ Million) Analysis by Country, 2019 to 2034

Figure 224: East Asia Market Volume (Unit Pack) Analysis by Country, 2019 to 2034

Figure 225: East Asia Market Value Share (%) and BPS Analysis by Country, 2024 to 2034

Figure 226: East Asia Market Y-o-Y Growth (%) Projections by Country, 2024 to 2034

Figure 227: East Asia Market Value (US$ Million) Analysis by Pet, 2019 to 2034

Figure 228: East Asia Market Volume (Unit Pack) Analysis by Pet, 2019 to 2034

Figure 229: East Asia Market Value Share (%) and BPS Analysis by Pet, 2024 to 2034

Figure 230: East Asia Market Y-o-Y Growth (%) Projections by Pet, 2024 to 2034

Figure 231: East Asia Market Value (US$ Million) Analysis by Application, 2019 to 2034

Figure 232: East Asia Market Volume (Unit Pack) Analysis by Application, 2019 to 2034

Figure 233: East Asia Market Value Share (%) and BPS Analysis by Application, 2024 to 2034

Figure 234: East Asia Market Y-o-Y Growth (%) Projections by Application, 2024 to 2034

Figure 235: East Asia Market Value (US$ Million) Analysis by Source, 2019 to 2034

Figure 236: East Asia Market Volume (Unit Pack) Analysis by Source, 2019 to 2034

Figure 237: East Asia Market Value Share (%) and BPS Analysis by Source, 2024 to 2034

Figure 238: East Asia Market Y-o-Y Growth (%) Projections by Source, 2024 to 2034

Figure 239: East Asia Market Value (US$ Million) Analysis by Distribution Channel, 2019 to 2034

Figure 240: East Asia Market Volume (Unit Pack) Analysis by Distribution Channel, 2019 to 2034

Figure 241: East Asia Market Value Share (%) and BPS Analysis by Distribution Channel, 2024 to 2034

Figure 242: East Asia Market Y-o-Y Growth (%) Projections by Distribution Channel, 2024 to 2034

Figure 243: East Asia Market Value (US$ Million) Analysis by Food Type, 2019 to 2034

Figure 244: East Asia Market Volume (Unit Pack) Analysis by Food Type, 2019 to 2034

Figure 245: East Asia Market Value Share (%) and BPS Analysis by Food Type, 2024 to 2034

Figure 246: East Asia Market Y-o-Y Growth (%) Projections by Food Type, 2024 to 2034

Figure 247: East Asia Market Attractiveness by Pet, 2024 to 2034

Figure 248: East Asia Market Attractiveness by Application, 2024 to 2034

Figure 249: East Asia Market Attractiveness by Source, 2024 to 2034

Figure 250: East Asia Market Attractiveness by Distribution Channel, 2024 to 2034

Figure 251: East Asia Market Attractiveness by Food Type, 2024 to 2034

Figure 252: East Asia Market Attractiveness by Country, 2024 to 2034

Figure 253: Middle East and Africa Market Value (US$ Million) by Pet, 2024 to 2034

Figure 254: Middle East and Africa Market Value (US$ Million) by Application, 2024 to 2034

Figure 255: Middle East and Africa Market Value (US$ Million) by Source, 2024 to 2034

Figure 256: Middle East and Africa Market Value (US$ Million) by Distribution Channel, 2024 to 2034

Figure 257: Middle East and Africa Market Value (US$ Million) by Food Type, 2024 to 2034

Figure 258: Middle East and Africa Market Value (US$ Million) by Country, 2024 to 2034

Figure 259: Middle East and Africa Market Value (US$ Million) Analysis by Country, 2019 to 2034

Figure 260: Middle East and Africa Market Volume (Unit Pack) Analysis by Country, 2019 to 2034

Figure 261: Middle East and Africa Market Value Share (%) and BPS Analysis by Country, 2024 to 2034

Figure 262: Middle East and Africa Market Y-o-Y Growth (%) Projections by Country, 2024 to 2034

Figure 263: Middle East and Africa Market Value (US$ Million) Analysis by Pet, 2019 to 2034

Figure 264: Middle East and Africa Market Volume (Unit Pack) Analysis by Pet, 2019 to 2034

Figure 265: Middle East and Africa Market Value Share (%) and BPS Analysis by Pet, 2024 to 2034

Figure 266: Middle East and Africa Market Y-o-Y Growth (%) Projections by Pet, 2024 to 2034

Figure 267: Middle East and Africa Market Value (US$ Million) Analysis by Application, 2019 to 2034

Figure 268: Middle East and Africa Market Volume (Unit Pack) Analysis by Application, 2019 to 2034

Figure 269: Middle East and Africa Market Value Share (%) and BPS Analysis by Application, 2024 to 2034

Figure 270: Middle East and Africa Market Y-o-Y Growth (%) Projections by Application, 2024 to 2034

Figure 271: Middle East and Africa Market Value (US$ Million) Analysis by Source, 2019 to 2034

Figure 272: Middle East and Africa Market Volume (Unit Pack) Analysis by Source, 2019 to 2034

Figure 273: Middle East and Africa Market Value Share (%) and BPS Analysis by Source, 2024 to 2034

Figure 274: Middle East and Africa Market Y-o-Y Growth (%) Projections by Source, 2024 to 2034

Figure 275: Middle East and Africa Market Value (US$ Million) Analysis by Distribution Channel, 2019 to 2034

Figure 276: Middle East and Africa Market Volume (Unit Pack) Analysis by Distribution Channel, 2019 to 2034

Figure 277: Middle East and Africa Market Value Share (%) and BPS Analysis by Distribution Channel, 2024 to 2034

Figure 278: Middle East and Africa Market Y-o-Y Growth (%) Projections by Distribution Channel, 2024 to 2034

Figure 279: Middle East and Africa Market Value (US$ Million) Analysis by Food Type, 2019 to 2034

Figure 280: Middle East and Africa Market Volume (Unit Pack) Analysis by Food Type, 2019 to 2034

Figure 281: Middle East and Africa Market Value Share (%) and BPS Analysis by Food Type, 2024 to 2034

Figure 282: Middle East and Africa Market Y-o-Y Growth (%) Projections by Food Type, 2024 to 2034

Figure 283: Middle East and Africa Market Attractiveness by Pet, 2024 to 2034

Figure 284: Middle East and Africa Market Attractiveness by Application, 2024 to 2034

Figure 285: Middle East and Africa Market Attractiveness by Source, 2024 to 2034

Figure 286: Middle East and Africa Market Attractiveness by Distribution Channel, 2024 to 2034

Figure 287: Middle East and Africa Market Attractiveness by Food Type, 2024 to 2034

Figure 288: Middle East and Africa Market Attractiveness by Country, 2024 to 2034

Recommendations

Food and Beverage

Pet Food Preservative Market

Published : March 2024

Food and Beverage

Pet Dietary Supplement Market

Published : October 2023

Food and Beverage

Pet Food Ingredients Market

Published : February 2023

Food and Beverage

Organic Pet Food Market

Published : October 2022

Explore Consumer Product Insights

View Reports

Pet Food and Supplement Market