PET Stretch Blow Molding Machines Market
Why are Cosmetics & Personal Care Products Manufacturers across Japan, Korea, the U.S., Germany, the U.K., & 30+ Countries Choosing PET Stretch Blow Molding Machines for Providing Customized Packaging? Find Out in FMI’s Report!
PET Stretch Blow Molding Machines Market by Technology Type, Orientation Type, End Use Industry & Region | Forecast 2023 to 2033
PET Stretch Blow Molding Machines Market Outlook (2023 to 2033)
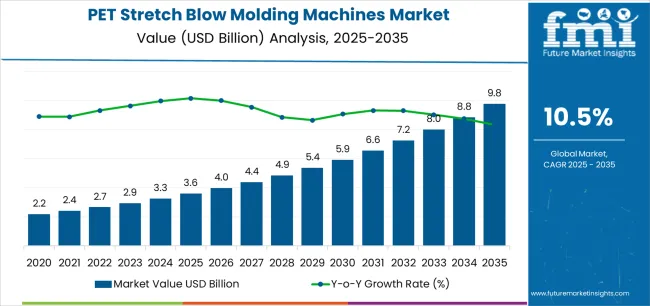
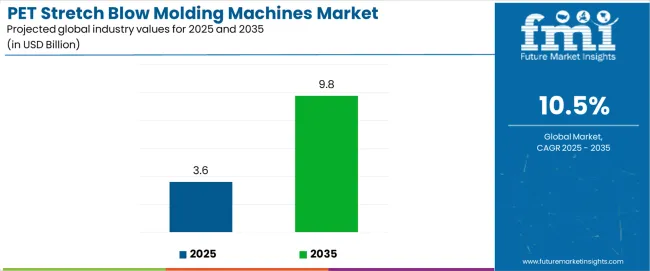
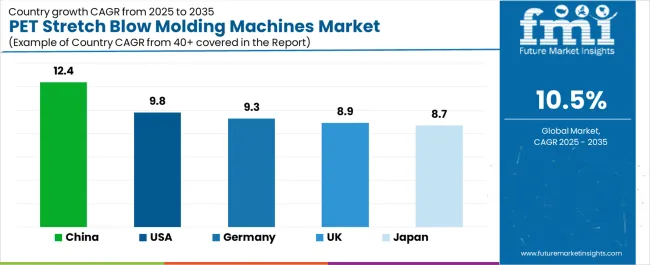
The global PET stretch blow molding machines market is set to gain a valuation of US$ 760.0 Million in 2023 and is going to further expand at a CAGR of 2.9% from 2023 to 2033. A valuation of US$ 978.4 Million is set to be registered by the market by the end of 2033. By the end of 2022, the top 5 PET stretch blow molding machine providers are projected to capture nearly 15 to 20% of the market.
Substantially increased production outputs in manufacturing industries are the result of the increased use of automation for producing a large number of products. PET stretch blow molding machines produce a large number of PET bottles that are used for packaging purposes in various end-use industries. PET stretch blow molding machines are extensively used by large-scale bottle manufacturing industries for faster production.
PET stretch blow molding machines are widely used by manufacturers, and easily available in the market in various types and models. Single-step and two-step PET stretch blow molding machines are available in the market for purchase.
In single-step blow molding machines, a preform is molded and conditioned at the proper temperature. It is then blown into containers by inserting the mold in a single stretch, which forms a continuous process. In two-step blow molding machines, on the other hand, a preform is blow molded and then stored for some period of time, maybe up to 1 to 4 days, and then blown into containers by using reheat blow machines.
Based on technology type, the single-step segment is projected to create an absolute dollar growth opportunity in the global market for PET stretch blow molding machines due to increasing production rates of manufacturing industries. The single-step PET stretch blow molding machines segment is likely to surge 1.4 times during the forecast period.
According to Future Market Insights, the PET stretch blow molding machines industry revenue boomed to US$ 735.2 Million in 2022. Considering the increased application of PET bottles in packaging, the market is projected to witness robust growth throughout the estimated time frame.
The PET stretch blow molding machines industry is anticipated to create an incremental growth opportunity of US$ 243.2 Million during the projected time frame. The personal care & cosmetics industry is set to fuel the demand for PET stretch blow molding machines. The PET stretch blow molding machines industry is predicted to expand 1.3 times throughout the assessment period.
Attributes |
Key Insights |
Global PET Stretch Blow Molding Machines Market Estimated Size (2023E) |
US$ 760.0 Million |
Projected Market Valuation (2033F) |
US$ 978.4 Million |
Value-based CAGR (2023 to 2033) |
2.9% |
Collective Value Share: Top 3 Countries (2023E) |
30 to 35% |
Let us know your requirement to get
100% FREE customization
2017 to 2022 PET Stretch Blow Molding Machines Market Outlook Compared to 2023 to 2033 Demand Forecast
The global PET stretch blow molding machines market has anticipated a CAGR of 1.4% during the historical period with a market value of US$ 735.2 Million in 2022 from US$ 675.3 Million recorded in 2017.
During the historical period, the PET stretch blow molding machines demand was fueled by increased production and consumption of beverages. Also, PET bottles had extensive usage in the packaging of various liquid-based products as they are considered to be lightweight and cost-effective solutions.
PET is a recyclable material that is projected to be adopted by many brands for packaging. Increased demand for plastic PET bottles by numerous brands is rising globally because of the clarity provided by these bottles, which allows for customizing their aesthetics by the application of attractive labels.
Moreover, the expansion of the pharmaceutical and cosmetics industries in recent times is set to contribute to increased PET stretch blow molding machine sales in the global market. Growth in the packaged drinks market in the last few years is also likely to drive sales of PET stretch blow molding machines. Escalating industrialization and improvement in technology are a couple of other significant factors propelling demand in the PET stretch blow molding machines market.
Top Trends Pushing the Demand for PET Stretch Blow Molding Machines
- Burgeoning Demand for Customized Containers to Fuel Sales
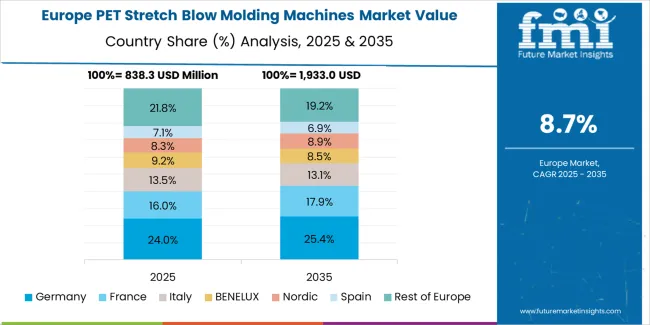
European nations like Germany, Italy, France, and others have witnessed increasing levels of automation, which has made it possible for manufacturers to create PET bottles more quickly and effectively. Several manufacturers are concentrating on sterilizing and expressing interest in automation.
Increasing demand for plastic bottles supporting the sharp rise in stretch blow molding machines sales is attributed to the expansion of the FMCG, retail, and pharmaceutical industries. The beverage industry in particular has seen rising consumer expectations and high demand for lightning-fast order fulfillment and delivery.
Decision-makers are being forced to adopt new perspectives in order to satisfy the widening range of client expectations, including those for customized container designs. Production is expanding gradually to meet this need. In order to improve supply, players are condensing production concurrently by building new green-field facilities and enlarging warehouses with the same footprint. This is encouraging the development of automatic stretch blow molding machines.
Find your sweet spots for generating winning opportunities in this market.
Talk to AnalystCountry-wise Insights
How Would Germany Create New Growth Opportunities for PET Stretch Blow Molding Machines Providers?
Sales of PET Blow Machines to Elevate across Germany Amid High Demand for Personal Care Products
Expanding the cosmetic industry along with a ban on single-use non-recyclable plastic items in Germany would fuel the demand for PET products such as PET bottles, which would help to bolster sales of PET stretch blow molding machines. The market for PET stretch blow molding machines in Germany is estimated to reach US$ 48.0 Million by the end of 2023. It is projected to create an incremental opportunity of US$ 11.9 Million from 2023 to 2033, says FMI.
According to the Cosmetics Europe - The Personal Care Association, Germany was one of the largest markets for cosmetic and personal care products in 2020 Europe. Thus, the country being the largest market for cosmetic and personal care products, is anticipated to create a new growth opportunity for PET stretch blow molding machines manufacturing companies.
Why is India Estimated to Augment Sales of PET Stretch Blow Molding Machines?
Pharmaceutical Companies in India to Demand Blow Molding Machines by 2033
The growing Indian pharmaceutical industry is a major factor propelling the demand for PET stretch blow molding machines in the country. India is expected to hold around 45% of the market value share by the end of 2025, suggests FMI.
As per a report published by the Ministry of Commerce and Industry, exports of Indian drug and pharmaceutical products were worth US$ 24.6 billion in the year 2022 from US$ 24.4 billion in the year 2021. The pharmaceutical sector in the country provides more than 50% of global vaccine demand, 40% of generic demand, and 25% of all medicines in the United Kingdom
Indian pharmaceutical companies have around 10,500 manufacturing units at the domestic level and nearly 3000 drug companies. India is thus estimated to augment sales of PET stretch molding machines in the next ten years with the expanding pharmaceutical industry.
Category-wise Insights
Which is the Most Preferred Type of Technology across the Globe?
Demand for Single-Step Plastic Bottle Preform Machines to Skyrocket
Based on technology type, the single-step segment is expected to lead the PET stretch blow molding machines market during the forecast period. Single-step PET stretch blow molding machines provide faster production of bottles, as compared to two-step machines. Also, these machines are economical as they can easily complete the process in a single stage. Thus, as per FMI, the segment is expected to cover 62% of the global market share by the end of 2033.
Which is the Leading End Use Industry for PET Stretch Blow Molding Machines Manufacturers?
Personal Care & Cosmetics Manufacturers to Look for Advanced HDPE Blow Molding Machines
The ongoing expansion of the market for beauty and cosmetics products is projected to generate high demand for PET stretch blow molding machines. The personal care & cosmetics segment by end-use industry is projected to offer a lucrative growth opportunity for the global market for PET stretch blow molding machines. The target segment is estimated to create an incremental growth opportunity of US$ 72.4 Million during the estimated time period.

A unified Market Research Subscription Platform, built for today's disparate research needs.
Competitive Landscape
Leading players in the PET stretch blow molding machines market faced a reduction in sales and market share during the pandemic. Currently, major players are gaining high value by developing new products in the PET stretch blow molding machines market. They are engaging in mergers & acquisitions, collaborations, partnerships, new product launches, and joint ventures to compete in the global market.
Recent activities and mergers implemented by PET stretch blow molding machines manufacturers are:
- In November 2022, Krones AG announced the acquisition of Research and Development Custom Automation LLC. It is a reputed supplier of machinery and equipment for the production and filling of containers. Krones aims to expand its capabilities in the pharmaceutical market with the help of this acquisition.
- In July 2020, Jomar Corp announced its partnership with AUTOMA by MAGIC Srl by signing an agreement with it. The latter will be the exclusive distributor of extrusion blow molding machines in North America.
Scope of the Report
Attribute |
Details |
Estimated Market Size (2023) |
US$ 760.0 Million |
Projected Market Valuation (2033) |
US$ 978.4 Million |
Value-based CAGR (2023 to 2033) |
2.9% |
Historical Data |
2017 to 2022 |
Forecast Period |
2023 to 2033 |
Quantitative Units |
Value (US$ Million) |
Report Coverage |
Revenue Forecast, Volume Forecast, Company Ranking, Competitive Landscape, Growth Factors, Trends, and Pricing Analysis |
Segments Covered |
|
Regions Covered |
|
Key Countries Covered |
|
Key Companies Profiled |
|
PET Stretch Blow Molding Machines Market Outlook by Category
By Technology Type:
- Single Step
- Two Step
By Orientation Type:
- Linear
- Rotary
By End Use Industry:
- Food
- Beverages
- Pharmaceuticals
- Personal Care & Cosmetics
- Others
By Region:
- North America
- Latin America
- Europe
- Middle East and Africa
- Asia Pacific excluding Japan and China (APEJC)
- Japan
- China
Frequently Asked Questions
What was the value of the PET stretch blow molding machines industry in 2022?
In 2022, the value of the global PET stretch blow molding machines industry was US$ 735.2 Million.
At what rate is the global PET stretch blow molding machines industry projected to expand during the forecast period?
During the forecast period, the global PET stretch blow molding machines industry is anticipated to expand at a CAGR of 2.9%.
By 2033, what will the value of the global PET stretch blow molding machines industry?
The global PET stretch blow molding machines industry is expected to reach US$ 978.4 Million by the end of 2033.
Which orientation type segment is expected to lead the global PET stretch blow molding machines industry during the forecast period?
During the forecast period, the rotary segment is likely to be the fastest-growing orientation type segment in the global PET stretch blow molding machines industry.
Which factor would drive the demand for PET stretch blow molding machines?
Increasing sales of beverages such as soft drinks, mineral water, and others would drive demand for PET stretch blow molding machines.
Who are the top players supplementing the PET stretch blow molding machines industry?
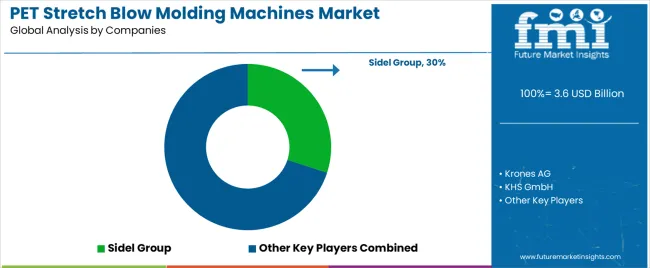
Krones AG, KHS GmbH, Sidel, Sacmi Imola S.C., Nissei ASB Machine Co., Ltd., KHS GmbH, and SIPA S.p.A. are the top players supplementing the PET stretch blow molding machines industry.
What is the future growth outlook for the global PET stretch blow molding machines industry?
The global PET stretch blow molding machines industry is projected to create a growth opportunity of US$ 243.2 Million from 2023 to 2033.
Table of Content
1. Executive Summary | PET Stretch Blow Molding Machines Market 1.1. Global Market Outlook 1.2. Demand Side Trends 1.3. Supply Side Trends 1.4. Orientation Type Roadmap 1.5. Analysis and Recommendations 2. Market Overview 2.1. Market Coverage / Taxonomy 2.2. Market Definition / Scope / Limitations 3. Key Market Trends 3.1. Key Trends Impacting the Market 3.2. End-Use Industry Innovation / Development Trends 4. Key Success Factors 4.1. End-Use Industry Adoption / Usage Analysis 4.2. End-Use Industry USPs / Features 4.3. Strategic Promotional Strategies 5. Market Demand Analysis 2017 to 2022 and Forecast, 2023 to 2033 5.1. Historical Market Volume (Units) Analysis, 2017 to 2022 5.2. Current and Future Market Volume (Units) Projections, 2023 to 2033 5.3. Y-o-Y Growth Trend Analysis 6. Market - Pricing Analysis 6.1. Regional Pricing Analysis 6.2. Global Average Pricing Analysis Benchmark 7. Market Demand (in Value or Size in US$ Million) Analysis 2017 to 2022 and Forecast, 2023 to 2033 7.1. Historical Market Value (US$ Million) Analysis, 2017 to 2022 7.2. Current and Future Market Value (US$ Million) Projections, 2023 to 2033 7.2.1. Y-o-Y Growth Trend Analysis 7.2.2. Absolute $ Opportunity Analysis 8. Market Background 8.1. Global Packaging Machinery Market Overview 8.2. Macro-Economic Factors 8.3. Forecast Factors - Relevance & Impact 8.4. Value Chain 8.4.1. Exhaustive List of Raw Material Suppliers 8.4.2. Exhaustive List of Manufacturers and Converters 8.4.3. Exhaustive List of End Users / Brand Owners/Customers/Buyers 8.5. COVID-19 Crisis – Impact Assessment 8.5.1. Current Statistics 8.5.2. Short-Mid-Long Term Outlook 8.5.3. Likely Rebound 8.6. Market Dynamics 8.6.1. Drivers 8.6.2. Restraints 8.6.3. Opportunity Analysis 8.7. Supply Demand Analysis 9. Global Market Analysis 2017 to 2022 and Forecast 2023 to 2033, By Technology Type 9.1. Introduction / Key Findings 9.2. Historical Market Size (US$ Million) and Volume Analysis, by Technology Type, 2017 to 2022 9.3. Current and Future Market Size (US$ Million) and Volume Analysis and Forecast, by Technology Type, 2023 to 2033 9.3.1. Single Step 9.3.2. Two Step 9.4. Market Attractiveness Analysis, by Technology Type 9.5. Pricing Analysis by Raw Technology Type 10. Global Market Analysis 2017 to 2022 and Forecast 2023 to 2033, By Orientation Type 10.1. Introduction / Key Findings 10.2. Historical Market Size (US$ Million) and Volume Analysis, by Orientation Type, 2017 to 2022 10.3. Current and Future Market Size (US$ Million) and Volume Analysis and Forecast, by Orientation Type, 2023 to 2033 10.3.1. Linear 10.3.2. Rotary 10.4. Market Attractiveness Analysis, by Orientation Type 11. Global Market Analysis 2017 to 2022 and Forecast 2023 to 2033, By End-Use Industry 11.1. Introduction / Key Findings 11.2. Historical Market Size (US$ Million) and Volume Analysis, by End Use Industry, 2017 to 2022 11.3. Current and Future Market Size (US$ Million) and Volume Analysis and Forecast, by End Use Industry, 2023 to 2033 11.3.1. Food 11.3.2. Beverages 11.3.3. Pharmaceuticals 11.3.4. Personal Care & Cosmetics 11.3.5. Others 11.4. Market Attractiveness Analysis, by End-Use Industry 12. Global Market Analysis 2017 to 2022 and Forecast 2023 to 2033, By Region 12.1. Introduction / Key Findings 12.2. Historical Market Size (US$ Million) and Volume Analysis, by Region, 2017 to 2022 12.3. Current and Future Market Size (US$ Million) and Volume Analysis and Forecast, by Region, 2023 to 2033 12.3.1. North America 12.3.2. Latin America 12.3.3. Europe 12.3.4. Middle East and Africa (MEA) 12.3.5. East Asia 12.3.6. South Asia 12.3.7. Oceania 12.4. Market Attractiveness Analysis, by Region 13. North America Market Analysis 2017 to 2022 and Forecast 2023 to 2033 13.1. Introduction / Key Findings 13.2. Historical Market Size (US$ Million) and Volume (Units) Analysis, by Market Taxonomy, 2017 to 2022 13.3. Current Market Size (US$ Million) and Volume (Units) Analysis and Forecast, by Market Taxonomy, 2023 to 2033 13.3.1. By Country 13.3.1.1. USA 13.3.1.2. Canada 13.3.2. By Technology Type 13.3.3. By Orientation Type 13.3.4. By End Use Industry 13.4. Market Attractiveness Analysis 13.4.1. By Country 13.4.2. By Technology Type 13.4.3. By Orientation Type 13.4.4. By End Use Industry 14. Latin America Market Analysis 2017 to 2022 and Forecast 2023 to 2033 14.1. Introduction / Key Findings 14.2. Historical Market Size (US$ Million) and Volume (Units) Analysis, by Market Taxonomy, 2017 to 2022 14.3. Current Market Size (US$ Million) and Volume (Units) Analysis and Forecast, by Market Taxonomy, 2023 to 2033 14.3.1. By Country 14.3.1.1. Brazil 14.3.1.2. Mexico 14.3.1.3. Argentina 14.3.1.4. Rest of Latin America 14.3.2. By Technology Type 14.3.3. By Orientation Type 14.3.4. By End Use Industry 14.4. By End Use Industry Market Attractiveness Analysis 14.4.1. By Country 14.4.2. By Technology Type 14.4.3. By Orientation Type 14.4.4. By End Use Industry 15. Europe Market Analysis 2017 to 2022 and Forecast 2023 to 2033 15.1. Introduction / Key Findings 15.2. Historical Market Size (US$ Million) and Volume (Units) Analysis, by Market Taxonomy, 2017 to 2022 15.3. Current Market Size (US$ Million) and Volume (Units) Analysis and Forecast, by Market Taxonomy, 2023 to 2033 15.3.1. By Country 15.3.1.1. Germany 15.3.1.2. Italy 15.3.1.3. France 15.3.1.4. Spain 15.3.1.5. United Kingdom 15.3.1.6. Rest of Europe 15.3.2. By Technology Type 15.3.3. By Orientation Type 15.3.4. By End Use Industry 15.4. Market Attractiveness Analysis 15.4.1. By Country 15.4.2. By Technology Type 15.4.3. By Orientation Type 15.4.4. By End Use Industry 16. APEJC Market Analysis 2017 to 2022 and Forecast 2023 to 2033 16.1. Introduction / Key Findings 16.2. Historical Market Size (US$ Million) and Volume (Units) Analysis, by Market Taxonomy, 2017 to 2022 16.3. Current Market Size (US$ Million) and Volume (Units) Analysis and Forecast, by Market Taxonomy, 2023 to 2033 16.3.1. By Country 16.3.1.1. India 16.3.1.2. Thailand 16.3.1.3. Australia 16.3.1.4. Malaysia 16.3.1.5. Rest of Asia Pacific excluding Japan and China (APEJC) 16.3.2. By Technology Type 16.3.3. By Orientation Type 16.3.4. By End Use Industry 16.4. Market Attractiveness Analysis 16.4.1. By Country 16.4.2. By Technology Type 16.4.3. By Orientation Type 16.4.4. By End Use Industry 17. MEA Market Analysis 2017 to 2022 and Forecast 2023 to 2033 17.1. Introduction / Key Findings 17.2. Historical Market Size (US$ Million) and Volume (Units) Analysis, by Market Taxonomy, 2017 to 2022 17.3. Current Market Size (US$ Million) and Volume (Units) Analysis and Forecast, by Market Taxonomy, 2023 to 2033 17.3.1. By Country 17.3.1.1. GCC Countries 17.3.1.2. South Africa 17.3.1.3. Nigeria 17.3.1.4. Rest of Middle East and Africa(MEA) 17.3.2. By Technology Type 17.3.3. By Orientation Type 17.3.4. By End Use Industry 17.4. Market Attractiveness Analysis 17.4.1. By Country 17.4.2. By Technology Type 17.4.3. By Orientation Type 17.4.4. By End Use Industry 18. China Market Analysis 2017 to 2022 and Forecast 2023 to 2033 18.1. Introduction / Key Findings 18.2. Historical Market Size (US$ Million) and Volume (Units) Analysis, by Market Taxonomy, 2017 to 2022 18.3. Current Market Size (US$ Million) and Volume (Units) Analysis and Forecast, by Market Taxonomy, 2023 to 2033 18.3.1. By Technology Type 18.3.2. By Orientation Type 18.3.3. By End Use Industry 18.4. Market Attractiveness Analysis 18.4.1. By Technology Type 18.4.2. By Orientation Type 18.4.3. By End Use Industry 19. Japan Market Analysis 2017 to 2022 and Forecast 2023 to 2033 19.1. Introduction / Key Findings 19.2. Historical Market Size (US$ Million) and Volume (Units) Analysis, by Market Taxonomy, 2017 to 2022 19.3. Current Market Size (US$ Million) and Volume (Units) Analysis and Forecast, by Market Taxonomy, 2023 to 2033 19.3.1. By Technology Type 19.3.2. By Orientation Type 19.3.3. By End Use Industry 19.4. Market Attractiveness Analysis 19.4.1. By Technology Type 19.4.2. By Orientation Type 19.4.3. By End Use Industry 20. Country-wise Market Analysis 20.1. United States (USA) Market Analysis 20.1.1. By Technology Type 20.1.2. By Orientation Type 20.1.3. By End Use Industry 20.2. Canada Market Analysis 20.2.1. By Technology Type 20.2.2. By Orientation Type 20.2.3. By End Use Industry 20.3. Brazil Market Analysis 20.3.1. By Technology Type 20.3.2. By Orientation Type 20.3.3. By End Use Industry 20.4. Mexico Market Analysis 20.4.1. By Technology Type 20.4.2. By Orientation Type 20.4.3. By End Use Industry 20.5. Argentina Market Analysis 20.5.1. By Technology Type 20.5.2. By Orientation Type 20.5.3. By End Use Industry 20.6. Germany Market Analysis 20.6.1. By Technology Type 20.6.2. By Orientation Type 20.6.3. By End Use Industry 20.7. Italy Market Analysis 20.7.1. By Technology Type 20.7.2. By Orientation Type 20.7.3. By End Use Industry 20.8. France Market Analysis 20.8.1. By Technology Type 20.8.2. By Orientation Type 20.8.3. By End Use Industry 20.9. Spain Market Analysis 20.9.1. By Technology Type 20.9.2. By Orientation Type 20.9.3. By End Use Industry 20.10. UK Market Analysis 20.10.1. By Technology Type 20.10.2. By Orientation Type 20.10.3. By End Use Industry 20.11. India Market Analysis 20.11.1. By Technology Type 20.11.2. By Orientation Type 20.11.3. By End Use Industry 20.12. Thailand Market Analysis 20.12.1. By Technology Type 20.12.2. By Orientation Type 20.12.3. By End Use Industry 20.13. Australia Market Analysis 20.13.1. By Technology Type 20.13.2. By Orientation Type 20.13.3. By End Use Industry 20.14. GCC Countries Market Analysis 20.14.1. By Technology Type 20.14.2. By Orientation Type 20.14.3. By End Use Industry 20.15. South Africa Market Analysis 20.15.1. By Technology Type 20.15.2. By Orientation Type 20.15.3. By End Use Industry 21. Market Structure Analysis 21.1. Market Analysis by Tier of Companies (Market) 21.2. Market Share Analysis of Top Players 21.3. Market Presence Analysis 22. Competition Analysis 22.1. Competition Dashboard 22.2. Competition Benchmarking 22.3. Competition Deep Dive 22.3.1. Zhejiang Huangyan Lingma Plastic Machinery Co., Ltd. 22.3.1.1. Overview 22.3.1.2. Product Portfolio 22.3.1.3. Profitability by Market Segments (Product/Channel/Region) 22.3.1.4. Sales Footprint 22.3.1.5. Strategy Overview 22.3.2. Sacmi Imola S.C. 22.3.2.1. Overview 22.3.2.2. Product Portfolio 22.3.2.3. Profitability by Market Segments (Product/Channel/Region) 22.3.2.4. Sales Footprint 22.3.2.5. Strategy Overview 22.3.3. Nissei ASB Machine Co., Ltd. 22.3.3.1. Overview 22.3.3.2. Product Portfolio 22.3.3.3. Profitability by Market Segments (Product/Channel/Region) 22.3.3.4. Sales Footprint 22.3.3.5. Strategy Overview 22.3.4. Chumpower Machinery Corp. 22.3.4.1. Overview 22.3.4.2. Product Portfolio 22.3.4.3. Profitability by Market Segments (Product/Channel/Region) 22.3.4.4. Sales Footprint 22.3.4.5. Strategy Overview 22.3.5. Aoki Technical Laboratory, Inc. 22.3.5.1. Overview 22.3.5.2. Product Portfolio 22.3.5.3. Profitability by Market Segments (Product/Channel/Region) 22.3.5.4. Sales Footprint 22.3.5.5. Strategy Overview 22.3.6. Krones AG 22.3.6.1. Overview 22.3.6.2. Product Portfolio 22.3.6.3. Profitability by Market Segments (Product/Channel/Region) 22.3.6.4. Sales Footprint 22.3.6.5. Strategy Overview 22.3.7. KHS GmbH 22.3.7.1. Overview 22.3.7.2. Product Portfolio 22.3.7.3. Profitability by Market Segments (Product/Channel/Region) 22.3.7.4. Sales Footprint 22.3.7.5. Strategy Overview 22.3.8. Sidel 22.3.8.1. Overview 22.3.8.2. Product Portfolio 22.3.8.3. Profitability by Market Segments (Product/Channel/Region) 22.3.8.4. Sales Footprint 22.3.8.5. Strategy Overview 22.3.9. PET All Manufacturing Inc. 22.3.9.1. Overview 22.3.9.2. Product Portfolio 22.3.9.3. Profitability by Market Segments (Product/Channel/Region) 22.3.9.4. Sales Footprint 22.3.9.5. Strategy Overview 22.3.10. Parker Plastic Machinery Co., Ltd. 22.3.10.1. Overview 22.3.10.2. Product Portfolio 22.3.10.3. Profitability by Market Segments (Product/Channel/Region) 22.3.10.4. Sales Footprint 22.3.10.5. Strategy Overview 22.3.11. Global PET Industries Pvt. Ltd. 22.3.11.1. Overview 22.3.11.2. Product Portfolio 22.3.11.3. Profitability by Market Segments (Product/Channel/Region) 22.3.11.4. Sales Footprint 22.3.11.5. Strategy Overview 22.3.12. Chia Ming Machinery Co., Ltd. 22.3.12.1. Overview 22.3.12.2. Product Portfolio 22.3.12.3. Profitability by Market Segments (Product/Channel/Region) 22.3.12.4. Sales Footprint 22.3.12.5. Strategy Overview 22.3.13. SMF Maschinenfabrik Germany 22.3.13.1. Overview 22.3.13.2. Product Portfolio 22.3.13.3. Profitability by Market Segments (Product/Channel/Region) 22.3.13.4. Sales Footprint 22.3.13.5. Strategy Overview 22.3.14. SIPA S.p.A. 22.3.14.1. Overview 22.3.14.2. Product Portfolio 22.3.14.3. Profitability by Market Segments (Product/Channel/Region) 22.3.14.4. Sales Footprint 22.3.14.5. Strategy Overview 22.3.15. Suzhou Bestar Blow Molding Technology Co., Ltd. 22.3.15.1. Overview 22.3.15.2. Product Portfolio 22.3.15.3. Profitability by Market Segments (Product/Channel/Region) 22.3.15.4. Sales Footprint 22.3.15.5. Strategy Overview 22.3.16. Shyam Plastic Machinery 22.3.16.1. Overview 22.3.16.2. Product Portfolio 22.3.16.3. Profitability by Market Segments (Product/Channel/Region) 22.3.16.4. Sales Footprint 22.3.16.5. Strategy Overview 22.3.17. Guangzhou Tech-Long Packaging Machinery Co., Ltd. 22.3.17.1. Overview 22.3.17.2. Product Portfolio 22.3.17.3. Profitability by Market Segments (Product/Channel/Region) 22.3.17.4. Sales Footprint 22.3.17.5. Strategy Overview 22.3.18. SMI S.p.A 22.3.18.1. Overview 22.3.18.2. Product Portfolio 22.3.18.3. Profitability by Market Segments (Product/Channel/Region) 22.3.18.4. Sales Footprint 22.3.18.5. Strategy Overview 22.3.19. Demark Holding Group 22.3.19.1. Overview 22.3.19.2. Product Portfolio 22.3.19.3. Profitability by Market Segments (Product/Channel/Region) 22.3.19.4. Sales Footprint 22.3.19.5. Strategy Overview 22.3.20. Taizhou Guangdu Plastic Machinery Co., Ltd. 22.3.20.1. Overview 22.3.20.2. Product Portfolio 22.3.20.3. Profitability by Market Segments (Product/Channel/Region) 22.3.20.4. Sales Footprint 22.3.20.5. Strategy Overview 22.3.21. PET Technologies 22.3.21.1. Overview 22.3.21.2. Product Portfolio 22.3.21.3. Profitability by Market Segments (Product/Channel/Region) 22.3.21.4. Sales Footprint 22.3.21.5. Strategy Overview 22.3.22. Jiangsu Victor Machinery CO. Ltd. 22.3.22.1. Overview 22.3.22.2. Product Portfolio 22.3.22.3. Profitability by Market Segments (Product/Channel/Region) 22.3.22.4. Sales Footprint 22.3.22.5. Strategy Overview 22.3.23. GOLFANG Mfg. & Development Co., Ltd. 22.3.23.1. Overview 22.3.23.2. Product Portfolio 22.3.23.3. Profitability by Market Segments (Product/Channel/Region) 22.3.23.4. Sales Footprint 22.3.23.5. Strategy Overview 22.3.24. Mega Machinery 22.3.24.1. Overview 22.3.24.2. Product Portfolio 22.3.24.3. Profitability by Market Segments (Product/Channel/Region) 22.3.24.4. Sales Footprint 22.3.24.5. Strategy Overview 22.3.25. Jomar Corp. 22.3.25.1. Overview 22.3.25.2. Product Portfolio 22.3.25.3. Profitability by Market Segments (Product/Channel/Region) 22.3.25.4. Sales Footprint 22.3.25.5. Strategy Overview 23. Assumptions and Acronyms Used 24. Research Methodology
Let us know your requirement to get
100% FREE customization
List of Tables
Table 01: Global Market Value (US$ Billion) Forecast by Region, 2017 to 2033 Table 02: Global Market Volume (Units) Forecast by Region, 2017 to 2033 Table 03: Global Market Value (US$ Billion) Forecast by Technology Type, 2017 to 2033 Table 04: Global Market Volume (Units) Forecast by Technology Type, 2017 to 2033 Table 05: Global Market Value (US$ Billion) Forecast by Orientation Type, 2017 to 2033 Table 06: Global Market Volume (Units) Forecast by Orientation Type, 2017 to 2033 Table 07: Global Market Value (US$ Billion) Forecast by End Use Industry, 2017 to 2033 Table 08: Global Market Volume (Units) Forecast by End Use Industry, 2017 to 2033 Table 09: North America Market Value (US$ Billion) Forecast by Country, 2017 to 2033 Table 10: North America Market Volume (Units) Forecast by Country, 2017 to 2033 Table 11: North America Market Value (US$ Billion) Forecast by Technology Type, 2017 to 2033 Table 12: North America Market Volume (Units) Forecast by Technology Type, 2017 to 2033 Table 13: North America Market Value (US$ Billion) Forecast by Orientation Type, 2017 to 2033 Table 14: North America Market Volume (Units) Forecast by Orientation Type, 2017 to 2033 Table 15: North America Market Value (US$ Billion) Forecast by End Use Industry, 2017 to 2033 Table 16: North America Market Volume (Units) Forecast by End Use Industry, 2017 to 2033 Table 17: Latin America Market Value (US$ Billion) Forecast by Country, 2017 to 2033 Table 18: Latin America Market Volume (Units) Forecast by Country, 2017 to 2033 Table 19: Latin America Market Value (US$ Billion) Forecast by Technology Type, 2017 to 2033 Table 20: Latin America Market Volume (Units) Forecast by Technology Type, 2017 to 2033 Table 21: Latin America Market Value (US$ Billion) Forecast by Orientation Type, 2017 to 2033 Table 22: Latin America Market Volume (Units) Forecast by Orientation Type, 2017 to 2033 Table 23: Latin America Market Value (US$ Billion) Forecast by End Use Industry, 2017 to 2033 Table 24: Latin America Market Volume (Units) Forecast by End Use Industry, 2017 to 2033 Table 25: Europe Market Value (US$ Billion) Forecast by Country, 2017 to 2033 Table 26: Europe Market Volume (Units) Forecast by Country, 2017 to 2033 Table 27: Europe Market Value (US$ Billion) Forecast by Technology Type, 2017 to 2033 Table 28: Europe Market Volume (Units) Forecast by Technology Type, 2017 to 2033 Table 29: Europe Market Value (US$ Billion) Forecast by Orientation Type, 2017 to 2033 Table 30: Europe Market Volume (Units) Forecast by Orientation Type, 2017 to 2033 Table 31: Europe Market Value (US$ Billion) Forecast by End Use Industry, 2017 to 2033 Table 32: Europe Market Volume (Units) Forecast by End Use Industry, 2017 to 2033 Table 33: APEJC Market Value (US$ Billion) Forecast by Country, 2017 to 2033 Table 34: APEJC Market Volume (Units) Forecast by Country, 2017 to 2033 Table 35: APEJC Market Value (US$ Billion) Forecast by Technology Type, 2017 to 2033 Table 36: APEJC Market Volume (Units) Forecast by Technology Type, 2017 to 2033 Table 37: APEJC Market Value (US$ Billion) Forecast by Orientation Type, 2017 to 2033 Table 38: APEJC Market Volume (Units) Forecast by Orientation Type, 2017 to 2033 Table 39: APEJC Market Value (US$ Billion) Forecast by End Use Industry, 2017 to 2033 Table 40: APEJC Market Volume (Units) Forecast by End Use Industry, 2017 to 2033 Table 41: MEA Market Value (US$ Billion) Forecast by Country, 2017 to 2033 Table 42: MEA Market Volume (Units) Forecast by Country, 2017 to 2033 Table 43: MEA Market Value (US$ Billion) Forecast by Technology Type, 2017 to 2033 Table 44: MEA Market Volume (Units) Forecast by Technology Type, 2017 to 2033 Table 45: MEA Market Value (US$ Billion) Forecast by Orientation Type, 2017 to 2033 Table 46: MEA Market Volume (Units) Forecast by Orientation Type, 2017 to 2033 Table 47: MEA Market Value (US$ Billion) Forecast by End Use Industry, 2017 to 2033 Table 48: MEA Market Volume (Units) Forecast by End Use Industry, 2017 to 2033 Table 51: China Market Value (US$ Billion) Forecast by Technology Type, 2017 to 2033 Table 52: China Market Volume (Units) Forecast by Technology Type, 2017 to 2033 Table 53: China Market Value (US$ Billion) Forecast by Orientation Type, 2017 to 2033 Table 54: China Market Volume (Units) Forecast by Orientation Type, 2017 to 2033 Table 55: China Market Value (US$ Billion) Forecast by End Use Industry, 2017 to 2033 Table 56: China Market Volume (Units) Forecast by End Use Industry, 2017 to 2033 Table 59: Japan Market Value (US$ Billion) Forecast by Technology Type, 2017 to 2033 Table 60: Japan Market Volume (Units) Forecast by Technology Type, 2017 to 2033 Table 61: Japan Market Value (US$ Billion) Forecast by Orientation Type, 2017 to 2033 Table 62: Japan Market Volume (Units) Forecast by Orientation Type, 2017 to 2033 Table 63: Japan Market Value (US$ Billion) Forecast by End Use Industry, 2017 to 2033 Table 64: Japan Market Volume (Units) Forecast by End Use Industry, 2017 to 2033 Table 65: USA Market Value (US$ Billion) Forecast by Technology Type, Orientation Type, and End-Use Industry (2022(E) & 2032(F)) Table 66: Canada Market Value (US$ Billion) Forecast by Technology Type, Orientation Type, and End-Use Industry (2022(E) & 2032(F)) Table 67: Brazil Market Value (US$ Billion) Forecast by Technology Type, Orientation Type, and End-Use Industry (2022(E) & 2032(F)) Table 68: Mexico Market Value (US$ Billion) Forecast by Technology Type, Orientation Type, and End-Use Industry (2022(E) & 2032(F)) Table 69: Argentina Market Value (US$ Billion) Forecast by Technology Type, Orientation Type, and End-Use Industry (2022(E) & 2032(F)) Table 70: Germany Market Value (US$ Billion) Forecast by Technology Type, Orientation Type, and End-Use Industry (2022(E) & 2032(F)) Table 71: Italy Market Value (US$ Billion) Forecast by Technology Type, Orientation Type, and End-Use Industry (2022(E) & 2032(F)) Table 72: France Market Value (US$ Billion) Forecast by Technology Type, Orientation Type, and End-Use Industry (2022(E) & 2032(F)) Table 73: Spain Market Value (US$ Billion) Forecast by Technology Type, Orientation Type, and End-Use Industry (2022(E) & 2032(F)) Table 74: UK Market Value (US$ Billion) Forecast by Technology Type, Orientation Type, and End-Use Industry (2022(E) & 2032(F)) Table 75: India Market Value (US$ Billion) Forecast by Technology Type, Orientation Type, and End-Use Industry (2022(E) & 2032(F)) Table 76: Thailand Market Value (US$ Billion) Forecast by Technology Type, Orientation Type, and End-Use Industry (2022(E) & 2032(F)) Table 77: Australia Market Value (US$ Billion) Forecast by Technology Type, Orientation Type, and End-Use Industry (2022(E) & 2032(F)) Table 78: GCC Countries Market Value (US$ Billion) Forecast by Technology Type, Orientation Type, and End-Use Industry (2022(E) & 2032(F)) Table 79: South Africa Market Value (US$ Billion) Forecast by Technology Type, Orientation Type, and End-Use Industry (2022(E) & 2032(F))
Find your sweet spots for generating winning opportunities in this market.
Talk to AnalystList of Charts
Figure 01: Global Market Value (US$ Billion) by Technology Type, 2023 to 2033 Figure 02: Global Market Value (US$ Billion) by Orientation Type, 2023 to 2033 Figure 03: Global Market Value (US$ Billion) by End Use Industry, 2023 to 2033 Figure 04: Global Market Value (US$ Billion) by Region, 2023 to 2033 Figure 05: Global Market Value (US$ Billion) Analysis by Region, 2017 to 2022 Figure 06: Global Market Volume (Units) Analysis by Region, 2017 to 2033 Figure 07: Global Market Value Share (%) and BPS Analysis by Region, 2023 & 2033 Figure 08: Global Market Y-o-Y Growth (%) Projections by Region, 2023 to 2033 Figure 09: Global Market Value (US$ Billion) Analysis by Technology Type, 2017 to 2022 Figure 10: Global Market Volume (Units) Analysis by Technology Type, 2017 to 2033 Figure 11: Global Market Value Share (%) and BPS Analysis by Technology Type, 2023 & 2033 Figure 12: Global Market Y-o-Y Growth (%) Projections by Technology Type, 2023 to 2033 Figure 13: Global Market Value (US$ Billion) Analysis by Orientation Type, 2017 to 2022 Figure 14: Global Market Volume (Units) Analysis by Orientation Type, 2017 to 2033 Figure 15: Global Market Value Share (%) and BPS Analysis by Orientation Type, 2023 & 2033 Figure 16: Global Market Y-o-Y Growth (%) Projections by Orientation Type, 2023 to 2033 Figure 17: Global Market Value (US$ Billion) Analysis by End Use Industry, 2017 to 2022 Figure 18: Global Market Volume (Units) Analysis by End Use Industry, 2017 to 2033 Figure 19: Global Market Value Share (%) and BPS Analysis by End Use Industry, 2023 & 2033 Figure 20: Global Market Y-o-Y Growth (%) Projections by End Use Industry, 2023 to 2033 Figure 21: Global Market Attractiveness by Technology Type, 2023 to 2033 Figure 22: Global Market Attractiveness by Orientation Type, 2023 to 2033 Figure 23: Global Market Attractiveness by Application, 2023 to 2033 Figure 24: Global Market Attractiveness by End Use Industry, 2023 to 2033 Figure 25: Global Market Attractiveness by Region, 2023 to 2033 Figure 26: North America Market Value (US$ Billion) by Technology Type, 2023 to 2033 Figure 27: North America Market Value (US$ Billion) by Orientation Type, 2023 to 2033 Figure 28: North America Market Value (US$ Billion) by End Use Industry, 2023 to 2033 Figure 29: North America Market Value (US$ Billion) by Country, 2023 to 2033 Figure 30: North America Market Value (US$ Billion) Analysis by Country, 2017 to 2022 Figure 31: North America Market Volume (Units) Analysis by Country, 2017 to 2033 Figure 32: North America Market Value Share (%) and BPS Analysis by Country, 2023 & 2033 Figure 33: North America Market Y-o-Y Growth (%) Projections by Country, 2023 to 2033 Figure 34: North America Market Value (US$ Billion) Analysis by Technology Type, 2017 to 2022 Figure 35: North America Market Volume (Units) Analysis by Technology Type, 2017 to 2033 Figure 36: North America Market Value Share (%) and BPS Analysis by Technology Type, 2023 & 2033 Figure 37: North America Market Y-o-Y Growth (%) Projections by Technology Type, 2023 to 2033 Figure 38: North America Market Value (US$ Billion) Analysis by Orientation Type, 2017 to 2022 Figure 39: North America Market Volume (Units) Analysis by Orientation Type, 2017 to 2033 Figure 40: North America Market Value Share (%) and BPS Analysis by Orientation Type, 2023 & 2033 Figure 41: North America Market Y-o-Y Growth (%) Projections by Orientation Type, 2023 to 2033 Figure 42: North America Market Value (US$ Billion) Analysis by End Use Industry, 2017 to 2022 Figure 43: North America Market Volume (Units) Analysis by End Use Industry, 2017 to 2033 Figure 44: North America Market Value Share (%) and BPS Analysis by End Use Industry, 2023 & 2033 Figure 45: North America Market Y-o-Y Growth (%) Projections by End Use Industry, 2023 to 2033 Figure 46: North America Market Attractiveness by Technology Type, 2023 to 2033 Figure 47: North America Market Attractiveness by Orientation Type, 2023 to 2033 Figure 48: North America Market Attractiveness by End Use Industry, 2023 to 2033 Figure 49: North America Market Attractiveness by Country, 2023 to 2033 Figure 50: Latin America Market Value (US$ Billion) by Technology Type, 2023 & 2033 Figure 51: Latin America Market Value (US$ Billion) by Orientation Type, 2023 to 2033 Figure 52: Latin America Market Value (US$ Billion) by End Use Industry, 2023 to 2033 Figure 53: Latin America Market Value (US$ Billion) by Country, 2023 to 2033 Figure 54: Latin America Market Value (US$ Billion) Analysis by Country, 2017 to 2022 Figure 55: Latin America Market Volume (Units) Analysis by Country, 2017 to 2033 Figure 56: Latin America Market Value Share (%) and BPS Analysis by Country, 2023 & 2033 Figure 57: Latin America Market Y-o-Y Growth (%) Projections by Country, 2023 to 2033 Figure 58: Latin America Market Value (US$ Billion) Analysis by Technology Type, 2017 to 2022 Figure 59: Latin America Market Volume (Units) Analysis by Technology Type, 2017 to 2033 Figure 60: Latin America Market Value Share (%) and BPS Analysis by Technology Type, 2023 & 2033 Figure 61: Latin America Market Y-o-Y Growth (%) Projections by Technology Type, 2023 to 2033 Figure 62: Latin America Market Value (US$ Billion) Analysis by Orientation Type, 2017 to 2022 Figure 63: Latin America Market Volume (Units) Analysis by Orientation Type, 2017 to 2033 Figure 64: Latin America Market Value Share (%) and BPS Analysis by Orientation Type, 2023 & 2033 Figure 65: Latin America Market Y-o-Y Growth (%) Projections by Orientation Type, 2023 to 2033 Figure 66: Latin America Market Value (US$ Billion) Analysis by End Use Industry, 2017 to 2022 Figure 67: Latin America Market Volume (Units) Analysis by End Use Industry, 2017 to 2033 Figure 68: Latin America Market Value Share (%) and BPS Analysis by End Use Industry, 2023 & 2033 Figure 69: Latin America Market Y-o-Y Growth (%) Projections by End Use Industry, 2023 to 2033 Figure 70: Latin America Market Attractiveness by Technology Type, 2023 to 2033 Figure 71: Latin America Market Attractiveness by Orientation Type, 2023 to 2033 Figure 72: Latin America Market Attractiveness by End Use Industry, 2023 to 2033 Figure 73: Latin America Market Attractiveness by Country, 2023 to 2033 Figure 74: Europe Market Value (US$ Billion) by Technology Type, 2023 to 2033 Figure 75: Europe Market Value (US$ Billion) by Orientation Type, 2023 to 2033 Figure 76: Europe Market Value (US$ Billion) by End Use Industry, 2023 to 2033 Figure 77: Europe Market Value (US$ Billion) by Country, 2023 to 2033 Figure 78: Europe Market Value (US$ Billion) Analysis by Country, 2017 to 2022 Figure 79: Europe Market Volume (Units) Analysis by Country, 2017 to 2033 Figure 80: Europe Market Value Share (%) and BPS Analysis by Country, 2023 & 2033 Figure 81: Europe Market Y-o-Y Growth (%) Projections by Country, 2023 to 2033 Figure 82: Europe Market Value (US$ Billion) Analysis by Technology Type, 2017 to 2022 Figure 83: Europe Market Volume (Units) Analysis by Technology Type, 2017 to 2033 Figure 84: Europe Market Value Share (%) and BPS Analysis by Technology Type, 2023 & 2033 Figure 85: Europe Market Y-o-Y Growth (%) Projections by Technology Type, 2023 to 2033 Figure 86: Europe Market Value (US$ Billion) Analysis by Orientation Type, 2017 to 2022 Figure 87: Europe Market Volume (Units) Analysis by Orientation Type, 2017 to 2033 Figure 88: Europe Market Value Share (%) and BPS Analysis by Orientation Type, 2023 & 2033 Figure 89: Europe Market Y-o-Y Growth (%) Projections by Orientation Type, 2023 to 2033 Figure 90: Europe Market Value (US$ Billion) Analysis by End Use Industry, 2017 to 2022 Figure 91: Europe Market Volume (Units) Analysis by End Use Industry, 2017 to 2033 Figure 92: Europe Market Value Share (%) and BPS Analysis by End Use Industry, 2023 & 2033 Figure 93: Europe Market Y-o-Y Growth (%) Projections by End Use Industry, 2023 to 2033 Figure 94: Europe Market Attractiveness by Technology Type, 2023 to 2033 Figure 95: Europe Market Attractiveness by Orientation Type, 2023 to 2033 Figure 96: Europe Market Attractiveness by End Use Industry, 2023 to 2033 Figure 97: Europe Market Attractiveness by Country, 2023 to 2033 Figure 98: APEJC Market Value (US$ Billion) by Technology Type, 2023 to 2033 Figure 99: APEJC Market Value (US$ Billion) by Orientation Type, 2023 to 2033 Figure 100: APEJC Market Value (US$ Billion) by End Use Industry, 2023 to 2033 Figure 101: APEJC Market Value (US$ Billion) by Country, 2023 to 2033 Figure 102: APEJC Market Value (US$ Billion) Analysis by Country, 2017 to 2022 Figure 103: APEJC Market Volume (Units) Analysis by Country, 2017 to 2033 Figure 104: APEJC Market Value Share (%) and BPS Analysis by Country, 2023 & 2033 Figure 105: APEJC Market Y-o-Y Growth (%) Projections by Country, 2023 to 2033 Figure 106: APEJC Market Value (US$ Billion) Analysis by Technology Type, 2017 to 2022 Figure 107: APEJC Market Volume (Units) Analysis by Technology Type, 2017 to 2033 Figure 108: APEJC Market Value Share (%) and BPS Analysis by Technology Type, 2023 & 2033 Figure 109: APEJC Market Y-o-Y Growth (%) Projections by Technology Type, 2023 to 2033 Figure 110: APEJC Market Value (US$ Billion) Analysis by Orientation Type, 2017 to 2022 Figure 111: APEJC Market Volume (Units) Analysis by Orientation Type, 2017 to 2033 Figure 112: APEJC Market Value Share (%) and BPS Analysis by Orientation Type, 2023 & 2033 Figure 113: APEJC Market Y-o-Y Growth (%) Projections by Orientation Type, 2023 to 2033 Figure 114: APEJC Market Value (US$ Billion) Analysis by End Use Industry, 2017 to 2022 Figure 115: APEJC Market Volume (Units) Analysis by End Use Industry, 2017 to 2033 Figure 116: APEJC Market Value Share (%) and BPS Analysis by End Use Industry, 2023 & 2033 Figure 117: APEJC Market Y-o-Y Growth (%) Projections by End Use Industry, 2023 to 2033 Figure 118: APEJC Market Attractiveness by Technology Type, 2023 to 2033 Figure 119: APEJC Market Attractiveness by Orientation Type, 2023 to 2033 Figure 120: APEJC Market Attractiveness by End Use Industry, 2023 to 2033 Figure 121: APEJC Market Attractiveness by Country, 2023 to 2033 Figure 122: MEA Market Value (US$ Billion) by Technology Type, 2023 to 2033 Figure 123: MEA Market Value (US$ Billion) by Orientation Type, 2023 to 2033 Figure 124: MEA Market Value (US$ Billion) by End Use Industry, 2023 to 2033 Figure 125: MEA Market Value (US$ Billion) by Country, 2023 to 2033 Figure 126: MEA Market Value (US$ Billion) Analysis by Country, 2017 to 2022 Figure 127: MEA Market Volume (Units) Analysis by Country, 2017 to 2033 Figure 128: MEA Market Value Share (%) and BPS Analysis by Country, 2023 & 2033 Figure 129: MEA Market Y-o-Y Growth (%) Projections by Country, 2023 to 2033 Figure 130: MEA Market Value (US$ Billion) Analysis by Technology Type, 2017 to 2022 Figure 131: MEA Market Volume (Units) Analysis by Technology Type, 2017 to 2033 Figure 132: MEA Market Value Share (%) and BPS Analysis by Technology Type, 2023 & 2033 Figure 133: MEA Market Y-o-Y Growth (%) Projections by Technology Type, 2023 to 2033 Figure 134: MEA Market Value (US$ Billion) Analysis by Orientation Type, 2017 to 2022 Figure 135: MEA Market Volume (Units) Analysis by Orientation Type, 2017 to 2033 Figure 136: MEA Market Value Share (%) and BPS Analysis by Orientation Type, 2023 & 2033 Figure 137: MEA Market Y-o-Y Growth (%) Projections by Orientation Type, 2023 to 2033 Figure 138: MEA Market Value (US$ Billion) Analysis by End Use Industry, 2017 to 2022 Figure 139: MEA Market Volume (Units) Analysis by End Use Industry, 2017 to 2033 Figure 140: MEA Market Value Share (%) and BPS Analysis by End Use Industry, 2023 & 2033 Figure 141: MEA Market Y-o-Y Growth (%) Projections by End Use Industry, 2023 to 2033 Figure 142: MEA Market Attractiveness by Technology Type, 2023 to 2033 Figure 143: MEA Market Attractiveness by Orientation Type, 2023 to 2033 Figure 144: MEA Market Attractiveness by End Use Industry, 2023 to 2033 Figure 145: MEA Market Attractiveness by Country, 2023 to 2033 Figure 146: China Market Value (US$ Billion) by Technology Type, 2023 to 2033 Figure 147: China Market Value (US$ Billion) by Orientation Type, 2023 to 2033 Figure 148: China Market Value (US$ Billion) by End Use Industry, 2023 to 2033 Figure 149: China Market Value (US$ Billion) Analysis by Technology Type, 2017 to 2022 Figure 150: China Market Volume (Units) Analysis by Technology Type, 2017 to 2033 Figure 151: China Market Value Share (%) and BPS Analysis by Technology Type, 2023 & 2033 Figure 152: China Market Y-o-Y Growth (%) Projections by Technology Type, 2023 to 2033 Figure 153: China Market Value (US$ Billion) Analysis by Orientation Type, 2017 to 2022 Figure 154: China Market Volume (Units) Analysis by Orientation Type, 2017 to 2033 Figure 155: China Market Value Share (%) and BPS Analysis by Orientation Type, 2023 & 2033 Figure 156: China Market Y-o-Y Growth (%) Projections by Orientation Type, 2023 to 2033 Figure 157: China Market Value (US$ Billion) Analysis by End Use Industry, 2017 to 2022 Figure 158: China Market Volume (Units) Analysis by End Use Industry, 2017 to 2033 Figure 159: China Market Value Share (%) and BPS Analysis by End Use Industry, 2023 & 2033 Figure 160: China Market Y-o-Y Growth (%) Projections by End Use Industry, 2023 to 2033 Figure 161: China Market Attractiveness by Technology Type, 2023 to 2033 Figure 162: China Market Attractiveness by Orientation Type, 2023 to 2033 Figure 163: China Market Attractiveness by End Use Industry, 2023 to 2033 Figure 164: Japan Market Value (US$ Billion) by Technology Type, 2023 to 2033 Figure 165: Japan Market Value (US$ Billion) by Orientation Type, 2023 to 2033 Figure 166: Japan Market Value (US$ Billion) by End Use Industry, 2023 to 2033 Figure 167: Japan Market Value (US$ Billion) Analysis by Technology Type, 2017 to 2022 Figure 168: Japan Market Volume (Units) Analysis by Technology Type, 2017 to 2033 Figure 169: Japan Market Value Share (%) and BPS Analysis by Technology Type, 2023 & 2033 Figure 170: Japan Market Y-o-Y Growth (%) Projections by Technology Type, 2023 to 2033 Figure 171: Japan Market Value (US$ Billion) Analysis by Orientation Type, 2017 to 2022 Figure 172: Japan Market Volume (Units) Analysis by Orientation Type, 2017 to 2033 Figure 173: Japan Market Value Share (%) and BPS Analysis by Orientation Type, 2023 & 2033 Figure 174: Japan Market Y-o-Y Growth (%) Projections by Orientation Type, 2023 to 2033 Figure 175: Japan Market Value (US$ Billion) Analysis by End Use Industry, 2017 to 2022 Figure 176: Japan Market Volume (Units) Analysis by End Use Industry, 2017 to 2033 Figure 177: Japan Market Value Share (%) and BPS Analysis by End Use Industry, 2023 & 2033 Figure 178: Japan Market Y-o-Y Growth (%) Projections by End Use Industry, 2023 to 2033 Figure 179: Japan Market Attractiveness by Technology Type, 2023 to 2033 Figure 180: Japan Market Attractiveness by Orientation Type, 2023 to 2033 Figure 181: Japan Market Attractiveness by End Use Industry, 2023 to 2033
Need specific information?
Request CustomizationExplore Packaging Insights
View Reports